Belgrade, MT (Montana) Houses and Residents
| Belgrade: | $466,111 |
| Montana: | $366,400 |
Mean price in 2022:
Detached houses: $299,735
Here: $299,735 State: $518,333 Townhouses or other attached units: $257,973
Here: $257,973 State: $468,033 In 3-to-4-unit structures: $286,345
Here: $286,345 State: $383,074 Mobile homes: $148,140
Here: $148,140 State: $139,111
Total population: 7,798 (Urban population: 5,769 (all inside urban clusters), Rural population: 13 (all nonfarm))
Houses: 4,968 (4,740 occupied: 2,753 owner occupied, 2,084 renter occupied)
| % of renters here: | 43% |
| State: | 31% |
Housing density: 2,975 houses/condos per square mile
Median price asked for vacant for-sale houses and condos in 2022 in this county: $432,793.
Median contract rent in 2022: $1,302 (lower quartile is $908, upper quartile is $1,661)
Median rent asked for vacant for-rent units in 2022: $1,200
Median gross rent in Belgrade, MT in 2022: $1,357
Housing units in Belgrade with a mortgage: 2,114 (130 second mortgage, 0 home equity loan, 114 both second mortgage and home equity loan)
Houses without a mortgage: 43
Median household income for houses/condos with a mortgage: $94,438
Median household income for apartments without a mortgage: $90,990
Median monthly housing costs: $1,444
Compare current foreclosures near Belgrade, MT:
| Photo | Address | Area | Beds / Baths | Price | Details |
|---|---|---|---|---|---|

|
#1
Jackrabbit Ln
Belgrade, MT 59714
|
- sq. feet
|
1 baths 3 beds |
show details | |

|
#2
Washington St
Belgrade, MT 59714
|
1,377 sq. feet
|
2 baths 3 beds |
show details | |

|
#3
Mackenzie Pl
Belgrade, MT 59714
|
1,664 sq. feet
|
2 baths 3 beds |
show details | |

|
#4
Isaiah Trl
Belgrade, MT 59714
|
2,525 sq. feet
|
2 baths 3 beds |
show details | |

|
#5
Ballantyne Rd
Belgrade, MT 59714
|
2,728 sq. feet
|
2 baths 3 beds |
show details | |

|
#6
W Shore Dr
Belgrade, MT 59714
|
- sq. feet
|
- baths - beds |
show details | |

|
#7
Dillinger Rd
Belgrade, MT 59714
|
- sq. feet
|
- baths - beds |
show details | |

|
#8
W Park Ave Apt 1
Belgrade, MT 59714
|
- sq. feet
|
- baths - beds |
show details | |

|
#9
W Park Ave Apt B
Belgrade, MT 59714
|
- sq. feet
|
- baths - beds |
show details | |

|
#10
Cruiser Ln, Unit F
Belgrade, MT 59714
|
- sq. feet
|
- baths - beds |
show details |
| Photo | Address | Area | Beds / Baths | Price | Details |
|---|---|---|---|---|---|

|
#11
Show Pl Apt C
Belgrade, MT 59714
|
- sq. feet
|
- baths - beds |
show details | |

|
#12
9th St # B
Belgrade, MT 59714
|
- sq. feet
|
- baths - beds |
show details | |

|
#13
N River Rock Dr
Belgrade, MT 59714
|
- sq. feet
|
- baths - beds |
show details | |

|
#14
Idaho St Unit B
Belgrade, MT 59714
|
- sq. feet
|
- baths - beds |
show details | |

|
#15
Colorado St Apt 4
Belgrade, MT 59714
|
- sq. feet
|
- baths - beds |
show details | |

|
#16
Buckskin Rd
Belgrade, MT 59714
|
- sq. feet
|
- baths - beds |
show details | |

|
#17
Daisy Dr
Bozeman, MT 59718
|
1,563 sq. feet
|
2 baths 4 beds |
show details | |

|
#18
Buckrake Ave
Bozeman, MT 59718
|
2,561 sq. feet
|
2 baths 4 beds |
show details | |

|
#19
Mary Rd
Bozeman, MT 59718
|
1,608 sq. feet
|
1 baths 3 beds |
show details | |

|
#20
Wrangler Dr
Bozeman, MT 59718
|
2,552 sq. feet
|
2 baths 3 beds |
show details |
| Photo | Address | Area | Beds / Baths | Price | Details |
|---|---|---|---|---|---|

|
#21
Shadow Cir
Bozeman, MT 59715
|
938 sq. feet
|
2 baths 3 beds |
show details | |

|
#22
Rainbow Rd
Bozeman, MT 59715
|
1,986 sq. feet
|
2 baths 3 beds |
show details | |

|
#23
Oscars Run
Manhattan, MT 59741
|
4,204 sq. feet
|
3 baths 4 beds |
show details | |

|
#24
W Main St # 225
Bozeman, MT 59715
|
1,108 sq. feet
|
2 baths 2 beds |
show details | |

|
#25
Eastwood Dr
Bozeman, MT 59718
|
564 sq. feet
|
1 baths 2 beds |
show details | |

|
#26
Laredo Dr
Bozeman, MT 59718
|
1,328 sq. feet
|
1 baths 3 beds |
show details | |

|
#27
Prairie Ave
Bozeman, MT 59718
|
1,724 sq. feet
|
2 baths 3 beds |
show details | |

|
#28
Lower Rainbow Rd
Bozeman, MT 59718
|
1,072 sq. feet
|
2 baths 2 beds |
show details | |

|
#29
Merlin Dr
Bozeman, MT 59718
|
1,568 sq. feet
|
3 baths 3 beds |
show details | |

|
#30
S 3rd Rd
Bozeman, MT 59715
|
5,512 sq. feet
|
2 baths 4 beds |
show details |
| Photo | Address | Area | Beds / Baths | Price | Details |
|---|---|---|---|---|---|

|
#31
Fowler Ave
Bozeman, MT 59718
|
- sq. feet
|
- baths - beds |
show details | |

|
#32
Saddle Peak Cir
Bozeman, MT 59715
|
- sq. feet
|
- baths - beds |
show details | |

|
#33
Ferguson Ave
Bozeman, MT 59718
|
- sq. feet
|
- baths - beds |
show details | |

|
#34
Equestrian Ln
Bozeman, MT 59718
|
- sq. feet
|
- baths - beds |
show details | |

|
#35
N 9th Ave # B
Bozeman, MT 59715
|
- sq. feet
|
- baths - beds |
show details | |

|
#36
W College St # 7
Bozeman, MT 59718
|
- sq. feet
|
- baths - beds |
show details | |

|
#37
White Oak Dr
Bozeman, MT 59718
|
- sq. feet
|
- baths - beds |
show details | |

|
#38
Manzanita Dr # G-108
Bozeman, MT 59715
|
- sq. feet
|
- baths - beds |
show details | |

|
#39
Thomas Dr
Bozeman, MT 59718
|
- sq. feet
|
- baths - beds |
show details | |

|
#40
W Babcock St # 13209
Bozeman, MT 59718
|
- sq. feet
|
- baths - beds |
show details |
| Photo | Address | Area | Beds / Baths | Price | Details |
|---|---|---|---|---|---|

|
#41
Open Rd
Bozeman, MT 59715
|
- sq. feet
|
- baths - beds |
show details | |

|
#42
Golden Gate Ave # B
Bozeman, MT 59718
|
- sq. feet
|
- baths - beds |
show details | |

|
#43
W Babcock St # 18207
Bozeman, MT 59718
|
- sq. feet
|
- baths - beds |
show details | |

|
#44
Talon Way Unit A
Bozeman, MT 59718
|
- sq. feet
|
- baths - beds |
show details | |

|
#45
Talon Way
Bozeman, MT 59718
|
- sq. feet
|
- baths - beds |
show details | |

|
#46
Jackie Jo Jct, Unit 302
Bozeman, MT 59718
|
- sq. feet
|
- baths - beds |
show details | |

|
#47
Snowy Owl Trl
Bozeman, MT 59718
|
- sq. feet
|
- baths - beds |
show details | |

|
#48
Michael Grove Ave Apt D
Bozeman, MT 59718
|
- sq. feet
|
- baths - beds |
show details | |

|
#49
Hilgard Peak Ct
Bozeman, MT 59718
|
- sq. feet
|
- baths - beds |
show details | |

|
Check over 1 million property listings on Foreclosure.com!
|
browse all offers | |||

Latest news about housing in Belgrade, MT collected exclusively by city-data.com from local newspapers, TV, and radio stations

 | Need Rental Home vic Bozeman (23 replies) |
| jobs in Livingston (3 replies) |
| Belgrade schools (2 replies) |
| Bozeman Jobs (17 replies) |
| Is Bozeman the place I'm looking for? (46 replies) |
| Where to rent in Bozeman area with poor credit? (6 replies) |

Median year apartment built: 1993
Household type by relationship:
Households: 11,413- Male householders: 2,068 (854 living alone), Female householders: 2,523 (447 living alone)
2,059 spouses (2,059 opposite-sex spouses), 324 unmarried partners, (324 opposite-sex unmarried partners), 3,261 children (3,136 natural, 37 adopted, 86 stepchildren), 485 grandchildren, 53 brothers or sisters, 17 parents, 0 foster children, 102 other relatives, 495 non-relatives
- In group quarters: 22
Size of family households: 1,180 2-persons, 722 3-persons, 371 4-persons, 180 5-persons, 148 6-persons, 232 7-or-more-persons.
Size of nonfamily households: 1,307 1-person, 765 2-persons, 40 3-persons.
1,961 married couples with children.
587 single-parent households (138 men, 449 women).
96.8% of residents of Belgrade speak English at home.
0.4% of residents speak Spanish at home (100% speak English very well).
1.9% of residents speak other Indo-European language at home (100% speak English very well).
Foreign born population: 184 (1.6%)
(103.3% of them are naturalized citizens)
| Here: | 5.7 |
| State: | 6.4 |
| Here: | 4.3 |
| State: | 4.2 |

- Bedrooms in owner-occupied houses and condos in Belgrade, Montana
- 0no bedroom
- 01 bedroom
- 2302 bedrooms
- 1,6993 bedrooms
- 6664 bedrooms
- 1585+ bedrooms

- Bedrooms in renter-occupied apartments in Belgrade, Montana
- 125no bedroom
- 4551 bedroom
- 7372 bedrooms
- 5983 bedrooms
- 1464 bedrooms
- 235+ bedrooms

- Cars and other vehicles available in Belgrade in owner-occupied houses/condos
- 76no vehicle
- 4041 vehicle
- 1,1642 vehicles
- 8223 vehicles
- 2514 vehicles
- 365+ vehicles

- Cars and other vehicles available in Belgrade in renter-occupied apartments
- 14no vehicle
- 9851 vehicle
- 6802 vehicles
- 2923 vehicles
- 1004 vehicles
- 135+ vehicles

- Rooms in owner-occupied houses in Belgrade, Montana
- 01 room
- 02 rooms
- 03 rooms
- 4254 rooms
- 6985 rooms
- 7266 rooms
- 3117 rooms
- 2858 rooms
- 3089+ rooms

- Rooms in renter-occupied apartments in Belgrade, Montana
- 1251 room
- 2242 rooms
- 3283 rooms
- 5324 rooms
- 3465 rooms
- 2406 rooms
- 1567 rooms
- 988 rooms
- 369+ rooms


Belgrade, MT household income distribution

- 271Less than $10,000
- 226$10,000 to $19,999
- 175$20,000 to $29,999
- 508$30,000 to $39,999
- 184$40,000 to $49,999
- 356$50,000 to $59,999
- 400$60,000 to $74,999
- 1,053$75,000 to $99,999
- 940$100,000 to $124,999
- 295$125,000 to $149,999
- 168$150,000 to $199,999
- 383$200,000 or more

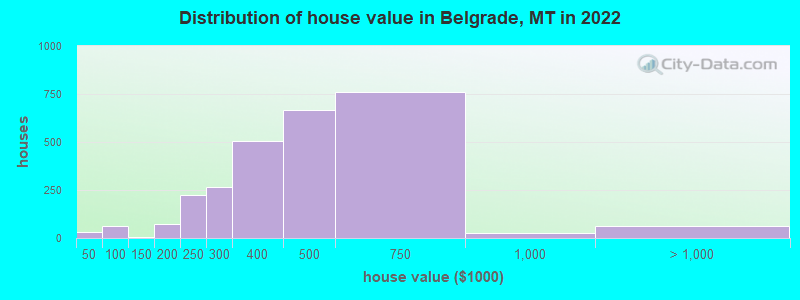
Home value of owner - occupied houses in 2022 in Belgrade, MT
-
- 29$40,000 to $49,999
- 23$60,000 to $69,999
- 8$90,000 to $99,999
- 6$100,000 to $124,999
- 71$175,000 to $199,999
- 221$200,000 to $249,999
- 264$250,000 to $299,999
- 506$300,000 to $399,999
- 665$400,000 to $499,999
- 758$500,000 to $749,999
- 23$750,000 to $999,999
- 60$1,500,000 to $1,999,999
Rent paid by renters in 2022 in Belgrade, MT
-
- 28$200 to $249
- 101$350 to $399
- 90$500 to $549
- 154$600 to $649
- 50$650 to $699
- 80$750 to $799
- 149$800 to $899
- 141$900 to $999
- 313$1,000 to $1,249
- 384$1,250 to $1,499
- 373$1,500 to $1,999
- 267$2,000 to $2,499


Percentage of workers working in this county: 99.0%
Number of people working at home: 871 (12.9% of all workers)
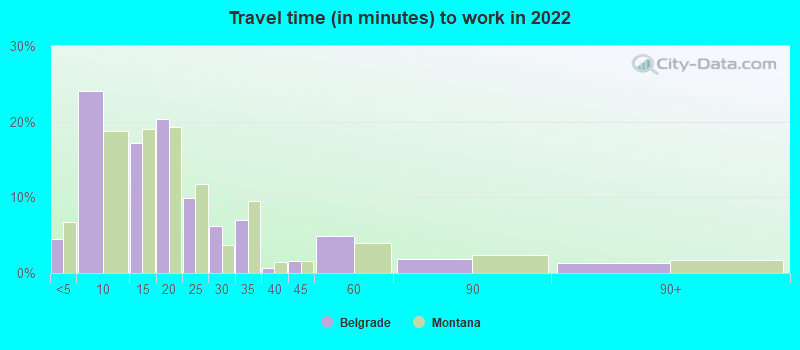
Travel time to work (commute)
- Less than 5 minutes: 194
- 5 to 9 minutes: 762
- 10 to 14 minutes: 764
- 15 to 19 minutes: 948
- 20 to 24 minutes: 1,272
- 25 to 29 minutes: 595
- 30 to 34 minutes: 545
- 35 to 39 minutes: 33
- 40 to 44 minutes: 196
- 45 to 59 minutes: 305
- 60 to 89 minutes: 55
- 90 or more minutes: 132
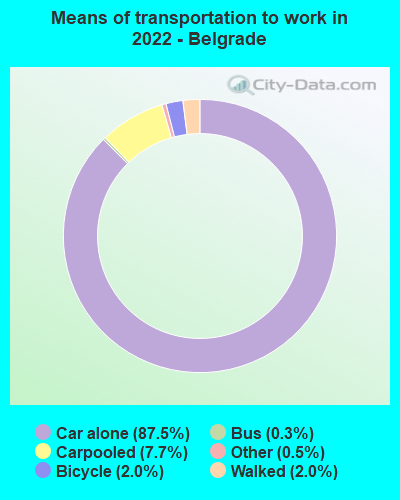
Means of transportation to work:
- Drove a car alone: 2,356 (67.7%)
- Carpooled: 188 (5.4%)
- Bus: 4 (0.1%)
- Taxi: 14 (0.4%)
- Bicycle: 54 (1.6%)
- Walked: 56 (1.6%)
- Worked at home: 871 (25.0%)

- Unemployment by race in 2022
- Unemployment rate for White non-Hispanic residents
- 0.9%Males
- 3.6%Females

- Year of entry for the foreign-born population in Belgrade, Montana
- 472010 or later
- 02000 to 2009
- 01990 to 1999
- 231980 to 1989
- 151970 to 1979
- 6Before 1970

First ancestries reported:
- German: 926 (25.4%)
- English: 921 (25.3%)
- American: 341 (9.4%)
- Irish: 169 (4.6%)
- European: 123 (3.4%)
- Scottish: 116 (3.2%)
- Romanian: 103 (2.8%)
- Italian: 94 (2.6%)
- Norwegian: 83 (2.3%)
- Scandinavian: 83 (2.3%)
- French: 74 (2.0%)
- Dutch: 68 (1.9%)
- Welsh: 37 (1.0%)
- Northern European: 33 (0.9%)
- Finnish: 22 (0.6%)
- British: 18 (0.5%)
- Swedish: 17 (0.5%)
- Hungarian: 14 (0.4%)
- Czech: 11 (0.3%)
- Icelander: 10 (0.3%)
- Scotch-Irish: 10 (0.3%)
Most common places of birth for foreign-born residents (%):
| Belgrade: | 22.0% (40) |
| Montana: | 0.9% (213) |
| Belgrade: | 18.1% (33) |
| Montana: | 2.3% (578) |
| Belgrade: | 14.3% (26) |
| Montana: | 2.7% (666) |
| Belgrade: | 12.6% (23) |
| Montana: | 1.0% (259) |
| Belgrade: | 11.5% (21) |
| Montana: | 1.0% (250) |
| Belgrade: | 9.9% (18) |
| Montana: | 1.0% (255) |
| Belgrade: | 8.8% (16) |
| Montana: | 14.2% (3,503) |
Place of birth for U.S.-born residents:
- This state: 5,831
- Other state: 5,413
- Northeast: 562
- Midwest: 1,036
- South: 743
- West: 3,084
87.9% of Belgrade residents lived in the same house 1 years ago.
Out of people who lived in different houses, 28.1% lived in this county.
Out of people who lived in different counties, 23.0% lived in Montana.
| Belgrade: | 87.9% |
| State average: | 86.7% |
Education attainment for males 25 years and older:
- No schooling: 25
- Nursery to 4th grade: 0
- 5th and 6th grade: 0
- 7th and 8th grade: 0
- 9th grade: 0
- 10th grade: 0
- 11th grade: 22
- 12th grade, no diploma: 83
- High school graduate (or equivalency): 1,015
- Less than 1 year of college: 338
- Some college more than 1 year, no degree: 619
- Associate degree: 337
- Bachelor's degree: 930
- Master's degree: 275
- Professional school degree: 23
- Doctorate degree: 77

Education attainment for females 25 years and older:
- No schooling: 0
- Nursery to 4th grade: 0
- 5th and 6th grade: 18
- 7th and 8th grade: 2
- 9th grade: 0
- 10th grade: 0
- 11th grade: 0
- 12th grade, no diploma: 51
- High school graduate (or equivalency): 941
- Less than 1 year of college: 202
- Some college more than 1 year, no degree: 471
- Associate degree: 324
- Bachelor's degree: 1,122
- Master's degree: 283
- Professional school degree: 61
- Doctorate degree: 83


Housing units in structures:
- One, detached: 3,121
- One, attached: 349
- Two: 123
- 3 or 4: 665
- 5 to 9: 118
- 10 to 19: 253
- 20 to 49: 35
- Mobile homes: 220
- Boats, RVs, vans, etc.: 79
Housing units lacking complete kitchen facilities in 2022: 0.3%
House/condo owner moved in on average 8 years ago
Renter moved in on average 4 years ago

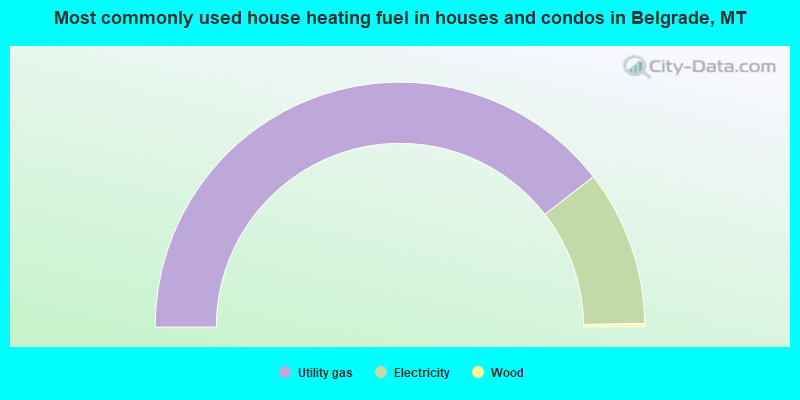
- 78.9%Utility gas
- 20.6%Electricity
- 0.4%Wood
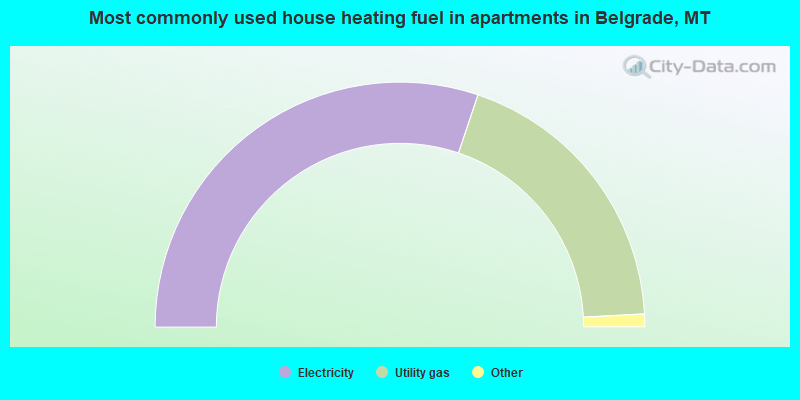
- 60.4%Electricity
- 38.0%Utility gas
- 0.9%Bottled, tank, or LP gas
- 0.7%No fuel used
Private vs. public school enrollment:
| Here: | 62.1% |
| Montana: | 15.3% |
| Here: | 17.5% |
| Montana: | 12.2% |
| Here: | 0.0% |
| Montana: | 15.0% |


