Wylie: Fire Incidents, Texas (TX)
Where are fire incidents reported in Wylie, TX
Something went wrong! Please refresh the page.
| Fire incidents reported | |
|---|---|
| Sreet name | Count |
| HWY 78 | 98 |
| FM 544 | 92 |
| STATE HIGHWAY 78 | 76 |
| SKYVIEW DR | 62 |
| BALLARD AVE | 54 |
| BROWN ST | 54 |
| FLEMING ST | 50 |
| COUNTRY CLUB RD | 48 |
| MCMILLEN RD | 38 |
| HENSLEY LN | 36 |
| MARTINEZ LN | 34 |
| STONE RD | 34 |
| WESTGATE WAY | 34 |
| PARKER RD | 32 |
| GLEN KNOLL MHP | 30 |
| COUNTY LINE RD | 28 |
| MARBLE ST | 28 |
| FIRST ST | 26 |
| TROY RD | 26 |
| ALANIS DR | 24 |
| REGENCY DR | 24 |
| KREYMER LN | 22 |
| MCCREARY RD | 20 |
| OLIVIA DR | 18 |
| PAUL WILSON RD | 18 |
| SECOND ST | 18 |
| WINDING OAKS DR | 18 |
| GARY WAY | 16 |
| JACKSON AVE | 16 |
| STONEYBROOK DR | 16 |
| Other | 473 |
2002 - 2018 National Fire Incident Reporting System (NFIRS) incidents
- Incident types reported to NFIRS in Wylie, TX
- 11,34753.9%Rescue & EMS
- 2,70512.9%Hazardous Condition
- 2,0549.8%Service Call
- 1,9229.1%False Alarm
- 1,5637.4%Fire
- 1,3516.4%Good Intent Call
- 670.3%Severe Weather
- Fire incident types reported to NFIRS in Wylie, TX
- 68143.6%Structure Fires
- 63840.8%Outside Fires
- 19412.4%Mobile Property/Vehicle Fires
- 503.2%Other
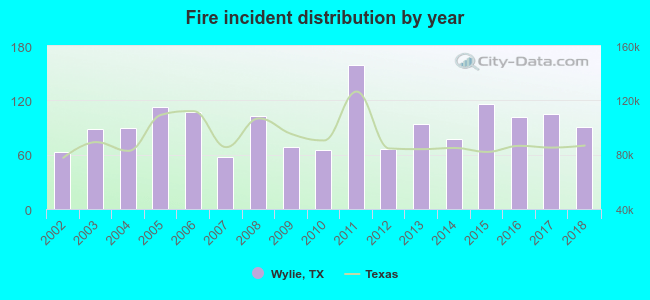 According to the data from the years 2002 - 2018 the average number of fires per year is 92. The highest number of reported fires - 159 took place in 2011, and the least - 57 in 2007. The data has an increasing trend.
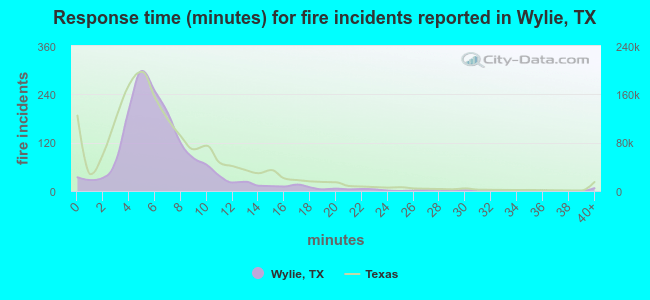 The median response time based on all reported fire incidents is 6 minutes. This is comparable to the state median value.
The median response time in Wylie, TX compared to nearest cities:
(Note: Based on data for all years, including only cities with at least 500 fire incidents)
| Wylie: | 6 minutes |
| Sachse: | 6 minutes |
| Lucas: | 9 minutes |
| Rowlett: | 6 minutes |
| Rockwall: | 5 minutes |
| Allen: | 6 minutes |
| Garland: | 5 minutes |
| Fate: | 8 minutes |
| Princeton: | 11 minutes |
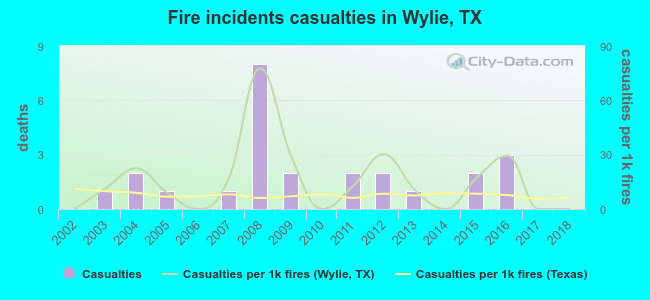 Based on the reports from the years 2002 - 2018 the average number of fire-related casualties per year is 1. The highest number of injuries - 8 took place in 2008, and the lowest - 0 in 2002. The data has a constant trend.
The average number of casualties per 1,000 fire incidents is 16. This indicator was the highest - 78 in 2008, and the lowest 0 in 2002. The trend for casualties per 1,000 fire incidents is constant. Compared to the state value the number of injuries per 1,000 fire incidents is much higher.
Based on the reports from the years 2002 - 2018 the average number of fire-related casualties per year is 1. The highest number of injuries - 8 took place in 2008, and the lowest - 0 in 2002. The data has a constant trend.
The average number of casualties per 1,000 fire incidents is 16. This indicator was the highest - 78 in 2008, and the lowest 0 in 2002. The trend for casualties per 1,000 fire incidents is constant. Compared to the state value the number of injuries per 1,000 fire incidents is much higher.
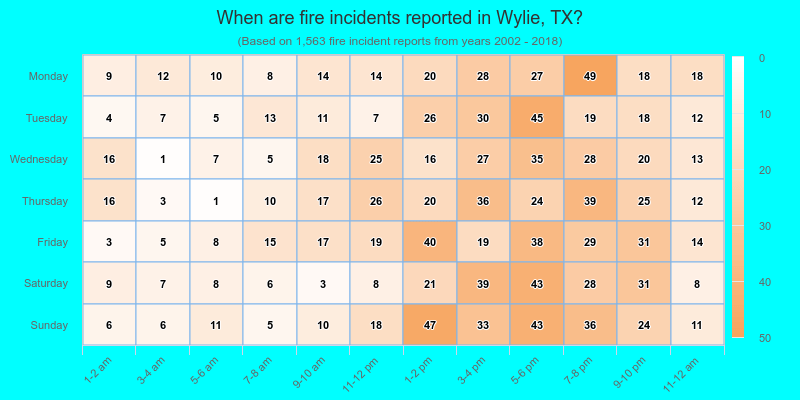
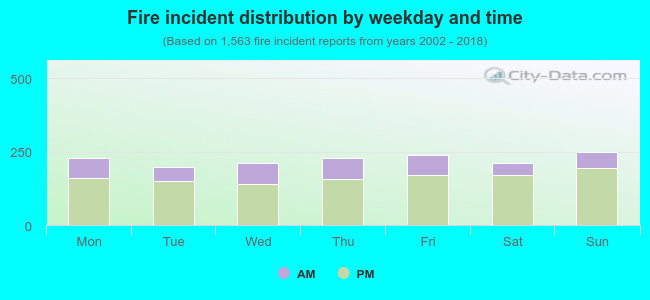 27.1% incidents where reported in the morning and 72.9% in the evening. The most fires (16.0%) took place on Sunday, and the least (12.6%) on Tuesday.
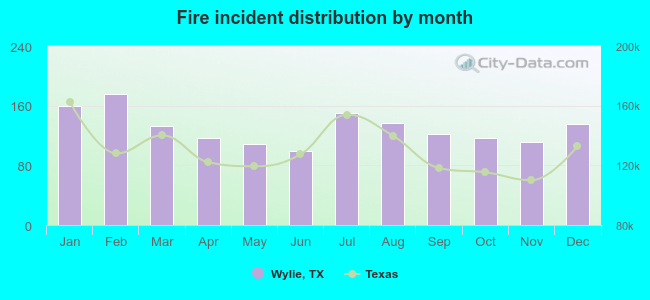 Based on the 1,563 fires from years 2002 - 2018 most fires (11.2%) took place during February, and the least (6.3%) in June.
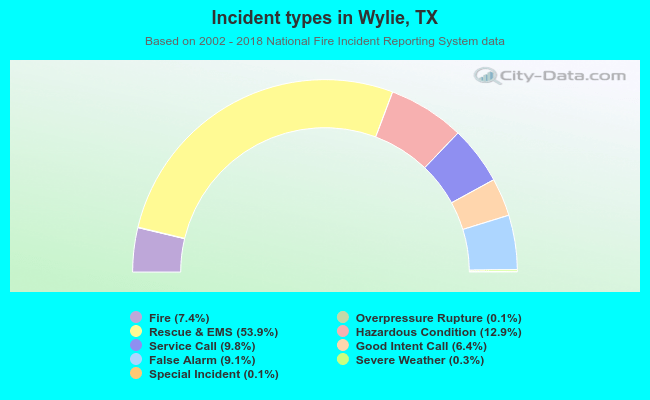 Out of all 21,036 cases reported during the years 2002 - 2018, the most belonged to the categories: Rescue & EMS (53.9%), Hazardous Condition (12.9%), and Service Call (9.8%).
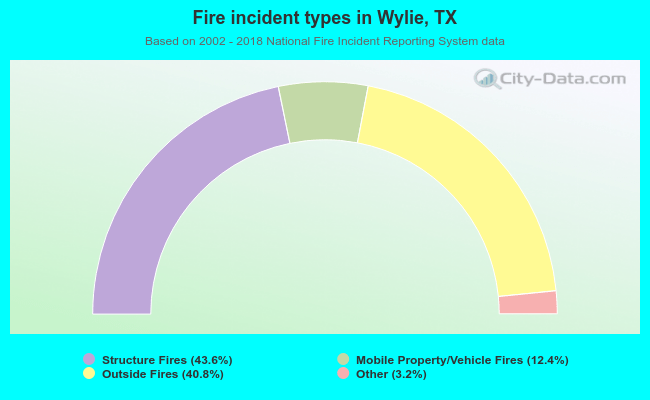 When looking into fire subcategories, the most incidents belonged to: Structure Fires (43.6%), and Outside Fires (40.8%).