Westmoreland: Fire Incidents, New York (NY)
Where are fire incidents reported in Westmoreland, NY
Something went wrong! Please refresh the page.
|
| |||||||||||||||||||||||||||||||||||||||||||||||||||||||||||||||||||||||||||||||||||||||||||||||||||||||||||||
2002 - 2018 National Fire Incident Reporting System (NFIRS) incidents
- Incident types reported to NFIRS in Westmoreland, NY
- 1,49251.7%Rescue & EMS
- 51617.9%Good Intent Call
- 2578.9%Hazardous Condition
- 2448.5%Fire
- 1996.9%False Alarm
- 1575.4%Service Call
- 170.6%Severe Weather
- 30.1%Overpressure Rupture
- Fire incident types reported to NFIRS in Westmoreland, NY
- 10743.9%Structure Fires
- 8434.4%Mobile Property/Vehicle Fires
- 4116.8%Outside Fires
- 124.9%Other
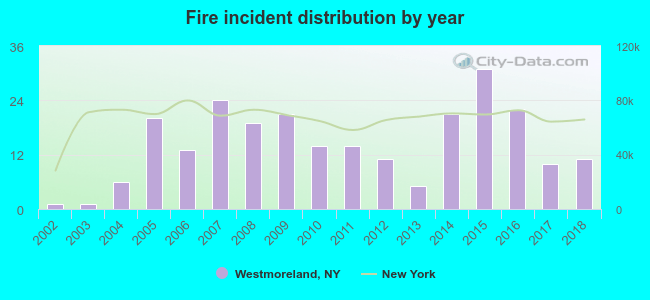 Based on the data from the years 2002 - 2018 the average number of fires per year is 14. The highest number of reported fires - 31 took place in 2015, and the least - 1 in 2002. The data has a growing trend.
The average number of yearly fire incidents per 10k residents in Westmoreland, NY compared to nearest cities:
(Note: Based on data for the last 3 years, including only cities with population 5,000 and above)
| Westmoreland: | 23.4 |
| Rome: | 9.5 |
| Whitestown: | 1.1 |
| Verona: | 48.7 |
| Marcy: | 29.3 |
| Oneida: | 37.2 |
| Utica: | 44.8 |
| Lee: | 1.5 |
| Vienna: | 5.5 |
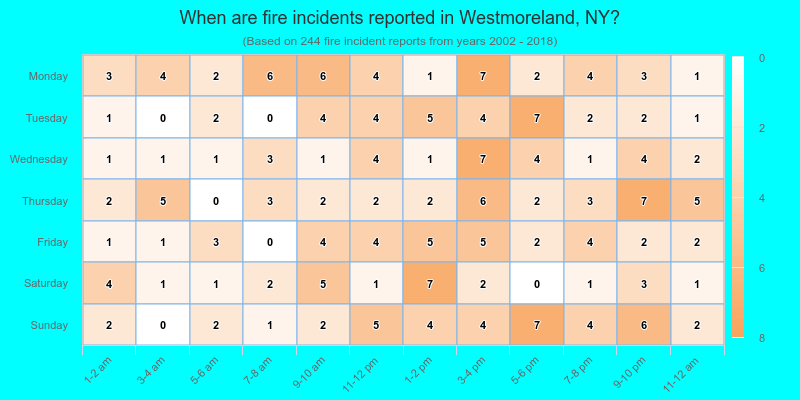
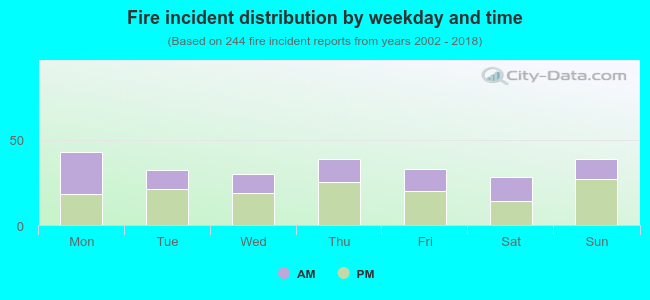 41.0% incidents where reported in the morning and 59.0% in the evening. The most fires (17.6%) took place on Monday, and the least (11.5%) on Saturday.
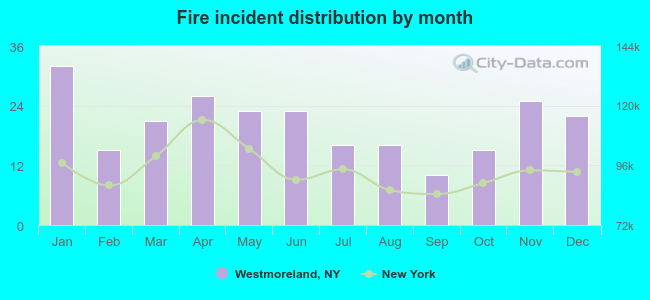 According to the 244 fires from years 2002 - 2018 most fires (13.1%) took place during January, and the least (4.1%) in September.
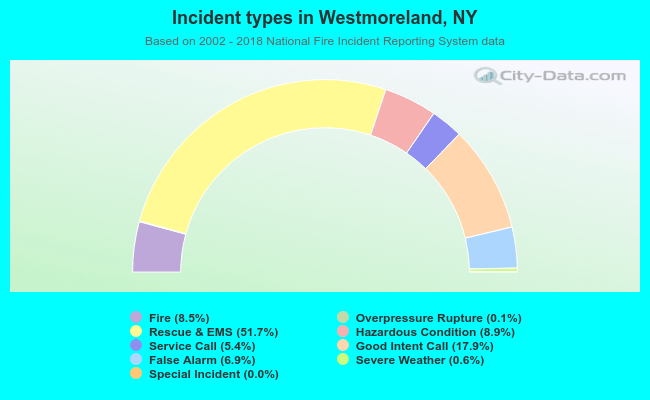 Out of all 2,886 cases reported during the years 2002 - 2018, the most belonged to the categories: Rescue & EMS (51.7%), Good Intent Call (17.9%), and Hazardous Condition (8.9%).
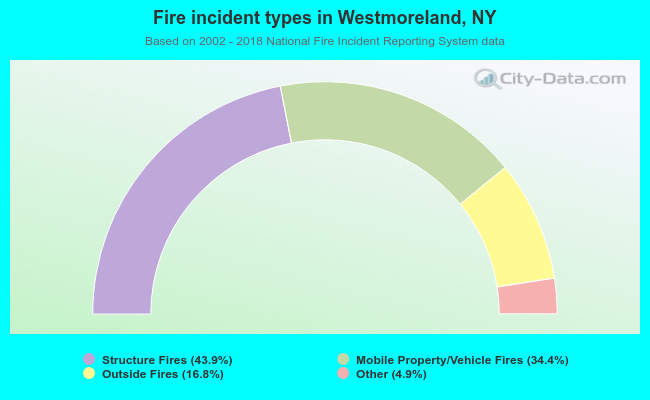 When looking into fire subcategories, the most reports belonged to: Structure Fires (43.9%), and Mobile Property/Vehicle Fires (34.4%).