Westbury: Fire Incidents, New York (NY)
Where are fire incidents reported in Westbury, NY
Something went wrong! Please refresh the page.
|
| |||||||||||||||||||||||||||||||||||||||||||||||||||||||||||||||||||||||||||||||||||||||||||||||||||||||||||||
2002 - 2018 National Fire Incident Reporting System (NFIRS) incidents
- Incident types reported to NFIRS in Westbury, NY
- 2,00632.7%False Alarm
- 1,32221.6%Rescue & EMS
- 1,15418.8%Hazardous Condition
- 95115.5%Good Intent Call
- 3545.8%Service Call
- 3305.4%Fire
- 80.1%Special Incident
- 70.1%Overpressure Rupture
- Fire incident types reported to NFIRS in Westbury, NY
- 19960.3%Structure Fires
- 6620.0%Outside Fires
- 3911.8%Other
- 267.9%Mobile Property/Vehicle Fires
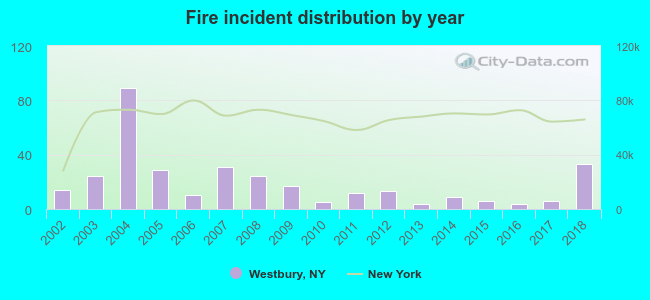 According to the data from the years 2002 - 2018 the average number of fires per year is 19. The highest number of fires - 89 took place in 2004, and the least - 4 in 2013. The data has a rising trend.
The average number of yearly fire incidents per 10k residents in Westbury, NY compared to nearest cities:
(Note: Based on data for the last 3 years, including only cities with population 5,000 and above)
| Westbury: | 9.4 |
| New Cassel: | 0.7 |
| Salisbury: | 5.0 |
| Mineola: | 15.4 |
| Williston Park: | 14.1 |
| East Hills: | 9.9 |
| Roslyn Heights: | 6.6 |
| Albertson: | 3.9 |
| Jericho: | 14.0 |

 30.3% incidents where reported in the morning and 69.7% in the evening. The most fires (17.0%) took place on Sunday, and the least (13.0%) on Saturday.
 Based on the 330 reports from years 2002 - 2018 most fires (10.3%) took place during May, and the least (6.1%) in December.
 Out of all 6,134 cases reported during the years 2002 - 2018, the most belonged to the categories: False Alarm (32.7%), Rescue & EMS (21.6%), and Hazardous Condition (18.8%).
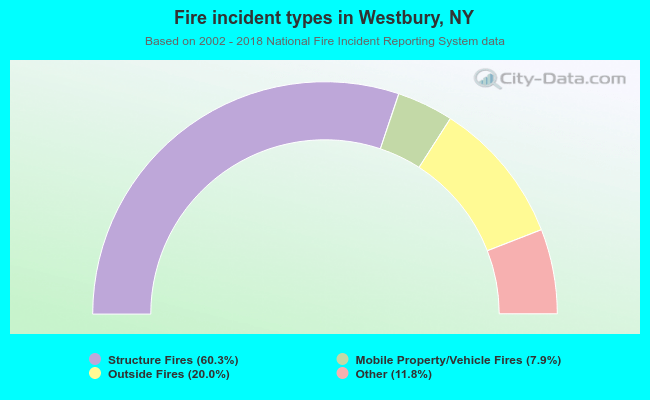 When looking into fire subcategories, the most reports belonged to: Structure Fires (60.3%), and Outside Fires (20.0%).