Watauga: Fire Incidents, Texas (TX)
Where are fire incidents reported in Watauga, TX
Something went wrong! Please refresh the page.
|
| |||||||||||||||||||||||||||||||||||||||||||||||||||||||||||||||||||||||||||||||||||||||||||||||||||||||||||||
2002 - 2018 National Fire Incident Reporting System (NFIRS) incidents
- Incident types reported to NFIRS in Watauga, TX
- 5,69559.3%Rescue & EMS
- 1,18212.3%Service Call
- 1,11111.6%Good Intent Call
- 5485.7%Fire
- 5365.6%False Alarm
- 4935.1%Hazardous Condition
- 350.4%Special Incident
- Fire incident types reported to NFIRS in Watauga, TX
- 34563.0%Structure Fires
- 11721.4%Outside Fires
- 458.2%Other
- 417.5%Mobile Property/Vehicle Fires
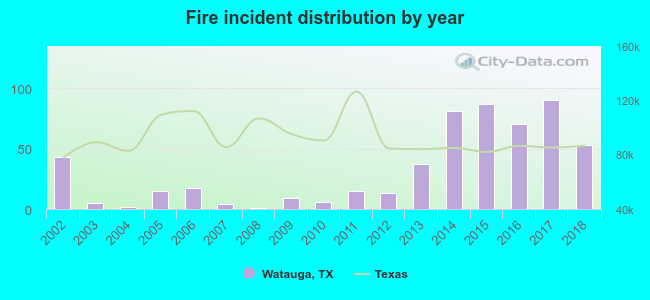 Based on the data from the years 2002 - 2018 the average number of fires per year is 32. The highest number of reported fire incidents - 90 took place in 2017, and the least - 1 in 2008. The data has a rising trend.
The average number of yearly fire incidents per 10k residents in Watauga, TX compared to nearest cities:
(Note: Based on data for the last 3 years, including only cities with population 5,000 and above)
| Watauga: | 29.2 |
| North Richland Hills: | 22.3 |
| Keller: | 24.5 |
| Haltom City: | 42.3 |
| Richland Hills: | 17.8 |
| Hurst: | 28.8 |
| Colleyville: | 22.2 |
| Bedford: | 29.2 |
| Saginaw: | 31.8 |
 The median response time based on all reported fire incidents is 6 minutes. This is close to the state median value.
The median response time in Watauga, TX compared to nearest cities:
(Note: Based on data for all years, including only cities with at least 500 fire incidents)
| Watauga: | 6 minutes |
| North Richland Hills: | 6 minutes |
| Keller: | 6 minutes |
| Haltom City: | 5 minutes |
| Richland Hills: | 5 minutes |
| Hurst: | 5 minutes |
| Colleyville: | 7 minutes |
| Bedford: | 4 minutes |
| Saginaw: | 5 minutes |
 28.5% incidents where reported in the morning and 71.5% in the evening. The most fires (16.1%) took place on Monday, and the least (11.3%) on Friday.
 According to the 548 reports from years 2002 - 2018 most fires (11.9%) took place during April, and the least (4.6%) in September.
 Out of all 9,611 cases reported during the years 2002 - 2018, the most belonged to the categories: Rescue & EMS (59.3%), Service Call (12.3%), and Good Intent Call (11.6%).
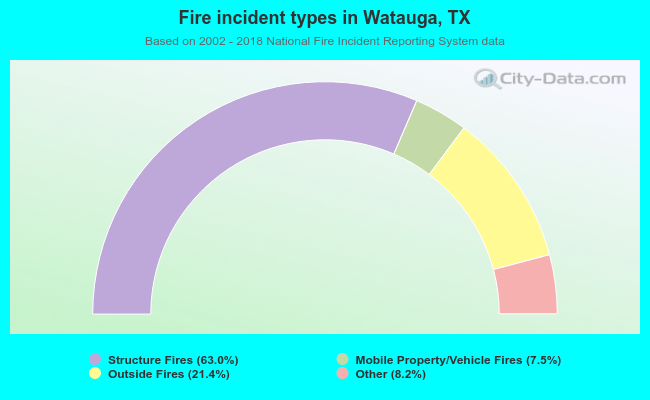 When looking into fire subcategories, the most reports belonged to: Structure Fires (63.0%), and Outside Fires (21.4%).