Union City: Fire Incidents, Georgia (GA)
Where are fire incidents reported in Union City, GA
Something went wrong! Please refresh the page.
| Fire incidents reported | |
|---|---|
| Sreet name | Count |
| JONESBORO RD | 218 |
| OAKLEY RD | 174 |
| FLAT SHOALS RD | 126 |
| BUFFINGTON RD | 82 |
| SHANNON PKY | 76 |
| FLATSHOALS RD | 72 |
| ROOSEVELT HWY | 58 |
| GOODSON RD | 50 |
| INTERSTATE 85 HWY | 46 |
| SOUTH FULTON PKY | 46 |
| HIGHPOINT RD | 44 |
| MORGAN RD | 40 |
| LESTER RD | 34 |
| THOMPSON RD | 26 |
| LOWER DIXIE LAKE RD | 22 |
| THOMPSON DR | 22 |
| COTTAGE GROVE PL | 20 |
| DODSON RD | 20 |
| WESTBROOK PL | 20 |
| HICKORY LANE CIR | 18 |
| INTERSTATE 85 EXPY | 18 |
| LAKESIDE DR | 18 |
| MASON RD | 16 |
| PETERS RD | 16 |
| RAYMOND DR | 16 |
| WESTBROOK RD | 16 |
| MCCLURE RD | 14 |
| OLD JONESBORO RD | 14 |
| STONEWALL TELL RD | 14 |
| ALEXANDER AVE | 12 |
2003 - 2018 National Fire Incident Reporting System (NFIRS) incidents
- Incident types reported to NFIRS in Union City, GA
- 13,12667.8%Rescue & EMS
- 1,5588.1%Service Call
- 1,5558.0%Good Intent Call
- 1,3396.9%Fire
- 9585.0%False Alarm
- 7573.9%Hazardous Condition
- 240.1%Special Incident
- 210.1%Severe Weather
- Fire incident types reported to NFIRS in Union City, GA
- 60545.2%Outside Fires
- 38728.9%Structure Fires
- 26519.8%Mobile Property/Vehicle Fires
- 826.1%Other
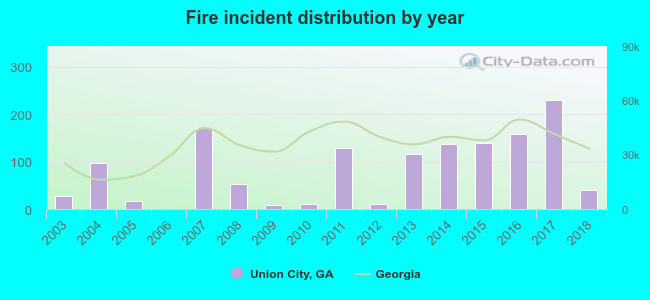 Based on the data from the years 2003 - 2018 the average number of fire incidents per year is 84. The highest number of fires - 229 took place in 2017, and the least - 0 in 2006. The data has an increasing trend.
The average number of yearly fire incidents per 10k residents in Union City, GA compared to nearest cities:
(Note: Based on data for the last 3 years, including only cities with population 5,000 and above)
| Union City: | 69.7 |
| Fairburn: | 60.6 |
| College Park: | 167.6 |
| Riverdale: | 147.4 |
| Tyrone: | 30.8 |
| East Point: | 37.5 |
| Hapeville: | 43.0 |
| Fayetteville: | 114.4 |
| Forest Park: | 76.9 |
 The median response time based on all reported fire incidents is 5 minutes. This is lower compared to the Georgia median value.
The median response time in Union City, GA compared to nearest cities:
(Note: Based on data for all years, including only cities with at least 500 fire incidents)
| Union City: | 5 minutes |
| Fairburn: | 6 minutes |
| College Park: | 6 minutes |
| Riverdale: | 5 minutes |
| Palmetto: | 6 minutes |
| East Point: | 6 minutes |
| Hapeville: | 3 minutes |
| Fayetteville: | 6 minutes |
| Forest Park: | 6 minutes |
 25.6% incidents where reported in the morning and 74.4% in the evening. The most fires (17.6%) took place on Sunday, and the least (12.2%) on Friday.
 Based on the 1,339 fire incidents from years 2003 - 2018 most fires (12.0%) took place during January, and the least (5.7%) in September.
 Out of all 19,350 cases reported during the years 2003 - 2018, the most belonged to the categories: Rescue & EMS (67.8%), Service Call (8.1%), and Good Intent Call (8.0%).
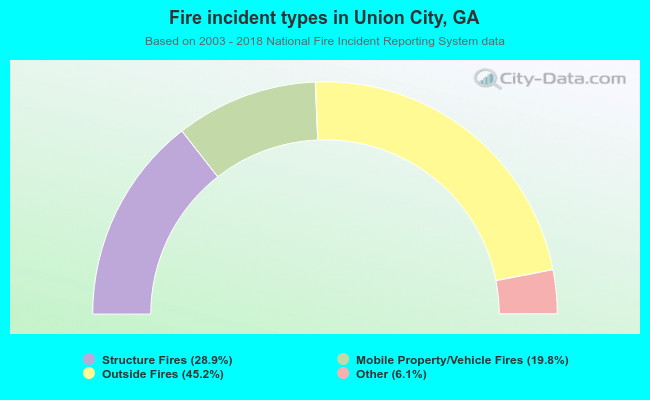 When looking into fire subcategories, the most incidents belonged to: Outside Fires (45.2%), and Structure Fires (28.9%).