Tell City: Fire Incidents, Indiana (IN)
Where are fire incidents reported in Tell City, IN
Something went wrong! Please refresh the page.
|
| |||||||||||||||||||||||||||||||||||||||||||||||||||||||||||||||||||||||||||||||||||||||||||||||||||||||||||||
2003 - 2018 National Fire Incident Reporting System (NFIRS) incidents
- Incident types reported to NFIRS in Tell City, IN
- 43269.9%Fire
- 9214.9%False Alarm
- 365.8%Hazardous Condition
- 274.4%Good Intent Call
- 142.3%Rescue & EMS
- 81.3%Service Call
- 50.8%Overpressure Rupture
- 40.6%Special Incident
- Fire incident types reported to NFIRS in Tell City, IN
- 21349.3%Structure Fires
- 9922.9%Outside Fires
- 7918.3%Mobile Property/Vehicle Fires
- 419.5%Other
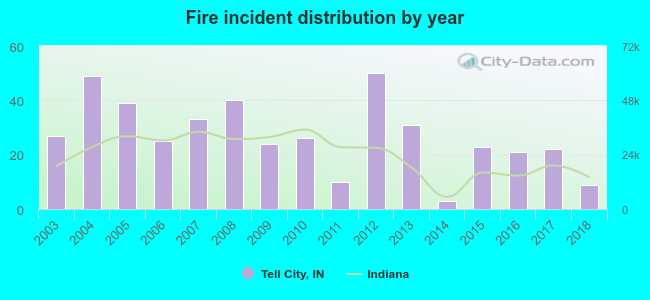 According to the data from the years 2003 - 2018 the average number of fires per year is 27. The highest number of fires - 50 took place in 2012, and the least - 3 in 2014. The data has a dropping trend.
The average number of yearly fire incidents per 10k residents in Tell City, IN compared to nearest cities:
(Note: Based on data for the last 3 years, including only cities with population 5,000 and above)
| Tell City: | 23.9 |
| Huntingburg: | 22.6 |
| Boonville: | 37.9 |
| Jasper: | 16.7 |
| Evansville: | 3.3 |
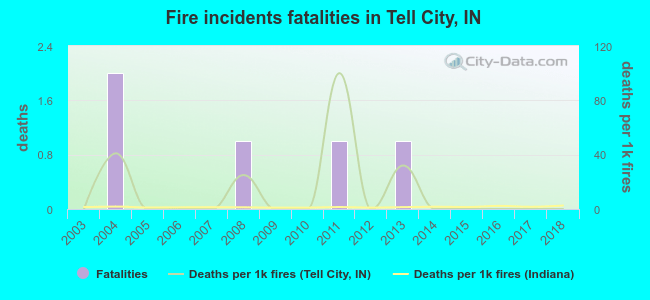 According to the reports from the years 2003 - 2018 the average number of fire-related fatalities per year is 0. The highest number of reported deaths - 2 took place in 2004, and the lowest - 0 in 2003. The data has a constant trend.
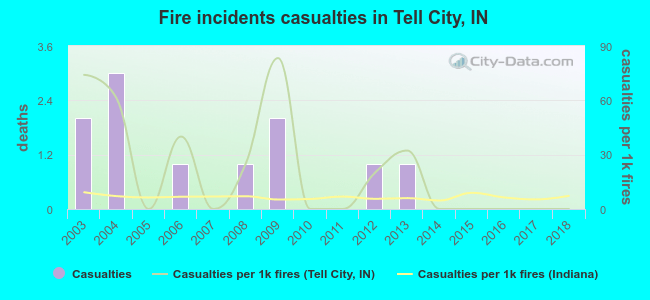 According to the reports from the years 2003 - 2018 the average number of fire-related yearly casualties is 1. The highest number of casualties - 3 took place in 2004, and the lowest - 0 in 2005. The data has a decreasing trend.
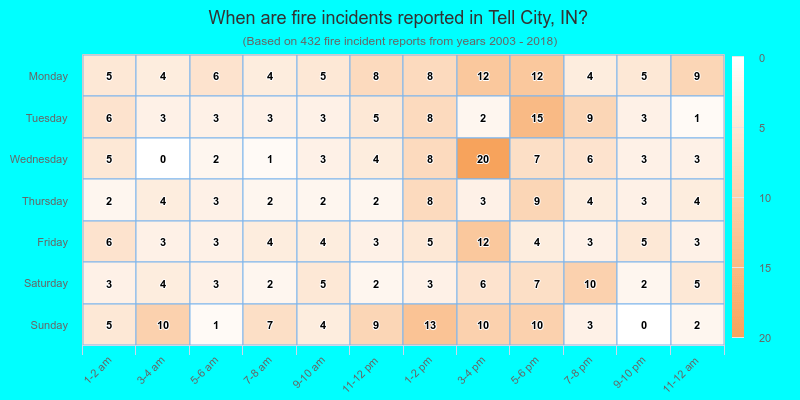
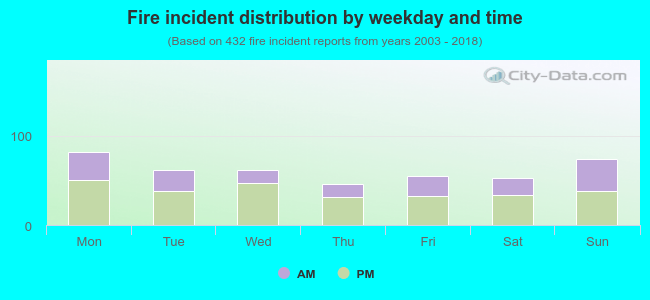 37.7% incidents where reported in the morning and 62.3% in the evening. The most fires (19.0%) took place on Monday, and the least (10.6%) on Thursday.
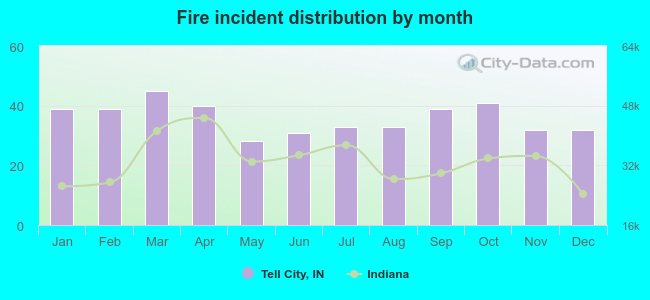 According to the 432 reports from years 2003 - 2018 most fires (10.4%) took place during March, and the least (6.5%) in May.
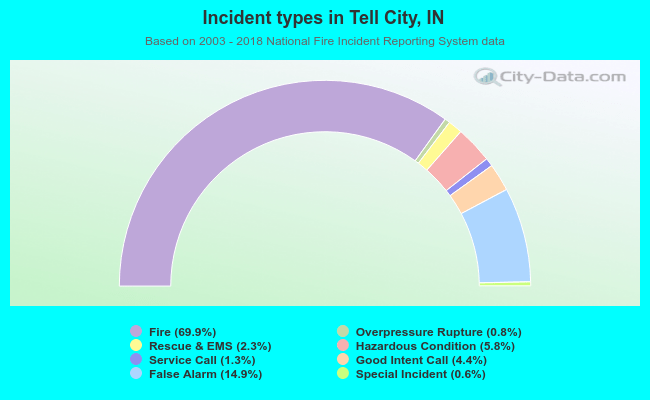 Out of all 618 cases reported during the years 2003 - 2018, the most belonged to the categories: Fire (69.9%), False Alarm (14.9%), and Hazardous Condition (5.8%).
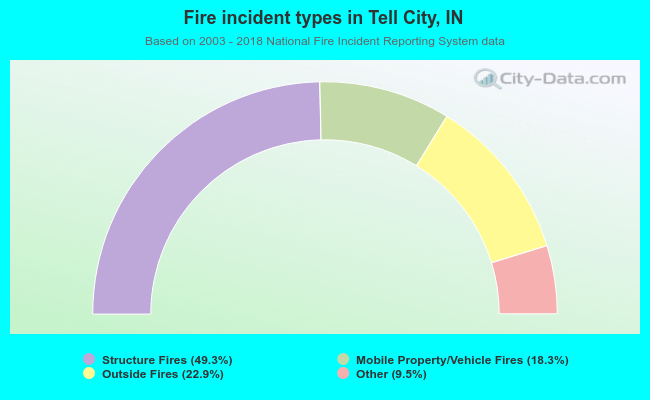 When looking into fire subcategories, the most reports belonged to: Structure Fires (49.3%), and Outside Fires (22.9%).