Swansea: Fire Incidents, Massachusetts (MA)
Where are fire incidents reported in Swansea, MA
Something went wrong! Please refresh the page.
| Fire incidents reported | |
|---|---|
| Sreet name | Count |
| GARDNERS NECK RD | 428 |
| SWANSEA MALL DR | 266 |
| G.A.R. HWY | 256 |
| INTERSTATE 195 HWY | 236 |
| GAR HWY | 122 |
| WILBUR AVE | 102 |
| OCEAN GROVE AVE | 62 |
| BARK ST | 58 |
| OLD FALL RIVER RD | 54 |
| STEVENS RD | 54 |
| LOCUST ST | 52 |
| MILFORD RD | 48 |
| HORTONVILLE RD | 46 |
| SHARPS LOT RD | 42 |
| WOOD ST | 42 |
| VINNICUM RD | 40 |
| JAMES REYNOLDS RD | 34 |
| BUSHEE RD | 32 |
| PEARSE RD | 32 |
| HAILES HILL RD | 30 |
| MARKET ST | 28 |
| WARREN AVE | 24 |
| OLD PROVIDENCE RD | 22 |
| SEAVIEW AVE | 22 |
| LAZYWOOD LANE | 20 |
| MOUNTFAIR CIR | 20 |
| SWANSOM RD | 20 |
| ELM ST | 18 |
| MACOMBER AVE | 18 |
| MAIN ST | 18 |
2002 - 2018 National Fire Incident Reporting System (NFIRS) incidents
- Incident types reported to NFIRS in Swansea, MA
- 1,57129.1%Fire
- 1,37925.6%Hazardous Condition
- 86616.1%False Alarm
- 61611.4%Rescue & EMS
- 5019.3%Service Call
- 4207.8%Good Intent Call
- 200.4%Overpressure Rupture
- 130.2%Severe Weather
- 60.1%Special Incident
- Fire incident types reported to NFIRS in Swansea, MA
- 69844.4%Structure Fires
- 59537.9%Outside Fires
- 25816.4%Mobile Property/Vehicle Fires
- 201.3%Other
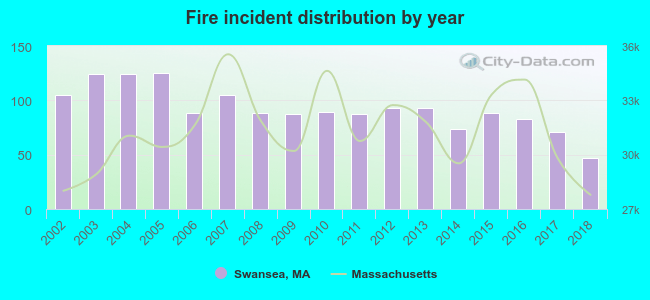 Based on the data from the years 2002 - 2018 the average number of fires per year is 92. The highest number of reported fires - 125 took place in 2005, and the least - 47 in 2018. The data has a dropping trend.
The average number of yearly fire incidents per 10k residents in Swansea, MA compared to nearest cities:
(Note: Based on data for the last 3 years, including only cities with population 5,000 and above)
| Swansea: | 42.2 |
| Somerset: | 22.0 |
| Fall River: | 48.8 |
| Rehoboth: | 33.9 |
| Dighton: | 12.7 |
| Seekonk: | 48.1 |
| Berkley: | 25.0 |
| Freetown: | 4.5 |
| Westport: | 41.0 |
 The median response time based on all reported fire incidents is 7 minutes. This is higher than the state median value.
The median response time in Swansea, MA compared to nearest cities:
(Note: Based on data for all years, including only cities with at least 500 fire incidents)
| Swansea: | 7 minutes |
| Somerset: | 6 minutes |
| Fall River: | 5 minutes |
| Rehoboth: | 6 minutes |
| Seekonk: | 6 minutes |
| Westport: | 5 minutes |
| Taunton: | 4 minutes |
| Attleboro: | 4 minutes |
| Lakeville: | 6 minutes |
 According to the data from the years 2002 - 2018 the average number of fire-related yearly casualties is 1. The highest number of reported casualties - 2 took place in 2004, and the lowest - 0 in 2007. The data has a declining trend.
The average number of casualties per 1,000 fires is 9. This indicator was the highest - 23 in 2009, and the lowest 0 in 2007. The trend for casualties per 1,000 fire incidents is decreasing. Compared to the state value the number of injuries per 1,000 incidents is about the same.
According to the data from the years 2002 - 2018 the average number of fire-related yearly casualties is 1. The highest number of reported casualties - 2 took place in 2004, and the lowest - 0 in 2007. The data has a declining trend.
The average number of casualties per 1,000 fires is 9. This indicator was the highest - 23 in 2009, and the lowest 0 in 2007. The trend for casualties per 1,000 fire incidents is decreasing. Compared to the state value the number of injuries per 1,000 incidents is about the same.
 30.7% incidents where reported in the morning and 69.3% in the evening. The most fires (15.7%) took place on Saturday, and the least (13.0%) on Tuesday.
 According to the 1,571 incident reports from years 2002 - 2018 most fires (13.6%) took place during April, and the least (5.7%) in November.
 Out of all 5,392 cases reported during the years 2002 - 2018, the most belonged to the categories: Fire (29.1%), Hazardous Condition (25.6%), and False Alarm (16.1%).
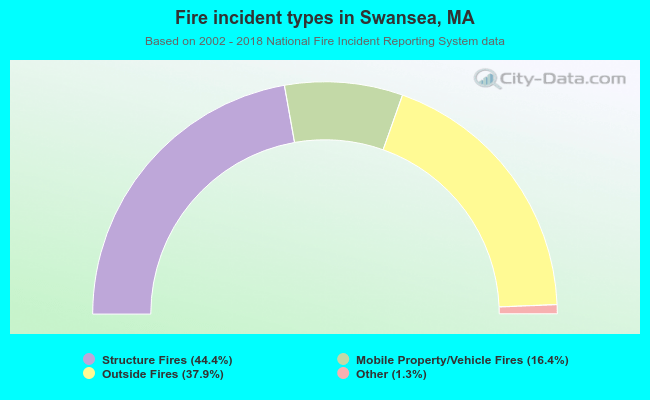 When looking into fire subcategories, the most incidents belonged to: Structure Fires (44.4%), and Outside Fires (37.9%).