Spokane Valley: Fire Incidents, Washington (WA)
Where are fire incidents reported in Spokane Valley, WA
Something went wrong! Please refresh the page.
| Fire incidents reported | |
|---|---|
| Sreet name | Count |
| SPRAGUE | 80 |
| BROADWAY | 70 |
| BROADWAY AVE | 70 |
| PINES | 66 |
| MISSION | 60 |
| TRENT AVE | 58 |
| MISSION AVE | 56 |
| 4TH | 50 |
| 8TH | 50 |
| MANSFIELD | 50 |
| SULLIVAN | 50 |
| SULLIVAN RD | 50 |
| 4TH AVE | 46 |
| 3RD AVE | 44 |
| I90 EAST | 42 |
| PINES RD | 42 |
| TRENT | 38 |
| UNIVERSITY | 34 |
| 6TH AVE | 32 |
| UNIVERSITY RD | 32 |
| WELLESLEY AVE | 32 |
| 8TH AVE | 30 |
| INDIANA AVE | 30 |
| MANSFIELD AVE | 30 |
| ARGONNE RD | 28 |
| EUCLID | 28 |
| EUCLID AVE | 28 |
| I90 WEST | 28 |
| 6TH | 26 |
| 32ND AVE | 24 |
| Other | 751 |
2005 - 2018 National Fire Incident Reporting System (NFIRS) incidents
- Incident types reported to NFIRS in Spokane Valley, WA
- 28,13864.1%Rescue & EMS
- 6,97515.9%Good Intent Call
- 3,6428.3%Service Call
- 2,0554.7%Fire
- 1,7344.0%False Alarm
- 1,2312.8%Hazardous Condition
- 650.1%Overpressure Rupture
- 500.1%Special Incident
- Fire incident types reported to NFIRS in Spokane Valley, WA
- 98748.0%Outside Fires
- 65331.8%Structure Fires
- 26612.9%Mobile Property/Vehicle Fires
- 1497.3%Other
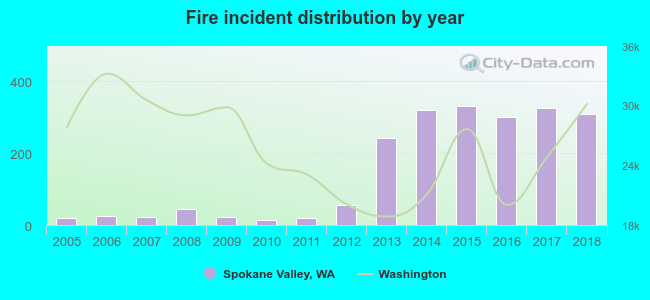 According to the data from the years 2005 - 2018 the average number of fires per year is 147. The highest number of reported fires - 332 took place in 2015, and the least - 15 in 2010. The data has a rising trend.
The average number of yearly fire incidents per 10k residents in Spokane Valley, WA compared to nearest cities:
(Note: Based on data for the last 3 years, including only cities with population 5,000 and above)
| Spokane Valley: | 34.0 |
| Veradale: | 2.0 |
| Liberty Lake: | 22.4 |
| Spokane: | 48.3 |
| Mead: | 13.3 |
| Colbert: | 10.8 |
| Airway Heights: | 76.4 |
| Cheney: | 72.1 |
| Loon Lake: | 15.7 |
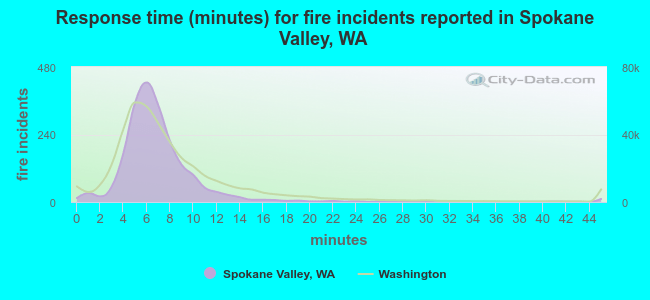 The median response time based on all reported fire incidents is 6 minutes. This is close to the state median value.
The median response time in Spokane Valley, WA compared to nearest cities:
(Note: Based on data for all years, including only cities with at least 500 fire incidents)
| Spokane Valley: | 6 minutes |
| Spokane: | 6 minutes |
| Post Falls: | 7 minutes |
| Airway Heights: | 6 minutes |
| Rathdrum: | 10 minutes |
| Cheney: | 6 minutes |
| Coeur d'Alene: | 6 minutes |
| Hayden: | 9 minutes |
| Medical Lake: | 12 minutes |
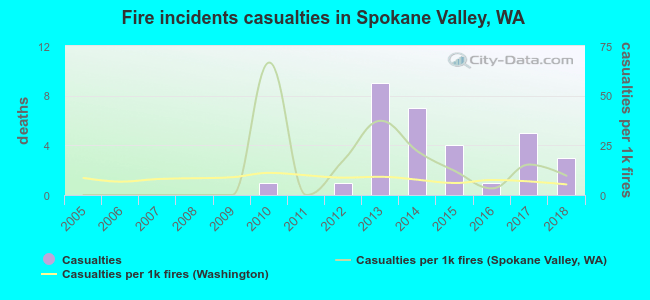 Based on the data from the years 2005 - 2018 the average number of fire-related casualties per year is 2. The highest number of reported casualties - 9 took place in 2013, and the lowest - 0 in 2005. The data has a growing trend.
The average number of casualties per 1,000 fire incidents is 13. This indicator was the highest - 67 in 2010, and the lowest 0 in 2005. The trend for injuries per 1,000 fire incidents is growing. Compared to the state value the number of injuries per 1,000 fire incidents is higher.
Based on the data from the years 2005 - 2018 the average number of fire-related casualties per year is 2. The highest number of reported casualties - 9 took place in 2013, and the lowest - 0 in 2005. The data has a growing trend.
The average number of casualties per 1,000 fire incidents is 13. This indicator was the highest - 67 in 2010, and the lowest 0 in 2005. The trend for injuries per 1,000 fire incidents is growing. Compared to the state value the number of injuries per 1,000 fire incidents is higher.Casualties per 1,000 incidents in Spokane Valley, WA compared to nearest cities:
(Note: Based on data for all years, including only cities with at least 500 fire incidents)
| Spokane Valley: | 15.1 |
| Spokane: | 12.9 |
| Post Falls: | 18.9 |
| Airway Heights: | 7.7 |
| Rathdrum: | 3.4 |
| Cheney: | 10.0 |
| Coeur d'Alene: | 8.6 |
| Hayden: | 3.2 |
| Medical Lake: | 2.5 |
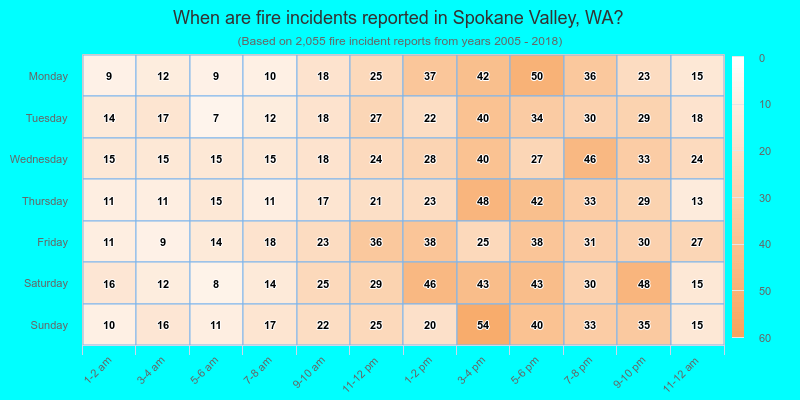
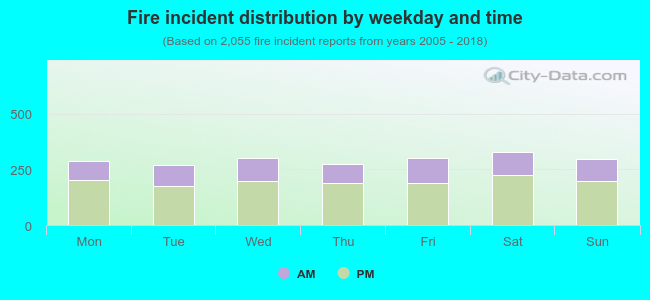 33.2% incidents where reported in the morning and 66.8% in the evening. The most fires (16.0%) took place on Saturday, and the least (13.0%) on Tuesday.
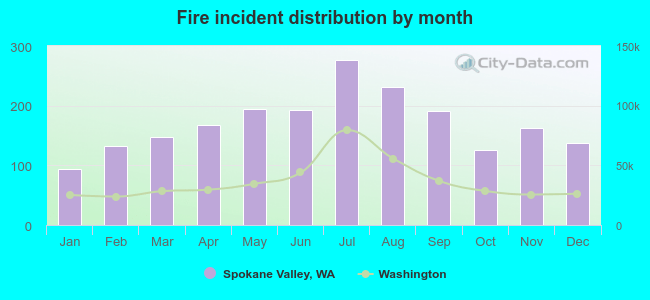 Based on the 2,055 incident reports from years 2005 - 2018 most fires (13.4%) took place during July, and the least (4.6%) in January.
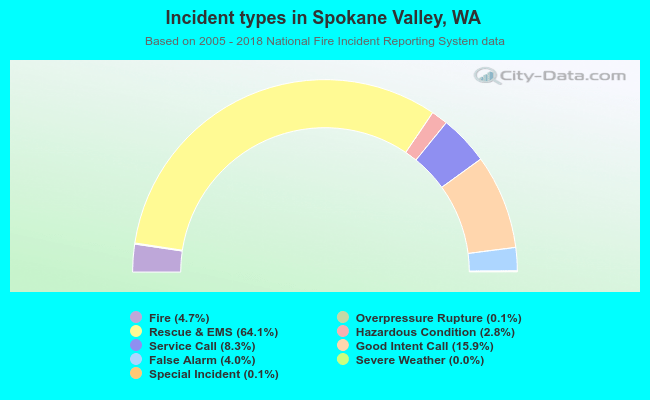 Out of all 43,895 cases reported during the years 2005 - 2018, the most belonged to the categories: Rescue & EMS (64.1%), Good Intent Call (15.9%), and Service Call (8.3%).
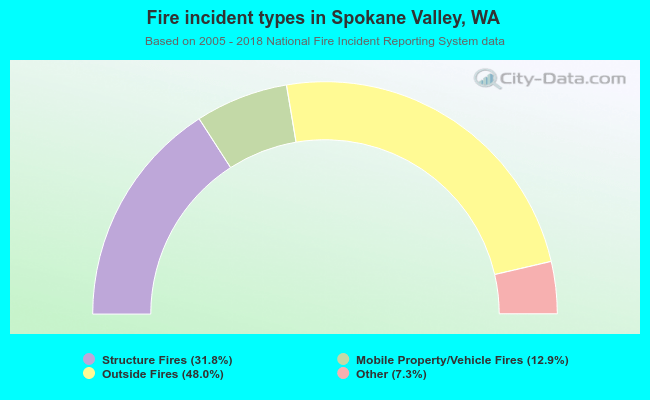 When looking into fire subcategories, the most incidents belonged to: Outside Fires (48.0%), and Structure Fires (31.8%).