Sparks: Fire Incidents, Nevada (NV)
Where are fire incidents reported in Sparks, NV
Something went wrong! Please refresh the page.
| Fire incidents reported | |
|---|---|
| Sreet name | Count |
| VICTORIAN AVE | 238 |
| PYRAMID WAY | 204 |
| SULLIVAN LN | 204 |
| EL RANCHO DR | 200 |
| PRATER WAY | 148 |
| GREENBRAE DR | 130 |
| MOORPARK CT | 128 |
| GREG ST | 120 |
| MCCARRAN BLVD | 112 |
| INTERSTATE 80 EASTBOUND HWY | 110 |
| ROCK BLVD | 108 |
| 15TH ST | 104 |
| INTERSTATE 80 WESTBOUND HWY | 98 |
| C ST | 94 |
| PRATER WY | 94 |
| CANAL RD | 92 |
| SPARKS BLVD | 92 |
| GLENDALE AVE | 90 |
| VISTA BLVD | 86 |
| I ST | 78 |
| ODDIE BLVD | 72 |
| PERI RANCH RD | 72 |
| WEDEKIND RD | 70 |
| EAGLE CANYON DR | 64 |
| NUGGET AVE | 64 |
| BARING BLVD | 62 |
| CANYON WAY | 60 |
| SPICE ISLANDS DR | 60 |
| 18TH ST | 58 |
| MERCHANT ST | 56 |
| Other | 1,848 |
2003 - 2018 National Fire Incident Reporting System (NFIRS) incidents
- Incident types reported to NFIRS in Sparks, NV
- 44,74865.3%Rescue & EMS
- 8,14711.9%Good Intent Call
- 5,1207.5%Hazardous Condition
- 5,0167.3%Fire
- 3,5025.1%Service Call
- 1,8892.8%False Alarm
- Fire incident types reported to NFIRS in Sparks, NV
- 2,17543.4%Outside Fires
- 1,70634.0%Structure Fires
- 91218.2%Mobile Property/Vehicle Fires
- 2234.4%Other
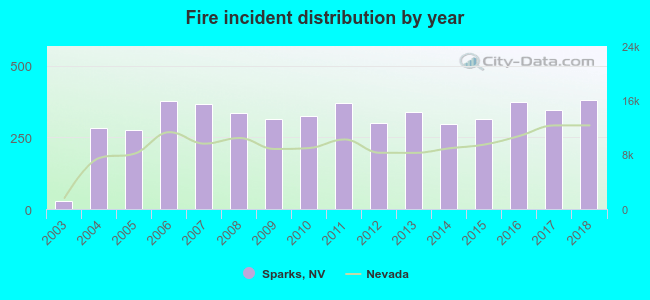 Based on the data from the years 2003 - 2018 the average number of fire incidents per year is 314. The highest number of fires - 379 took place in 2018, and the least - 28 in 2003. The data has a growing trend.
The average number of yearly fire incidents per 10k residents in Sparks, NV compared to nearest cities:
(Note: Based on data for the last 3 years, including only cities with population 5,000 and above)
| Sparks: | 38.7 |
| Sun Valley: | 16.9 |
| Reno: | 41.0 |
| Spanish Springs: | 2.4 |
| Lemmon Valley: | 2.0 |
| Cold Springs: | 5.9 |
| Washoe Valley: | 14.4 |
| Dayton: | 45.0 |
| Incline Village: | 20.3 |
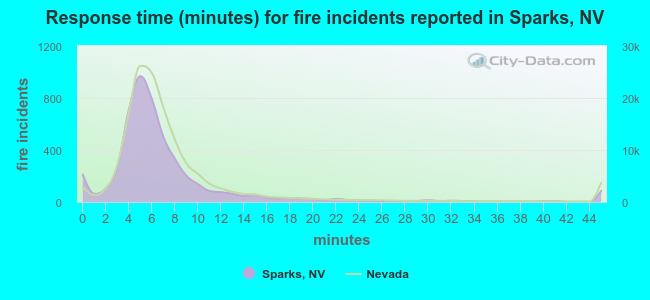 The median response time based on all reported fire incidents is 6 minutes. This is similar to the Nevada median value.
The median response time in Sparks, NV compared to nearest cities:
(Note: Based on data for all years, including only cities with at least 500 fire incidents)
| Sparks: | 6 minutes |
| Reno: | 7 minutes |
| Virginia City: | 8 minutes |
| Dayton: | 7 minutes |
| Carson City: | 6 minutes |
| Fernley: | 9 minutes |
| Gardnerville: | 9 minutes |
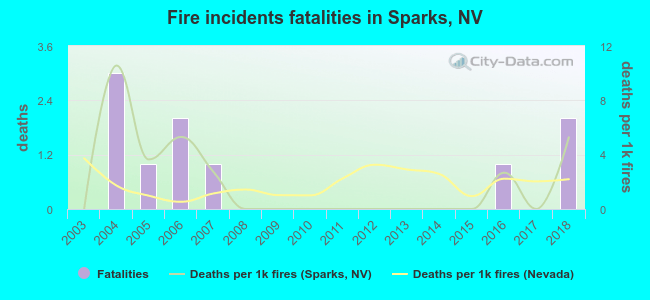 According to the reports from the years 2003 - 2018 the average number of fire-related fatalities per year is 1. The highest number of deaths - 3 took place in 2004, and the lowest - 0 in 2003. The data has a growing trend.
The average number of deaths per 1,000 fire incidents is 2. This indicator was the highest - 11 in 2004, and the lowest 0 in 2003. The trend for fatalities per 1,000 incidents is rising. Compared to the Nevada value the number of deaths per 1,000 fire incidents is similar.
According to the reports from the years 2003 - 2018 the average number of fire-related fatalities per year is 1. The highest number of deaths - 3 took place in 2004, and the lowest - 0 in 2003. The data has a growing trend.
The average number of deaths per 1,000 fire incidents is 2. This indicator was the highest - 11 in 2004, and the lowest 0 in 2003. The trend for fatalities per 1,000 incidents is rising. Compared to the Nevada value the number of deaths per 1,000 fire incidents is similar.Deaths per 1,000 incidents in Sparks, NV compared to nearest cities:
(Note: Based on data for all years, including only cities with at least 2,500 fire incidents)
| Sparks: | 2.0 |
| Reno: | 1.8 |
| Carson City: | 1.9 |
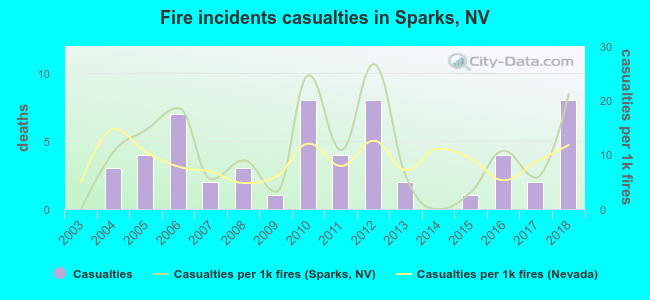 According to the data from the years 2003 - 2018 the average number of fire-related yearly casualties is 4. The highest number of reported casualties - 8 took place in 2010, and the lowest - 0 in 2003. The data has a growing trend.
The average number of injuries per 1,000 fires is 11. This indicator was the highest - 27 in 2012, and the lowest 0 in 2003. The trend for casualties per 1,000 fire incidents is increasing. Compared to the Nevada value the number of casualties per 1,000 fires is higher.
According to the data from the years 2003 - 2018 the average number of fire-related yearly casualties is 4. The highest number of reported casualties - 8 took place in 2010, and the lowest - 0 in 2003. The data has a growing trend.
The average number of injuries per 1,000 fires is 11. This indicator was the highest - 27 in 2012, and the lowest 0 in 2003. The trend for casualties per 1,000 fire incidents is increasing. Compared to the Nevada value the number of casualties per 1,000 fires is higher.Casualties per 1,000 incidents in Sparks, NV compared to nearest cities:
(Note: Based on data for all years, including only cities with at least 500 fire incidents)
| Sparks: | 11.4 |
| Reno: | 6.9 |
| Virginia City: | 0.0 |
| Dayton: | 10.4 |
| Carson City: | 14.7 |
| Fernley: | 3.6 |
| Gardnerville: | 0.0 |
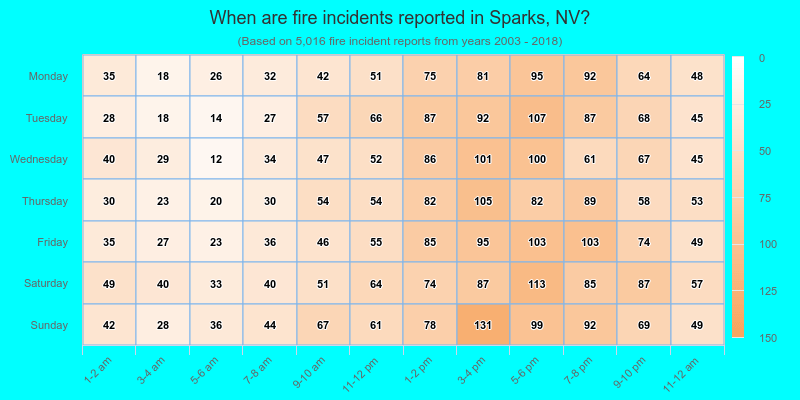
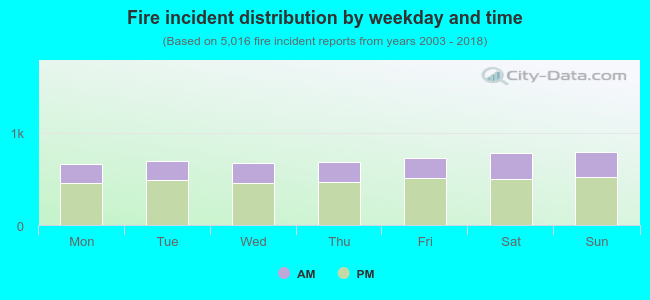 32.2% incidents where reported in the morning and 67.8% in the evening. The most fires (15.9%) took place on Sunday, and the least (13.1%) on Monday.
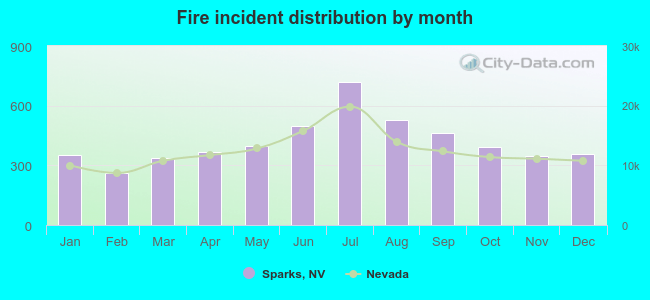 Based on the 5,016 fire incidents from years 2003 - 2018 most fires (14.3%) took place during July, and the least (5.2%) in February.
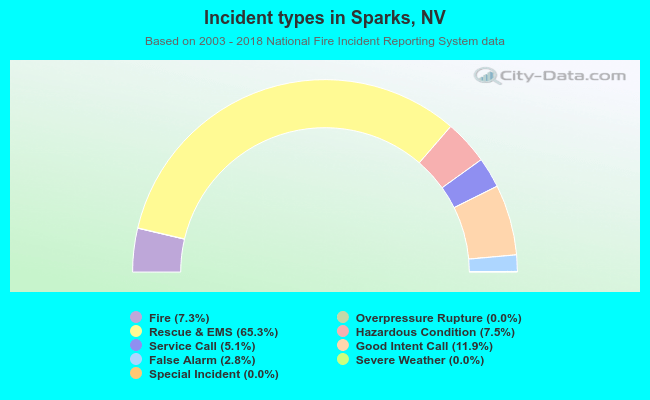 Out of all 68,486 cases reported during the years 2003 - 2018, the most belonged to the categories: Rescue & EMS (65.3%), Good Intent Call (11.9%), and Hazardous Condition (7.5%).
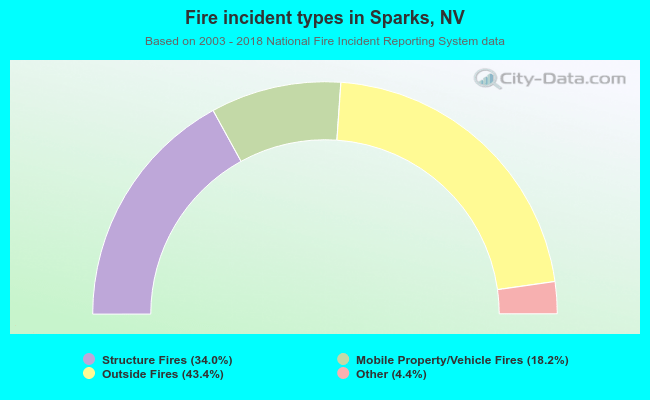 When looking into fire subcategories, the most reports belonged to: Outside Fires (43.4%), and Structure Fires (34.0%).