Sedro-Woolley: Fire Incidents, Washington (WA)
Where are fire incidents reported in Sedro-Woolley, WA
Something went wrong! Please refresh the page.
|
| |||||||||||||||||||||||||||||||||||||||||||||||||||||||||||||||||||||||||||||||||||||||||||||||||||||||||||||
| Other | 5 | |||||||||||||||||||||||||||||||||||||||||||||||||||||||||||||||||||||||||||||||||||||||||||||||||||||||||||||
2003 - 2011 National Fire Incident Reporting System (NFIRS) incidents
- Incident types reported to NFIRS in Sedro-Woolley, WA
- 46561.1%Fire
- 22729.8%Hazardous Condition
- 547.1%Service Call
- 111.4%Good Intent Call
- 40.5%Rescue & EMS
- Fire incident types reported to NFIRS in Sedro-Woolley, WA
- 18840.4%Structure Fires
- 14130.3%Outside Fires
- 7215.5%Mobile Property/Vehicle Fires
- 6413.8%Other
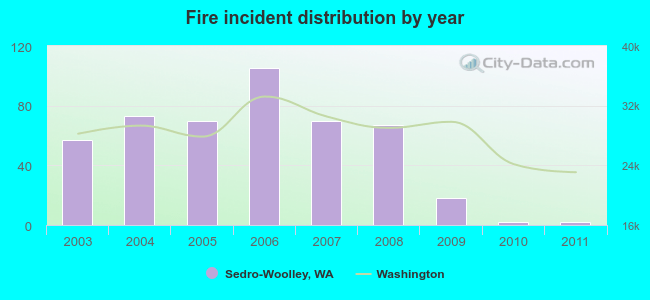 Based on the data from the years 2003 - 2011 the average number of fire incidents per year is 52. The highest number of fire incidents - 105 took place in 2006, and the least - 2 in 2010. The data has a dropping trend.
 31.0% incidents where reported in the morning and 69.0% in the evening. The most fires (16.6%) took place on Saturday, and the least (12.3%) on Tuesday.
 Based on the 465 fire incidents from years 2003 - 2011 most fires (17.2%) took place during July, and the least (6.2%) in September.
 Out of all 761 cases reported during the years 2003 - 2011, the most belonged to the categories: Fire (61.1%), Rescue & EMS (29.8%), and Hazardous Condition (7.1%).
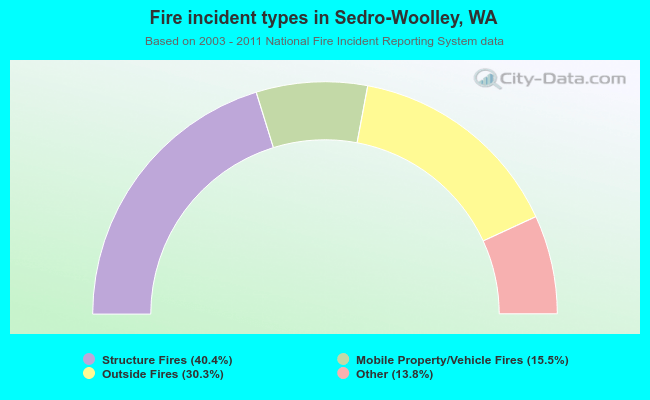 When looking into fire subcategories, the most incidents belonged to: Structure Fires (40.4%), and Outside Fires (30.3%).