Santa Fe: Fire Incidents, New Mexico (NM)
Where are fire incidents reported in Santa Fe, NM
Something went wrong! Please refresh the page.
| Fire incidents reported | |
|---|---|
| Sreet name | Count |
| CERRILLOS RD | 464 |
| AGUA FRIA ST | 122 |
| SAINT FRANCIS DR | 122 |
| SAINT MICHAELS DR | 110 |
| AIRPORT RD | 96 |
| ALAMEDA ST | 88 |
| GUADALUPE ST | 72 |
| MIGUEL CHAVEZ RD | 62 |
| RODEO RD | 62 |
| PACHECO ST | 58 |
| ZIA RD | 52 |
| JAGUAR DR | 48 |
| PASEO DE PERALTA | 48 |
| SAN FRANCISCO ST | 48 |
| ZAFARANO DR | 46 |
| ZEPOL RD | 46 |
| ALTO ST | 44 |
| SIRINGO RD | 44 |
| CALLE LORCA | 42 |
| RUFINA ST | 42 |
| CAMINO CARLOS REY | 38 |
| SAWMILL RD | 34 |
| ESPINACITAS ST | 32 |
| PALACE AVE | 32 |
| HOPEWELL ST | 30 |
| PASEO DEL SOL | 30 |
| SILER RD | 30 |
| GALISTEO ST | 28 |
| MEADOWS RD | 28 |
| NM HIGHWAY 14 | 28 |
| Other | 694 |
2002 - 2018 National Fire Incident Reporting System (NFIRS) incidents
- Incident types reported to NFIRS in Santa Fe, NM
- 45,45371.4%Rescue & EMS
- 5,6678.9%Good Intent Call
- 3,8756.1%Service Call
- 3,0894.9%Hazardous Condition
- 2,7794.4%False Alarm
- 2,7204.3%Fire
- Fire incident types reported to NFIRS in Santa Fe, NM
- 1,26946.7%Outside Fires
- 93434.3%Structure Fires
- 43416.0%Mobile Property/Vehicle Fires
- 833.1%Other
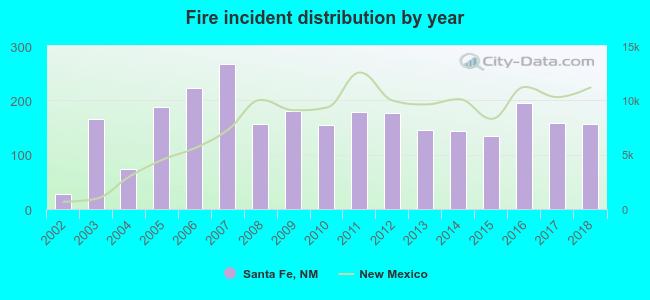 Based on the data from the years 2002 - 2018 the average number of fires per year is 160. The highest number of fires - 266 took place in 2007, and the least - 27 in 2002. The data has a growing trend.
The average number of yearly fire incidents per 10k residents in Santa Fe, NM compared to nearest cities:
(Note: Based on data for the last 3 years, including only cities with population 5,000 and above)
| Santa Fe: | 24.3 |
| Eldorado at Santa Fe: | 21.2 |
| White Rock: | 7.6 |
| Espanola: | 84.6 |
| Los Alamos: | 14.1 |
| San Juan Pueblo: | 1.5 |
 The median response time based on all reported fire incidents is 7 minutes. This is similar to the state median value.
The median response time in Santa Fe, NM compared to nearest cities:
(Note: Based on data for all years, including only cities with at least 500 fire incidents)
| Santa Fe: | 7 minutes |
| La Cienega: | 15 minutes |
| Chimayo: | 18 minutes |
| Espanola: | 5 minutes |
 Based on the data from the years 2002 - 2018 the average number of fire-related casualties per year is 0. The highest number of reported casualties - 2 took place in 2014, and the lowest - 0 in 2002. The data has a constant trend.
The average number of casualties per 1,000 fire incidents is 3. This indicator was the highest - 15 in 2015, and the lowest 0 in 2002. The trend for injuries per 1,000 fires is constant. Compared to the New Mexico value the number of casualties per 1,000 fires is about the same.
Based on the data from the years 2002 - 2018 the average number of fire-related casualties per year is 0. The highest number of reported casualties - 2 took place in 2014, and the lowest - 0 in 2002. The data has a constant trend.
The average number of casualties per 1,000 fire incidents is 3. This indicator was the highest - 15 in 2015, and the lowest 0 in 2002. The trend for injuries per 1,000 fires is constant. Compared to the New Mexico value the number of casualties per 1,000 fires is about the same.Casualties per 1,000 incidents in Santa Fe, NM compared to nearest cities:
(Note: Based on data for all years, including only cities with at least 500 fire incidents)
| Santa Fe: | 2.6 |
| La Cienega: | 0.0 |
| Chimayo: | 0.0 |
| Espanola: | 1.1 |
 30.1% incidents where reported in the morning and 69.9% in the evening. The most fires (15.3%) took place on Sunday, and the least (13.3%) on Friday.
 According to the 2,720 fire incident reports from years 2002 - 2018 most fires (12.1%) took place during June, and the least (6.3%) in October.
 Out of all 63,680 cases reported during the years 2002 - 2018, the most belonged to the categories: Rescue & EMS (71.4%), Good Intent Call (8.9%), and Service Call (6.1%).
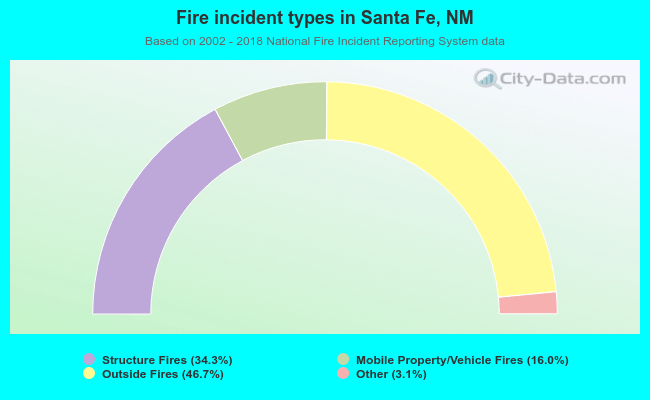 When looking into fire subcategories, the most incidents belonged to: Outside Fires (46.7%), and Structure Fires (34.3%).