Redmond: Fire Incidents, Washington (WA)
Where are fire incidents reported in Redmond, WA
Something went wrong! Please refresh the page.
| Fire incidents reported | |
|---|---|
| Sreet name | Count |
| REDMOND WAY | 106 |
| 148TH AVE NE | 102 |
| 152ND AVE | 92 |
| 148TH AVE | 72 |
| REDMOND WAY | 58 |
| W LAKE SAMMAMISH PKY NE | 58 |
| AVONDALE RD NE | 56 |
| 24TH ST | 52 |
| AVONDALE RD | 50 |
| NE 40TH ST | 50 |
| 152ND AVE NE | 46 |
| 161ST AVE NE | 46 |
| 166TH AVE NE | 44 |
| WILLOWS RD | 44 |
| 156TH AVE NE | 42 |
| NE 95TH ST | 42 |
| NE 24TH ST | 40 |
| WILLOWS RD NE | 40 |
| NE 76TH ST | 38 |
| NE 85TH ST | 38 |
| 164TH AVE NE | 34 |
| 76TH ST | 32 |
| 65TH ST | 28 |
| 95TH ST | 28 |
| NE 65TH ST | 28 |
| NE REDMOND-FALL CITY RD | 28 |
| 156TH AVE | 26 |
| 161ST AVE | 26 |
| 40TH ST | 26 |
| LEARY WAY NE | 26 |
| Other | 585 |
2002 - 2018 National Fire Incident Reporting System (NFIRS) incidents
- Incident types reported to NFIRS in Redmond, WA
- 19,06460.7%Rescue & EMS
- 4,01812.8%False Alarm
- 3,1259.9%Good Intent Call
- 1,9836.3%Fire
- 1,5585.0%Hazardous Condition
- 1,5054.8%Service Call
- 1110.4%Overpressure Rupture
- Fire incident types reported to NFIRS in Redmond, WA
- 91646.2%Structure Fires
- 67434.0%Outside Fires
- 24412.3%Mobile Property/Vehicle Fires
- 1497.5%Other
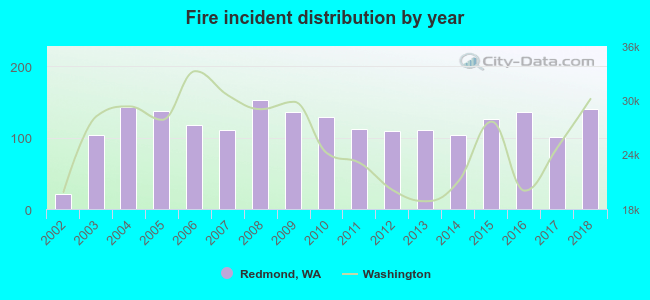 Based on the data from the years 2002 - 2018 the average number of fire incidents per year is 117. The highest number of fires - 152 took place in 2008, and the least - 21 in 2002. The data has a rising trend.
The average number of yearly fire incidents per 10k residents in Redmond, WA compared to nearest cities:
(Note: Based on data for the last 3 years, including only cities with population 5,000 and above)
| Redmond: | 21.2 |
| Kirkland: | 6.4 |
| Bellevue: | 26.4 |
| Sammamish: | 11.3 |
| Woodinville: | 16.1 |
| Bothell: | 32.5 |
| Kenmore: | 14.5 |
| Duvall: | 28.4 |
| Mercer Island: | 12.1 |
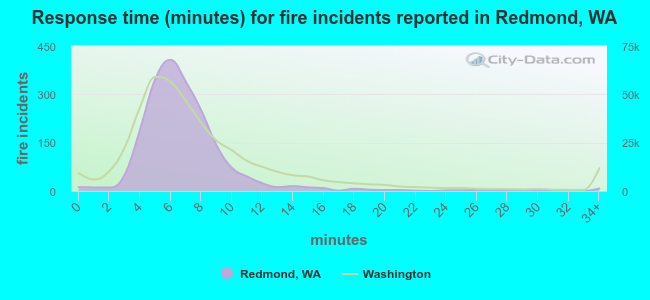 The median response time based on all reported fire incidents is 6 minutes. This is similar to the Washington median value.
The median response time in Redmond, WA compared to nearest cities:
(Note: Based on data for all years, including only cities with at least 500 fire incidents)
| Redmond: | 6 minutes |
| Kirkland: | 6 minutes |
| Bellevue: | 6 minutes |
| Sammamish: | 7 minutes |
| Woodinville: | 7 minutes |
| Bothell: | 6 minutes |
| Kenmore: | 6 minutes |
| Mercer Island: | 6 minutes |
| Issaquah: | 7 minutes |
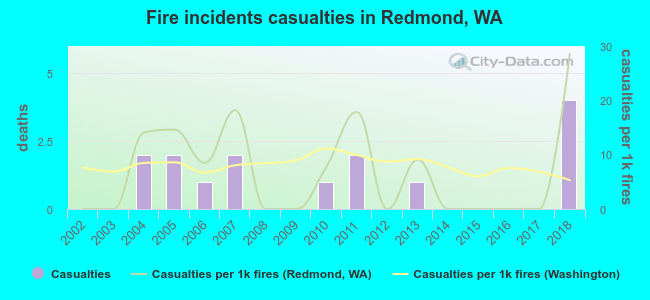 According to the reports from the years 2002 - 2018 the average number of fire-related yearly casualties is 1. The highest number of reported casualties - 4 took place in 2018, and the lowest - 0 in 2002. The data has an increasing trend.
The average number of casualties per 1,000 fire incidents is 7. This indicator was the highest - 29 in 2018, and the lowest 0 in 2002. The trend for injuries per 1,000 fire incidents is increasing. Compared to the Washington value the number of casualties per 1,000 incidents is about the same.
According to the reports from the years 2002 - 2018 the average number of fire-related yearly casualties is 1. The highest number of reported casualties - 4 took place in 2018, and the lowest - 0 in 2002. The data has an increasing trend.
The average number of casualties per 1,000 fire incidents is 7. This indicator was the highest - 29 in 2018, and the lowest 0 in 2002. The trend for injuries per 1,000 fire incidents is increasing. Compared to the Washington value the number of casualties per 1,000 incidents is about the same.Casualties per 1,000 incidents in Redmond, WA compared to nearest cities:
(Note: Based on data for all years, including only cities with at least 500 fire incidents)
| Redmond: | 7.6 |
| Kirkland: | 2.5 |
| Bellevue: | 11.9 |
| Sammamish: | 5.9 |
| Woodinville: | 3.3 |
| Bothell: | 10.0 |
| Kenmore: | 7.4 |
| Mercer Island: | 5.4 |
| Issaquah: | 3.7 |
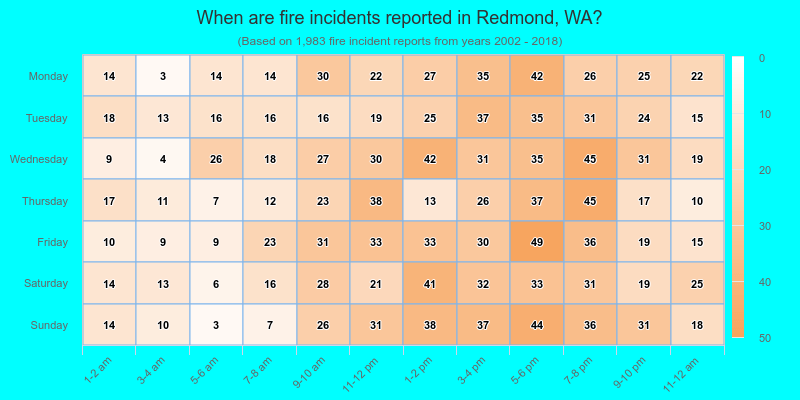
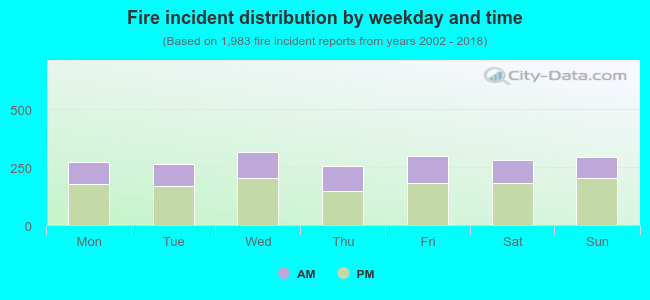 36.4% incidents where reported in the morning and 63.6% in the evening. The most fires (16.0%) took place on Wednesday, and the least (12.9%) on Thursday.
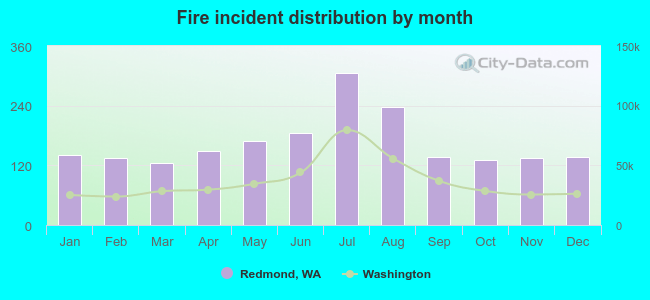 Based on the 1,983 fires from years 2002 - 2018 most fires (15.4%) took place during July, and the least (6.3%) in March.
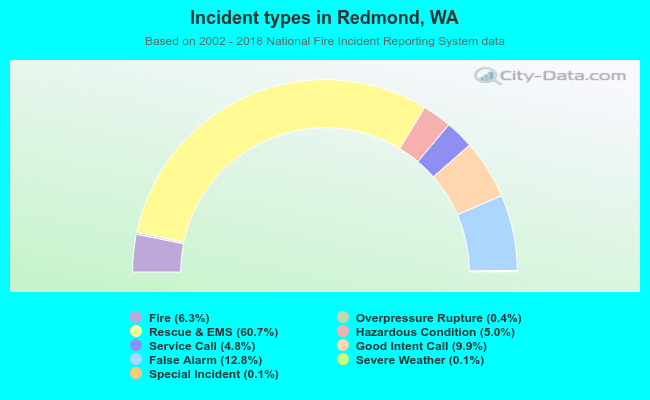 Out of all 31,423 cases reported during the years 2002 - 2018, the most belonged to the categories: Rescue & EMS (60.7%), False Alarm (12.8%), and Good Intent Call (9.9%).
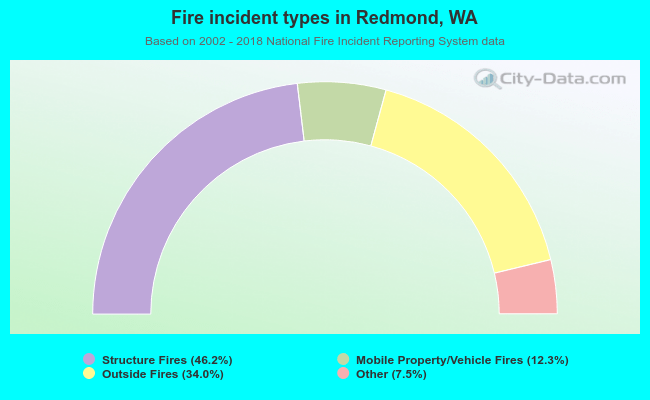 When looking into fire subcategories, the most incidents belonged to: Structure Fires (46.2%), and Outside Fires (34.0%).