Portland: Fire Incidents, Oregon (OR)
Where are fire incidents reported in Portland, OR
Something went wrong! Please refresh the page.
| Fire incidents reported | |
|---|---|
| Sreet name | Count |
| TH AVE | 1,170 |
| 82ND AVE | 1,080 |
| DIVISION ST | 906 |
| STARK ST | 732 |
| BURNSIDE ST | 700 |
| LOMBARD ST | 696 |
| POWELL BLVD | 654 |
| 2ND AVE | 614 |
| 122ND AVE | 608 |
| 6TH AVE | 524 |
| KILLINGSWORTH ST | 524 |
| GLISAN ST | 464 |
| 3RD AVE | 454 |
| SANDY BLVD | 446 |
| COLUMBIA BLVD | 400 |
| 92ND AVE | 372 |
| BROADWAY | 366 |
| 11TH AVE | 362 |
| HALSEY ST | 348 |
| 10TH AVE | 342 |
| FOSTER RD | 334 |
| 12TH AVE | 328 |
| 5TH AVE | 316 |
| MARINE DR | 308 |
| 13TH AVE | 306 |
| 1ST AVE | 306 |
| INTERSTATE AVE | 290 |
| MORRISON ST | 282 |
| BARNES RD | 270 |
| ALDER ST | 266 |
| Other | 17,800 |
2002 - 2018 National Fire Incident Reporting System (NFIRS) incidents
- Incident types reported to NFIRS in Portland, OR
- 32,56863.0%Fire
- 11,72522.7%Rescue & EMS
- 3,0015.8%Good Intent Call
- 1,7873.5%Hazardous Condition
- 1,4912.9%Service Call
- 1,0282.0%False Alarm
- Fire incident types reported to NFIRS in Portland, OR
- 15,49647.6%Outside Fires
- 10,96033.7%Structure Fires
- 5,31216.3%Mobile Property/Vehicle Fires
- 8002.5%Other
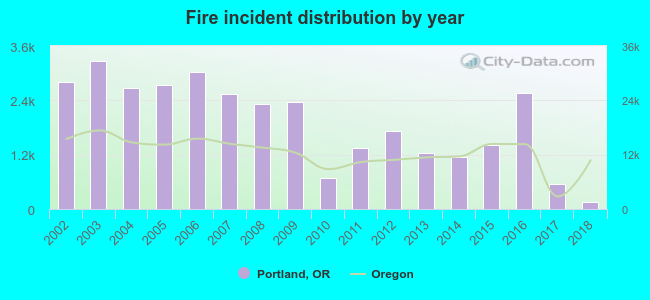 Based on the data from the years 2002 - 2018 the average number of fires per year is 1,916. The highest number of reported fire incidents - 3,258 took place in 2003, and the least - 151 in 2018. The data has a decreasing trend.
The average number of yearly fire incidents per 10k residents in Portland, OR compared to nearest cities:
(Note: Based on data for the last 3 years, including only cities with population 5,000 and above)
| Portland: | 17.5 |
| Milwaukie: | 31.5 |
| Oak Grove: | 1.6 |
| Happy Valley: | 20.6 |
| Lake Oswego: | 12.6 |
| Clackamas: | 79.2 |
| Beaverton: | 16.8 |
| Tigard: | 12.3 |
| Gladstone: | 27.8 |
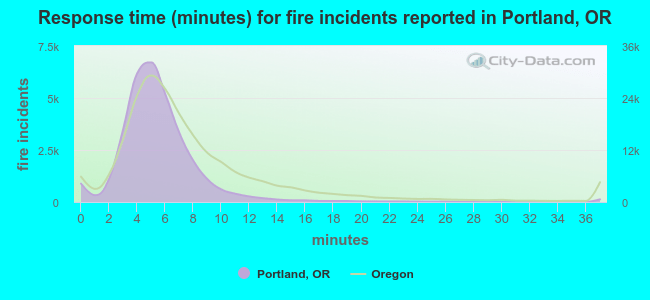 The median response time based on all reported fire incidents is 5 minutes. This is lower compared to the Oregon median value.
The median response time in Portland, OR compared to nearest cities:
(Note: Based on data for all years, including only cities with at least 500 fire incidents)
| Portland: | 5 minutes |
| Milwaukie: | 5 minutes |
| Happy Valley: | 5 minutes |
| Lake Oswego: | 6 minutes |
| Clackamas: | 6 minutes |
| Beaverton: | 6 minutes |
| Tigard: | 6 minutes |
| Gladstone: | 5 minutes |
| Gresham: | 5 minutes |
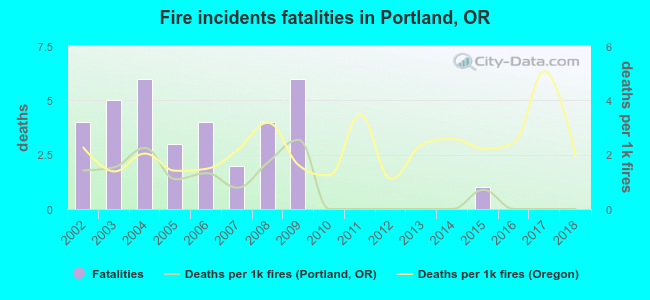 According to the data from the years 2002 - 2018 the average number of fire-related yearly deaths is 2. The highest number of deaths - 6 took place in 2004, and the lowest - 0 in 2010. The data has a dropping trend.
The average number of deaths per 1,000 fire incidents is 1. This indicator was the highest - 3 in 2009, and the lowest 0 in 2010. The trend for deaths per 1,000 fires is dropping. Compared to the Oregon value the number of deaths per 1,000 fires is lower.
According to the data from the years 2002 - 2018 the average number of fire-related yearly deaths is 2. The highest number of deaths - 6 took place in 2004, and the lowest - 0 in 2010. The data has a dropping trend.
The average number of deaths per 1,000 fire incidents is 1. This indicator was the highest - 3 in 2009, and the lowest 0 in 2010. The trend for deaths per 1,000 fires is dropping. Compared to the Oregon value the number of deaths per 1,000 fires is lower.
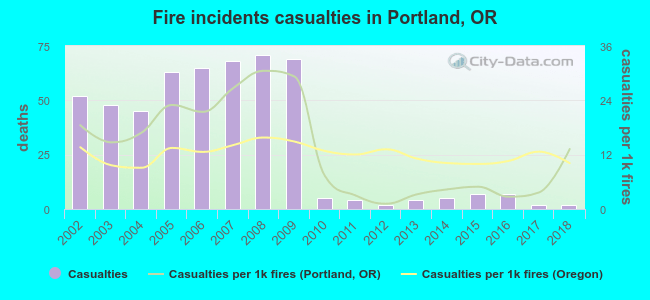 According to the data from the years 2002 - 2018 the average number of fire-related casualties per year is 31. The highest number of injuries - 71 took place in 2008, and the lowest - 2 in 2012. The data has a dropping trend.
The average number of injuries per 1,000 fire incidents is 13. This indicator was the highest - 31 in 2008, and the lowest 1 in 2012. The trend for injuries per 1,000 incidents is declining. Compared to the Oregon value the number of casualties per 1,000 fire incidents is higher.
According to the data from the years 2002 - 2018 the average number of fire-related casualties per year is 31. The highest number of injuries - 71 took place in 2008, and the lowest - 2 in 2012. The data has a dropping trend.
The average number of injuries per 1,000 fire incidents is 13. This indicator was the highest - 31 in 2008, and the lowest 1 in 2012. The trend for injuries per 1,000 incidents is declining. Compared to the Oregon value the number of casualties per 1,000 fire incidents is higher.Casualties per 1,000 incidents in Portland, OR compared to nearest cities:
(Note: Based on data for all years, including only cities with at least 500 fire incidents)
| Portland: | 15.9 |
| Milwaukie: | 24.0 |
| Happy Valley: | 7.5 |
| Lake Oswego: | 13.1 |
| Clackamas: | 14.0 |
| Beaverton: | 15.3 |
| Tigard: | 16.8 |
| Gladstone: | 5.0 |
| Gresham: | 11.5 |
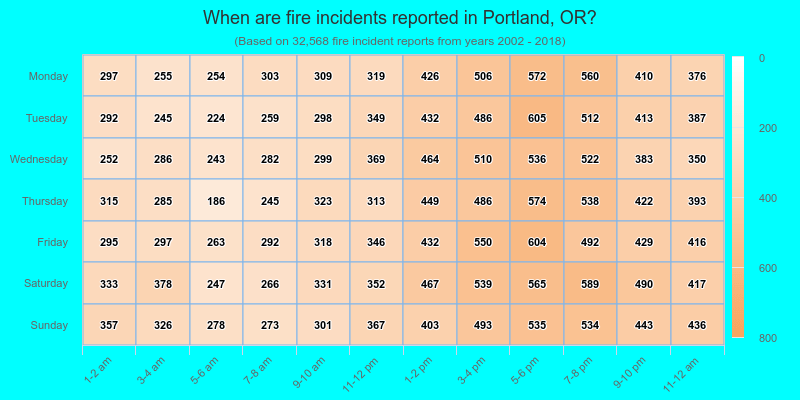
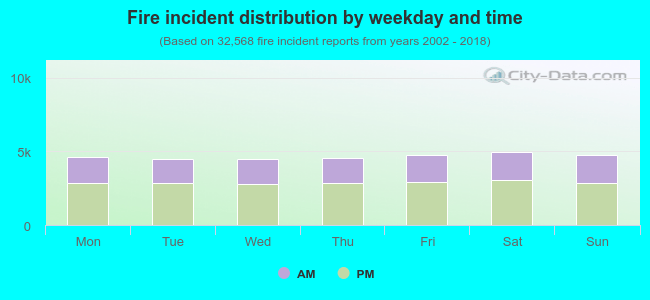 38.1% incidents where reported in the morning and 61.9% in the evening. The most fires (15.3%) took place on Saturday, and the least (13.8%) on Wednesday.
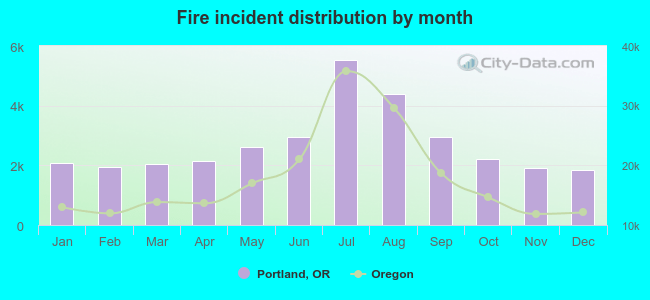 According to the 32,568 fire incident reports from years 2002 - 2018 most fires (17.0%) took place during July, and the least (5.7%) in December.
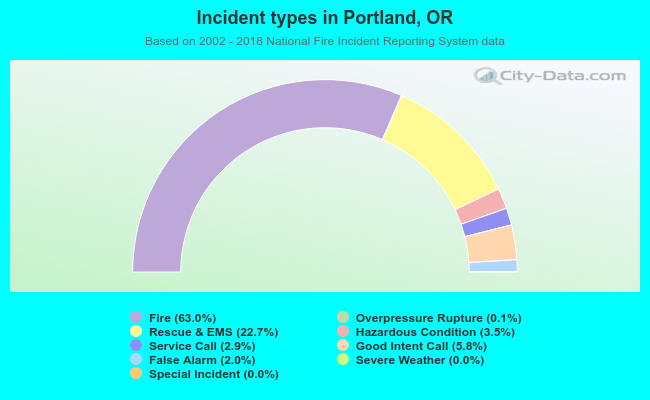 Out of all 51,655 cases reported during the years 2002 - 2018, the most belonged to the categories: Fire (63.0%), Rescue & EMS (22.7%), and Good Intent Call (5.8%).
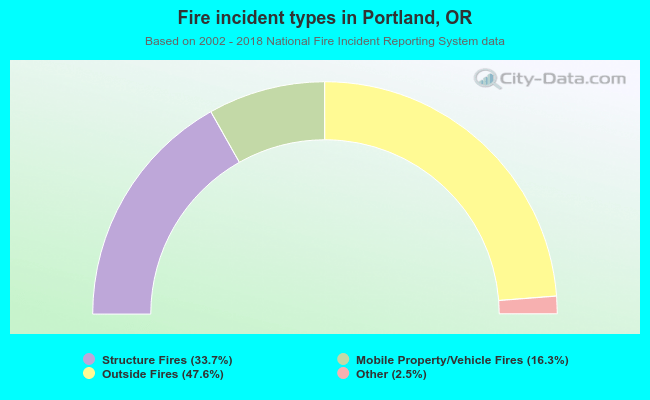 When looking into fire subcategories, the most reports belonged to: Outside Fires (47.6%), and Structure Fires (33.7%).