Orange: Fire Incidents, Texas (TX)
Where are fire incidents reported in Orange, TX
Something went wrong! Please refresh the page.
| Fire incidents reported | |
|---|---|
| Sreet name | Count |
| INTERSTATE 10 | 246 |
| 16 TH ST | 162 |
| 12 HWY | 104 |
| 62 HWY | 104 |
| PINE AVE | 104 |
| HIGHWAY 87 | 100 |
| FM 1130 HWY | 82 |
| ALLIE PAYNE | 78 |
| DUPONT DR | 76 |
| RIDGEMONT | 72 |
| 04 TH ST | 68 |
| LUTCHER DR | 60 |
| MEEKS DR | 60 |
| BOB HALL | 58 |
| 03 RD ST | 56 |
| BURTON | 52 |
| PARK AVE | 50 |
| CHERRY | 48 |
| HIGHWAY 62 | 48 |
| JOHN ST | 48 |
| FARRAGUT | 44 |
| LINSCOMB RD | 44 |
| OWENS ILLINOIS RD | 42 |
| 10 TH ST | 40 |
| 37 TH ST | 40 |
| 06 TH ST | 38 |
| CLAIRMONT DR | 38 |
| LUTCHER | 38 |
| 08 TH ST | 36 |
| SIKES RD | 36 |
| Other | 1,760 |
2002 - 2018 National Fire Incident Reporting System (NFIRS) incidents
- Incident types reported to NFIRS in Orange, TX
- 10,47649.6%Rescue & EMS
- 3,83218.1%Fire
- 2,42711.5%Hazardous Condition
- 1,5807.5%Good Intent Call
- 1,5667.4%Service Call
- 1,1635.5%False Alarm
- 320.2%Special Incident
- 280.1%Severe Weather
- Fire incident types reported to NFIRS in Orange, TX
- 1,85648.4%Outside Fires
- 1,19931.3%Structure Fires
- 58315.2%Mobile Property/Vehicle Fires
- 1945.1%Other
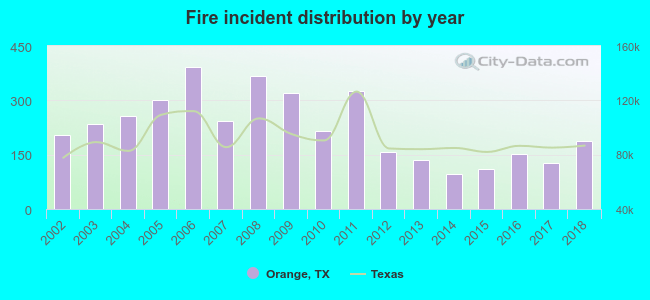 Based on the data from the years 2002 - 2018 the average number of fires per year is 225. The highest number of reported fire incidents - 392 took place in 2006, and the least - 97 in 2014. The data has a decreasing trend.
The average number of yearly fire incidents per 10k residents in Orange, TX compared to nearest cities:
(Note: Based on data for the last 3 years, including only cities with population 5,000 and above)
| Orange: | 82.5 |
| Bridge City: | 86.7 |
| Vidor: | 261.3 |
| Groves: | 63.1 |
| Port Neches: | 43.6 |
| Nederland: | 62.2 |
| Port Arthur: | 65.2 |
| Beaumont: | 45.4 |
| Lumberton: | 3.5 |
 The median response time based on all reported fire incidents is 5 minutes. This is lower compared to the Texas median value.
The median response time in Orange, TX compared to nearest cities:
(Note: Based on data for all years, including only cities with at least 500 fire incidents)
| Orange: | 5 minutes |
| Bridge City: | 8 minutes |
| Vinton: | 7 minutes |
| Vidor: | 7 minutes |
| Groves: | 4 minutes |
| Port Neches: | 5 minutes |
| Nederland: | 5 minutes |
| Port Arthur: | 4 minutes |
| Beaumont: | 4 minutes |
 Based on the reports from the years 2002 - 2018 the average number of fire-related fatalities per year is 1. The highest number of deaths - 2 took place in 2002, and the lowest - 0 in 2003. The data has a dropping trend.
The average number of deaths per 1,000 fires is 3. This indicator was the highest - 15 in 2013, and the lowest 0 in 2003. The trend for fatalities per 1,000 fire incidents is dropping. Compared to the Texas value the number of deaths per 1,000 fires is higher.
Based on the reports from the years 2002 - 2018 the average number of fire-related fatalities per year is 1. The highest number of deaths - 2 took place in 2002, and the lowest - 0 in 2003. The data has a dropping trend.
The average number of deaths per 1,000 fires is 3. This indicator was the highest - 15 in 2013, and the lowest 0 in 2003. The trend for fatalities per 1,000 fire incidents is dropping. Compared to the Texas value the number of deaths per 1,000 fires is higher.Deaths per 1,000 incidents in Orange, TX compared to nearest cities:
(Note: Based on data for all years, including only cities with at least 2,500 fire incidents)
| Orange: | 2.6 |
| Vidor: | 2.6 |
| Port Arthur: | 1.5 |
| Beaumont: | 3.0 |
| Jasper: | 4.1 |
 According to the reports from the years 2002 - 2018 the average number of fire-related yearly casualties is 2. The highest number of casualties - 5 took place in 2004, and the lowest - 0 in 2006. The data has a decreasing trend.
The average number of casualties per 1,000 fire incidents is 6. This indicator was the highest - 20 in 2004, and the lowest 0 in 2006. The trend for casualties per 1,000 fires is declining. Compared to the Texas value the number of casualties per 1,000 fire incidents is about the same.
According to the reports from the years 2002 - 2018 the average number of fire-related yearly casualties is 2. The highest number of casualties - 5 took place in 2004, and the lowest - 0 in 2006. The data has a decreasing trend.
The average number of casualties per 1,000 fire incidents is 6. This indicator was the highest - 20 in 2004, and the lowest 0 in 2006. The trend for casualties per 1,000 fires is declining. Compared to the Texas value the number of casualties per 1,000 fire incidents is about the same.Casualties per 1,000 incidents in Orange, TX compared to nearest cities:
(Note: Based on data for all years, including only cities with at least 500 fire incidents)
| Orange: | 6.8 |
| Bridge City: | 0.6 |
| Vinton: | 3.9 |
| Vidor: | 4.2 |
| Groves: | 8.5 |
| Port Neches: | 10.4 |
| Nederland: | 11.5 |
| Port Arthur: | 5.5 |
| Beaumont: | 22.3 |
 30.0% incidents where reported in the morning and 70.0% in the evening. The most fires (16.1%) took place on Saturday, and the least (12.3%) on Tuesday.
 Based on the 3,832 fire incident reports from years 2002 - 2018 most fires (10.3%) took place during January, and the least (6.7%) in February.
 Out of all 21,125 cases reported during the years 2002 - 2018, the most belonged to the categories: Rescue & EMS (49.6%), Fire (18.1%), and Hazardous Condition (11.5%).
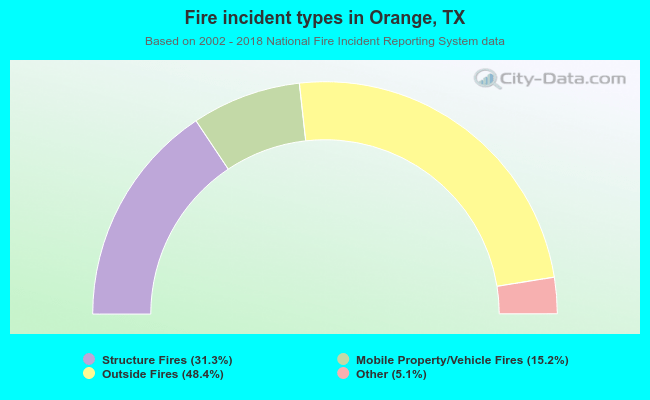 When looking into fire subcategories, the most incidents belonged to: Outside Fires (48.4%), and Structure Fires (31.3%).