New Rochelle: Fire Incidents, New York (NY)
Where are fire incidents reported in New Rochelle, NY
Something went wrong! Please refresh the page.
| Fire incidents reported | |
|---|---|
| Sreet name | Count |
| NORTH AVE | 494 |
| PELHAM RD | 326 |
| MAIN ST | 238 |
| MEMORIAL HWY | 202 |
| HUGUENOT ST | 188 |
| UNION AVE | 186 |
| LINCOLN AVE | 174 |
| LOCKWOOD AVE | 170 |
| 5TH AVE | 160 |
| DAVENPORT AVE | 140 |
| SICKLES AVE | 140 |
| WEBSTER AVE | 130 |
| DRAKE AVE | 108 |
| CENTRE AVE | 102 |
| FRANKLIN AVE | 100 |
| LOCUST AVE | 80 |
| CLOVE RD | 76 |
| CHARLES ST | 72 |
| BON AIR AVE | 70 |
| HORTON AVE | 70 |
| WILMOT RD | 68 |
| EASTCHESTER RD | 66 |
| PINEBROOK BLVD | 64 |
| OLD BOSTON POST RD | 60 |
| PRYER TER | 60 |
| WEYMAN AVE | 60 |
| WINTHROP AVE | 60 |
| MAPLE AVE | 58 |
| QUAKER RIDGE RD | 56 |
| WEAVER ST | 56 |
| Other | 1,051 |
2006 - 2018 National Fire Incident Reporting System (NFIRS) incidents
- Incident types reported to NFIRS in New Rochelle, NY
- 19,26849.2%Rescue & EMS
- 5,41813.8%Hazardous Condition
- 4,88512.5%Fire
- 4,49611.5%False Alarm
- 3,2748.4%Service Call
- 1,7444.5%Good Intent Call
- Fire incident types reported to NFIRS in New Rochelle, NY
- 3,76977.2%Structure Fires
- 69414.2%Outside Fires
- 3036.2%Mobile Property/Vehicle Fires
- 1192.4%Other
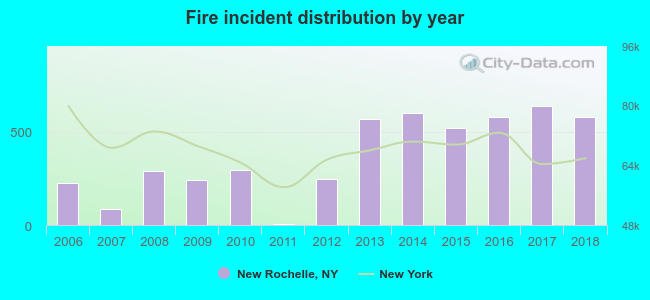 According to the data from the years 2006 - 2018 the average number of fire incidents per year is 375. The highest number of reported fire incidents - 640 took place in 2017, and the least - 5 in 2011. The data has a growing trend.
The average number of yearly fire incidents per 10k residents in New Rochelle, NY compared to nearest cities:
(Note: Based on data for the last 3 years, including only cities with population 5,000 and above)
| New Rochelle: | 75.2 |
| Larchmont: | 22.9 |
| Pelham: | 37.0 |
| Bronxville: | 42.1 |
| Eastchester: | 27.6 |
| Mount Vernon: | 37.5 |
| Tuckahoe: | 45.8 |
| Pelham Manor: | 26.9 |
| Yonkers: | 65.3 |
 The median response time based on all reported fire incidents is 6 minutes. This is higher compared to the state median value.
The median response time in New Rochelle, NY compared to nearest cities:
(Note: Based on data for all years, including only cities with at least 500 fire incidents)
| New Rochelle: | 6 minutes |
| Larchmont: | 2 minutes |
| Eastchester: | 5 minutes |
| Mount Vernon: | 4 minutes |
| Yonkers: | 5 minutes |
| Scarsdale: | 4 minutes |
| Rye: | 4 minutes |
| White Plains: | 4 minutes |
| Hartsdale: | 4 minutes |
 According to the data from the years 2006 - 2018 the average number of fire-related fatalities per year is 0. The highest number of deaths - 2 took place in 2008, and the lowest - 0 in 2006. The data has an increasing trend.
The average number of deaths per 1,000 fires is 1. This indicator was the highest - 7 in 2008, and the lowest 0 in 2006. The trend for fatalities per 1,000 fires is increasing. Compared to the state value the number of deaths per 1,000 fires is similar.
According to the data from the years 2006 - 2018 the average number of fire-related fatalities per year is 0. The highest number of deaths - 2 took place in 2008, and the lowest - 0 in 2006. The data has an increasing trend.
The average number of deaths per 1,000 fires is 1. This indicator was the highest - 7 in 2008, and the lowest 0 in 2006. The trend for fatalities per 1,000 fires is increasing. Compared to the state value the number of deaths per 1,000 fires is similar.Deaths per 1,000 incidents in New Rochelle, NY compared to nearest cities:
(Note: Based on data for all years, including only cities with at least 2,500 fire incidents)
| New Rochelle: | 1.0 |
| Mount Vernon: | 2.8 |
| Yonkers: | 0.3 |
| White Plains: | 0.0 |
| Englewood: | 1.1 |
 According to the data from the years 2006 - 2018 the average number of fire-related casualties per year is 1. The highest number of casualties - 5 took place in 2018, and the lowest - 0 in 2006. The data has an increasing trend.
The average number of injuries per 1,000 fire incidents is 2. This indicator was the highest - 9 in 2018, and the lowest 0 in 2006. The trend for injuries per 1,000 incidents is increasing. Compared to the state value the number of casualties per 1,000 incidents is much lower.
According to the data from the years 2006 - 2018 the average number of fire-related casualties per year is 1. The highest number of casualties - 5 took place in 2018, and the lowest - 0 in 2006. The data has an increasing trend.
The average number of injuries per 1,000 fire incidents is 2. This indicator was the highest - 9 in 2018, and the lowest 0 in 2006. The trend for injuries per 1,000 incidents is increasing. Compared to the state value the number of casualties per 1,000 incidents is much lower.Casualties per 1,000 incidents in New Rochelle, NY compared to nearest cities:
(Note: Based on data for all years, including only cities with at least 500 fire incidents)
| New Rochelle: | 2.0 |
| Larchmont: | 8.9 |
| Eastchester: | 11.6 |
| Mount Vernon: | 9.7 |
| Yonkers: | 6.4 |
| Scarsdale: | 5.5 |
| Rye: | 2.9 |
| White Plains: | 7.2 |
| Hartsdale: | 15.9 |
 27.7% incidents where reported in the morning and 72.3% in the evening. The most fires (15.8%) took place on Sunday, and the least (13.2%) on Monday.
 According to the 4,885 fires from years 2006 - 2018 most fires (9.3%) took place during April, and the least (7.3%) in July.
 Out of all 39,147 cases reported during the years 2006 - 2018, the most belonged to the categories: Rescue & EMS (49.2%), Hazardous Condition (13.8%), and Fire (12.5%).
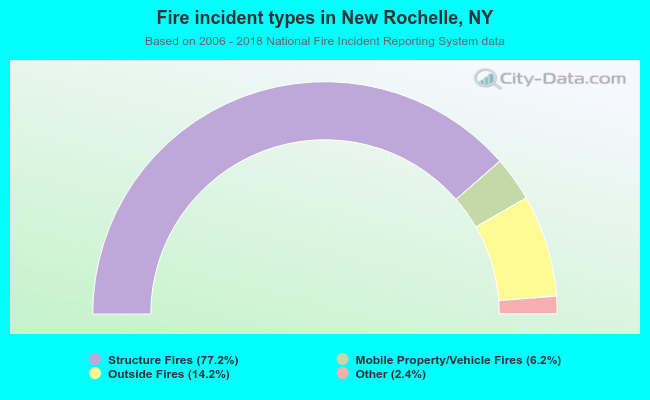 When looking into fire subcategories, the most incidents belonged to: Structure Fires (77.2%), and Outside Fires (14.2%).