Monmouth: Fire Incidents, Oregon (OR)
Where are fire incidents reported in Monmouth, OR
Something went wrong! Please refresh the page.
|
| |||||||||||||||||||||||||||||||||||||||||||||||||||||||||||||||||||||||||||||||||||||||||||||||||||||||||||||
2002 - 2018 National Fire Incident Reporting System (NFIRS) incidents
- Incident types reported to NFIRS in Monmouth, OR
- 2,26769.3%Rescue & EMS
- 2928.9%Fire
- 2688.2%Service Call
- 2086.4%Good Intent Call
- 1755.3%Hazardous Condition
- 601.8%False Alarm
- Fire incident types reported to NFIRS in Monmouth, OR
- 13044.5%Outside Fires
- 10937.3%Structure Fires
- 4716.1%Mobile Property/Vehicle Fires
- 62.1%Other
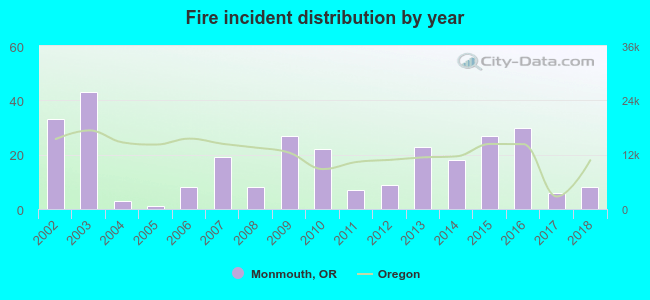 Based on the data from the years 2002 - 2018 the average number of fire incidents per year is 17. The highest number of fires - 43 took place in 2003, and the least - 1 in 2005. The data has a declining trend.
The average number of yearly fire incidents per 10k residents in Monmouth, OR compared to nearest cities:
(Note: Based on data for the last 3 years, including only cities with population 5,000 and above)
| Monmouth: | 14.7 |
| Independence: | 14.4 |
| Dallas: | 26.9 |
| Salem: | 25.0 |
| Four Corners: | 1.9 |
| Keizer: | 8.4 |
| Albany: | 12.8 |
| Sheridan: | 39.0 |
| Corvallis: | 10.1 |

 30.8% incidents where reported in the morning and 69.2% in the evening. The most fires (17.5%) took place on Saturday, and the least (11.6%) on Sunday.
 According to the 292 fire incidents from years 2002 - 2018 most fires (18.2%) took place during July, and the least (4.5%) in November.
 Out of all 3,272 cases reported during the years 2002 - 2018, the most belonged to the categories: Rescue & EMS (69.3%), Fire (8.9%), and Service Call (8.2%).
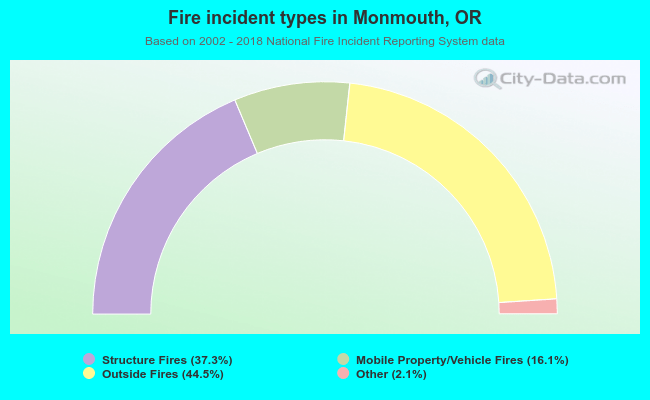 When looking into fire subcategories, the most reports belonged to: Outside Fires (44.5%), and Structure Fires (37.3%).