Miller Place: Fire Incidents, New York (NY)
Where are fire incidents reported in Miller Place, NY
Something went wrong! Please refresh the page.
|
| |||||||||||||||||||||||||||||||||||||||||||||||||||||||||||||||||||||||||||||||||||||||||||||||||||||||||||||
| Other | 48 | |||||||||||||||||||||||||||||||||||||||||||||||||||||||||||||||||||||||||||||||||||||||||||||||||||||||||||||
2003 - 2018 National Fire Incident Reporting System (NFIRS) incidents
- Incident types reported to NFIRS in Miller Place, NY
- 2,53551.5%Rescue & EMS
- 70614.3%Fire
- 69014.0%False Alarm
- 59112.0%Hazardous Condition
- 2555.2%Good Intent Call
- 1362.8%Service Call
- Fire incident types reported to NFIRS in Miller Place, NY
- 27739.2%Other
- 26537.5%Structure Fires
- 13118.6%Outside Fires
- 334.7%Mobile Property/Vehicle Fires
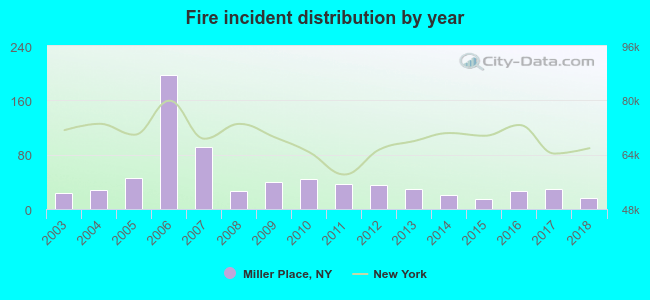 According to the data from the years 2003 - 2018 the average number of fire incidents per year is 44. The highest number of reported fire incidents - 197 took place in 2006, and the least - 15 in 2015. The data has a declining trend.
The average number of yearly fire incidents per 10k residents in Miller Place, NY compared to nearest cities:
(Note: Based on data for the last 3 years, including only cities with population 5,000 and above)
| Miller Place: | 19.5 |
| Sound Beach: | 28.0 |
| Mount Sinai: | 17.9 |
| Rocky Point: | 30.2 |
| Port Jefferson: | 22.5 |
| Coram: | 17.3 |
| Terryville: | 1.7 |
| Middle Island: | 38.8 |
| Selden: | 31.9 |
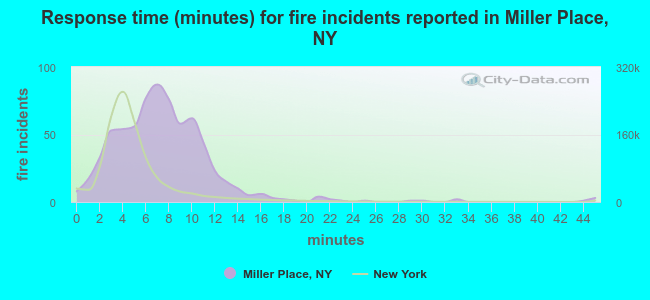 The median response time based on all reported fire incidents is 7 minutes. This is higher compared to the New York median value.
The median response time in Miller Place, NY compared to nearest cities:
(Note: Based on data for all years, including only cities with at least 500 fire incidents)
| Miller Place: | 7 minutes |
| Coram: | 6 minutes |
| Middle Island: | 7 minutes |
| Selden: | 4 minutes |
| Medford: | 4 minutes |
| Holbrook: | 4 minutes |
| Ronkonkoma: | 6 minutes |
| Shirley: | 7 minutes |
| East Patchogue: | 4 minutes |
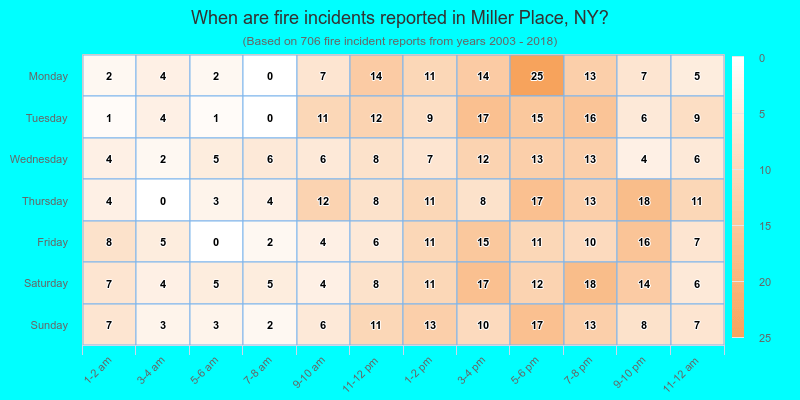
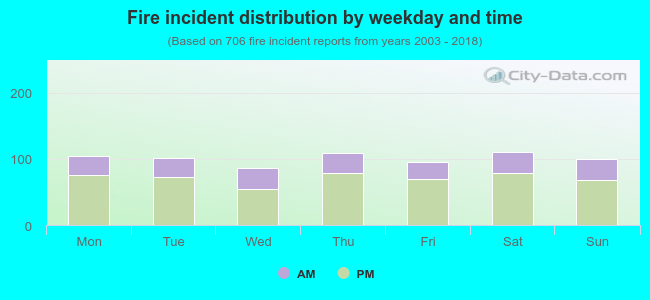 29.7% incidents where reported in the morning and 70.3% in the evening. The most fires (15.7%) took place on Saturday, and the least (12.2%) on Wednesday.
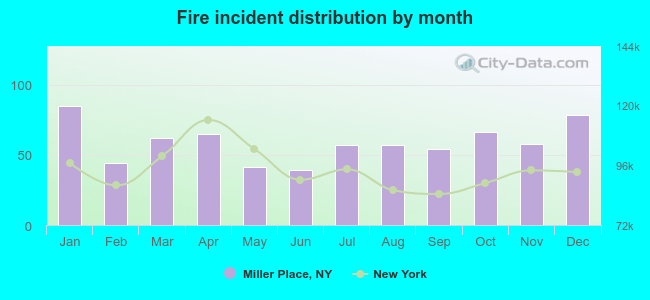 Based on the 706 fires from years 2003 - 2018 most fires (12.0%) took place during January, and the least (5.5%) in June.
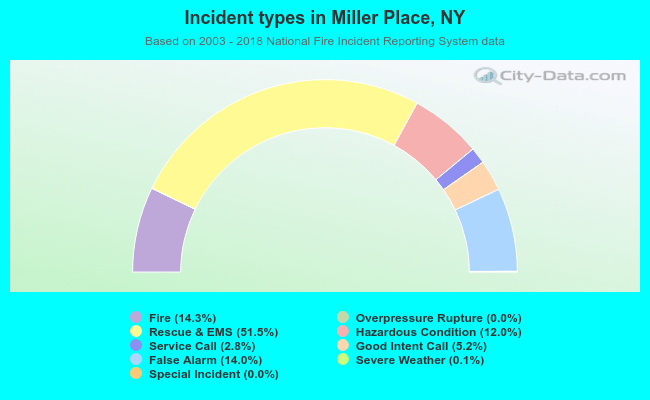 Out of all 4,920 cases reported during the years 2003 - 2018, the most belonged to the categories: Rescue & EMS (51.5%), Fire (14.3%), and False Alarm (14.0%).
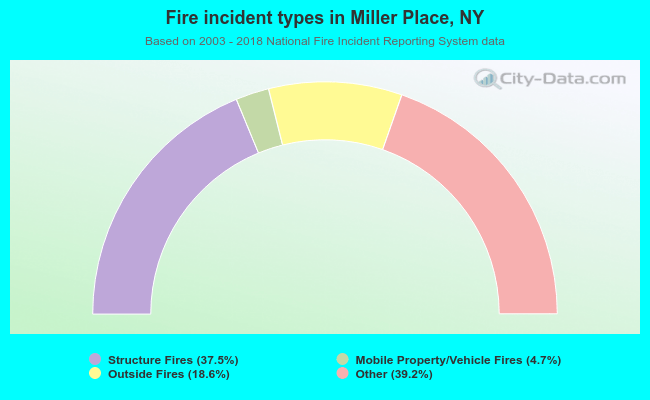 When looking into fire subcategories, the most incidents belonged to: Other (39.2%), and Structure Fires (37.5%).