Maquoketa: Fire Incidents, Iowa (IA)
Where are fire incidents reported in Maquoketa, IA
Something went wrong! Please refresh the page.
|
| |||||||||||||||||||||||||||||||||||||||||||||||||||||||||||||||||||||||||||||||||||||||||||||||||||||||||||||
| Other | 27 | |||||||||||||||||||||||||||||||||||||||||||||||||||||||||||||||||||||||||||||||||||||||||||||||||||||||||||||
2002 - 2018 National Fire Incident Reporting System (NFIRS) incidents
- Incident types reported to NFIRS in Maquoketa, IA
- 55946.8%Fire
- 23619.8%Hazardous Condition
- 22618.9%Rescue & EMS
- 665.5%Service Call
- 615.1%Good Intent Call
- 443.7%False Alarm
- 20.2%Special Incident
- Fire incident types reported to NFIRS in Maquoketa, IA
- 21638.6%Structure Fires
- 20636.9%Outside Fires
- 11620.8%Mobile Property/Vehicle Fires
- 213.8%Other
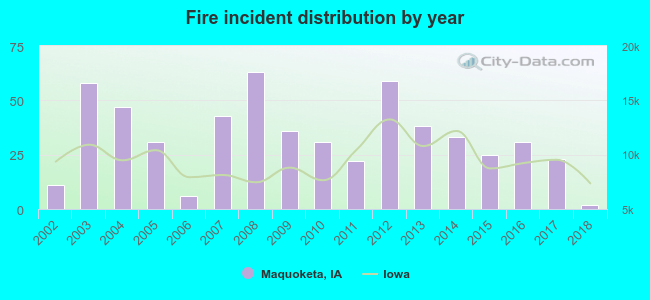 According to the data from the years 2002 - 2018 the average number of fires per year is 33. The highest number of fire incidents - 63 took place in 2008, and the least - 2 in 2018. The data has a decreasing trend.
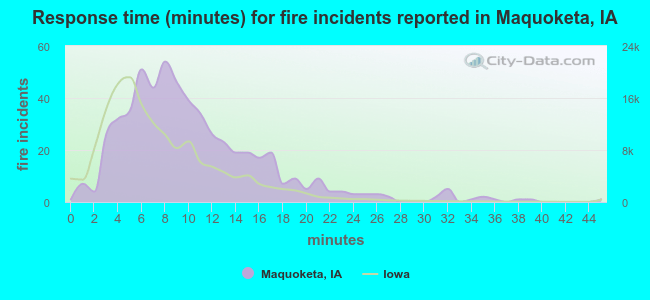 The median response time based on all reported fire incidents is 9 minutes. This is higher than the state median value.
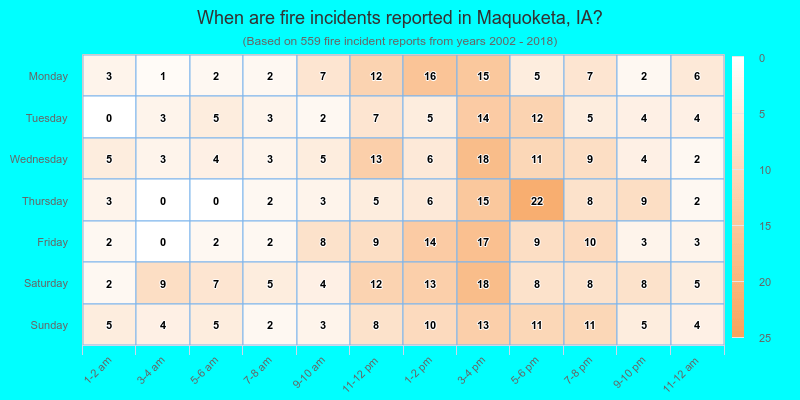
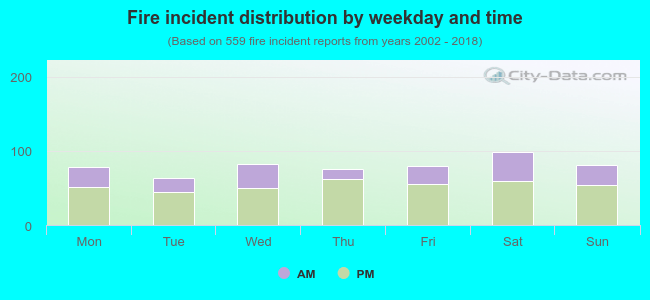 32.6% incidents where reported in the morning and 67.4% in the evening. The most fires (17.7%) took place on Saturday, and the least (11.4%) on Tuesday.
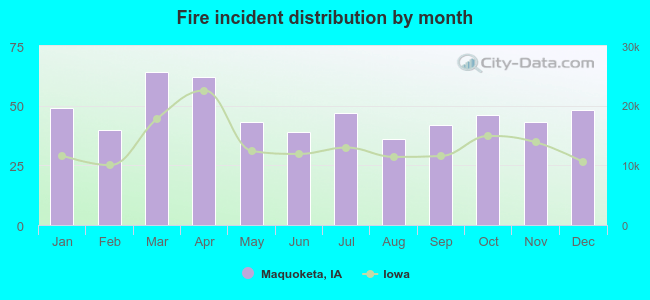 Based on the 559 fire incidents from years 2002 - 2018 most fires (11.4%) took place during March, and the least (6.4%) in August.
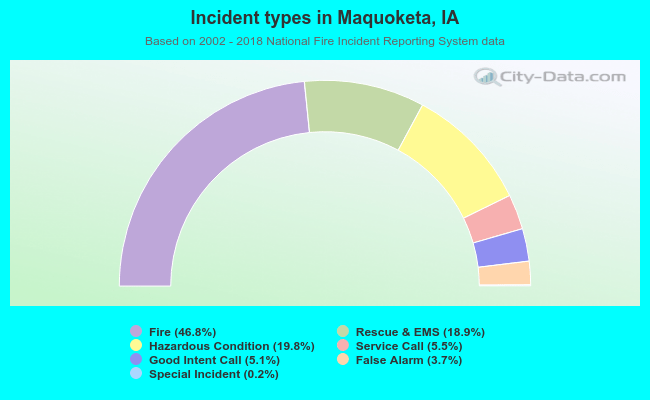 Out of all 1,194 cases reported during the years 2002 - 2018, the most belonged to the categories: Fire (46.8%), Rescue & EMS (19.8%), and Overpressure Rupture (18.9%).
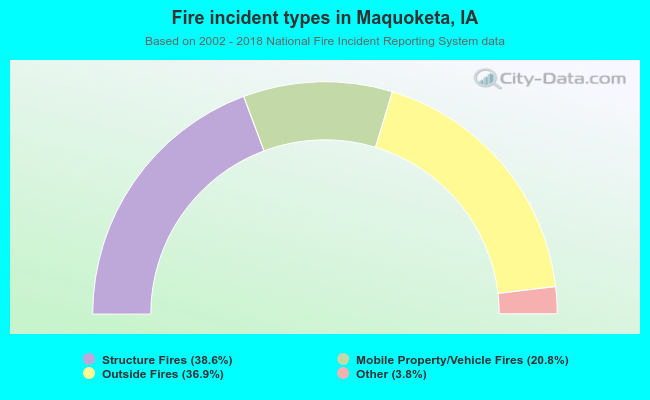 When looking into fire subcategories, the most reports belonged to: Structure Fires (38.6%), and Outside Fires (36.9%).