Lufkin: Fire Incidents, Texas (TX)
Where are fire incidents reported in Lufkin, TX
Something went wrong! Please refresh the page.
| Fire incidents reported | |
|---|---|
| Sreet name | Count |
| S. FIRST STREET | 164 |
| S. MEDFORD DRIVE | 132 |
| E. DENMAN AVENUE | 100 |
| N. TIMBERLAND DRIVE | 94 |
| SAYERS STREET | 90 |
| ATKINSON DRIVE | 88 |
| S FIRST STREET | 88 |
| S. JOHN REDDITT DRIVE | 88 |
| W. FRANK AVENUE | 82 |
| PAUL AVENUE | 76 |
| N. JOHN REDDITT DRIVE | 62 |
| S. CHESTNUT STREET | 60 |
| E. LUFKIN AVENUE | 54 |
| KELTYS STREET | 54 |
| LOTUS LANE | 54 |
| S. TIMBERLAND DRIVE | 54 |
| CHAMPIONS DRIVE | 52 |
| ELLEN TROUT DRIVE | 52 |
| KURTH DRIVE | 52 |
| S MEDFORD DRIVE | 52 |
| SOUTHWOOD DRIVE | 52 |
| N. MEDFORD DRIVE | 50 |
| N. RAGUET STREET | 48 |
| DANIEL MCCALL DRIVE | 44 |
| S JOHN REDDITT DRIVE | 44 |
| N TIMBERLAND DRIVE | 42 |
| LAZY OAKS STREET | 40 |
| OLD MILL ROAD | 40 |
| PERSHING AVENUE | 40 |
| HUMASON AVENUE | 38 |
| Other | 1,584 |
2002 - 2018 National Fire Incident Reporting System (NFIRS) incidents
- Incident types reported to NFIRS in Lufkin, TX
- 8,77440.6%Rescue & EMS
- 3,57016.5%Fire
- 3,36815.6%Hazardous Condition
- 2,87713.3%Good Intent Call
- 1,4746.8%False Alarm
- 1,4646.8%Service Call
- 400.2%Special Incident
- Fire incident types reported to NFIRS in Lufkin, TX
- 1,61945.4%Outside Fires
- 1,18533.2%Structure Fires
- 62217.4%Mobile Property/Vehicle Fires
- 1444.0%Other
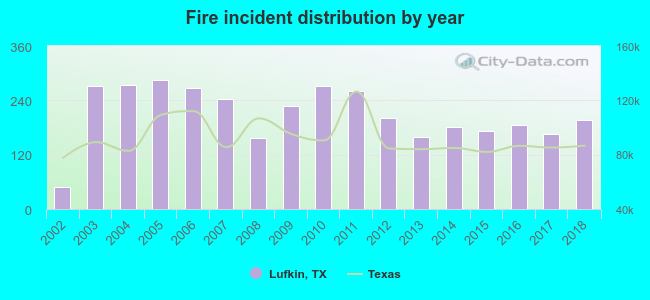 Based on the data from the years 2002 - 2018 the average number of fire incidents per year is 210. The highest number of fire incidents - 286 took place in 2005, and the least - 49 in 2002. The data has a growing trend.
The average number of yearly fire incidents per 10k residents in Lufkin, TX compared to nearest cities:
(Note: Based on data for the last 3 years, including only cities with population 5,000 and above)
| Lufkin: | 50.6 |
| Pollok: | 3.7 |
| Diboll: | 1.9 |
| Nacogdoches: | 73.1 |
| Rusk: | 1.8 |
| Crockett: | 76.2 |
| Livingston: | 316.0 |
| Center: | 186.7 |
| Jasper: | 141.9 |
 The median response time based on all reported fire incidents is 5 minutes. This is lower compared to the state median value.
The median response time in Lufkin, TX compared to nearest cities:
(Note: Based on data for all years, including only cities with at least 500 fire incidents)
| Lufkin: | 5 minutes |
| Nacogdoches: | 7 minutes |
| San Augustine: | 10 minutes |
| Woodville: | 9 minutes |
| Crockett: | 7 minutes |
| Lovelady: | 13 minutes |
| Livingston: | 7 minutes |
| Center: | 6 minutes |
| Grapeland: | 11 minutes |
 Based on the reports from the years 2002 - 2018 the average number of fire-related yearly deaths is 1. The highest number of reported deaths - 3 took place in 2003, and the lowest - 0 in 2002. The data has a constant trend.
The average number of deaths per 1,000 fire incidents is 3. This indicator was the highest - 11 in 2003, and the lowest 0 in 2002. The trend for fatalities per 1,000 fires is constant. Compared to the state value the number of deaths per 1,000 fires is much higher.
Based on the reports from the years 2002 - 2018 the average number of fire-related yearly deaths is 1. The highest number of reported deaths - 3 took place in 2003, and the lowest - 0 in 2002. The data has a constant trend.
The average number of deaths per 1,000 fire incidents is 3. This indicator was the highest - 11 in 2003, and the lowest 0 in 2002. The trend for fatalities per 1,000 fires is constant. Compared to the state value the number of deaths per 1,000 fires is much higher.Deaths per 1,000 incidents in Lufkin, TX compared to nearest cities:
(Note: Based on data for all years, including only cities with at least 2,500 fire incidents)
| Lufkin: | 3.9 |
| Nacogdoches: | 2.0 |
| Jasper: | 4.1 |
| Henderson: | 1.0 |
 According to the reports from the years 2002 - 2018 the average number of fire-related yearly casualties is 2. The highest number of casualties - 6 took place in 2012, and the lowest - 0 in 2002. The data has a growing trend.
The average number of casualties per 1,000 fire incidents is 8. This indicator was the highest - 30 in 2012, and the lowest 0 in 2002. The trend for casualties per 1,000 fires is increasing. Compared to the Texas value the number of injuries per 1,000 fire incidents is similar.
According to the reports from the years 2002 - 2018 the average number of fire-related yearly casualties is 2. The highest number of casualties - 6 took place in 2012, and the lowest - 0 in 2002. The data has a growing trend.
The average number of casualties per 1,000 fire incidents is 8. This indicator was the highest - 30 in 2012, and the lowest 0 in 2002. The trend for casualties per 1,000 fires is increasing. Compared to the Texas value the number of injuries per 1,000 fire incidents is similar.Casualties per 1,000 incidents in Lufkin, TX compared to nearest cities:
(Note: Based on data for all years, including only cities with at least 500 fire incidents)
| Lufkin: | 8.7 |
| Nacogdoches: | 2.8 |
| San Augustine: | 1.2 |
| Woodville: | 2.2 |
| Crockett: | 2.5 |
| Lovelady: | 0.0 |
| Livingston: | 0.5 |
| Center: | 0.8 |
| Grapeland: | 10.2 |
 29.9% incidents where reported in the morning and 70.1% in the evening. The most fires (15.1%) took place on Saturday, and the least (13.6%) on Sunday.
 According to the 3,570 fire incidents from years 2002 - 2018 most fires (10.8%) took place during March, and the least (6.9%) in September.
 Out of all 21,597 cases reported during the years 2002 - 2018, the most belonged to the categories: Rescue & EMS (40.6%), Fire (16.5%), and Hazardous Condition (15.6%).
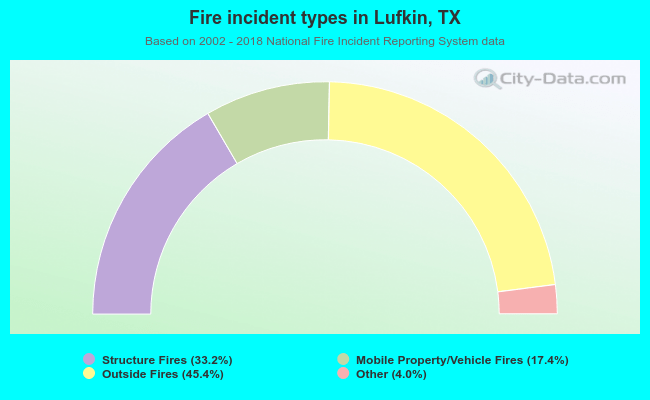 When looking into fire subcategories, the most incidents belonged to: Outside Fires (45.4%), and Structure Fires (33.2%).