Lacey: Fire Incidents, Washington (WA)
Where are fire incidents reported in Lacey, WA
Something went wrong! Please refresh the page.
| Fire incidents reported | |
|---|---|
| Sreet name | Count |
| MARTIN WAY | 378 |
| COLLEGE ST | 224 |
| MARVIN RD | 220 |
| PACIFIC AVE | 196 |
| CARPENTER RD | 188 |
| SLEATER KINNEY RD | 136 |
| RUDDELL RD | 120 |
| YELM HWY | 110 |
| LACEY BLVD | 102 |
| 45TH AVE | 100 |
| I-5 | 98 |
| GALAXY DR | 80 |
| SLEATER-KINNEY RD | 76 |
| 6TH AVE | 66 |
| 14TH AVE | 62 |
| I5 | 54 |
| HOGUM BAY RD | 52 |
| SLEATERKINNEY RD | 52 |
| MULLEN RD | 44 |
| INTELCO LOOP | 40 |
| WILLAMETTE DR | 38 |
| RIVER RIDGE DR | 36 |
| 22ND AVE | 34 |
| 30TH AVE | 34 |
| 55TH LN | 34 |
| GOLF CLUB RD | 34 |
| 19TH AVE | 26 |
| BRITTON PKY | 26 |
| MAGNOLIA ST | 26 |
| ARBOR DR | 24 |
2002 - 2018 National Fire Incident Reporting System (NFIRS) incidents
- Incident types reported to NFIRS in Lacey, WA
- 28,43871.2%Rescue & EMS
- 3,2558.2%Service Call
- 2,4766.2%Fire
- 2,2255.6%Good Intent Call
- 2,1895.5%False Alarm
- 1,2893.2%Hazardous Condition
- Fire incident types reported to NFIRS in Lacey, WA
- 1,01140.8%Structure Fires
- 92637.4%Outside Fires
- 39315.9%Mobile Property/Vehicle Fires
- 1465.9%Other
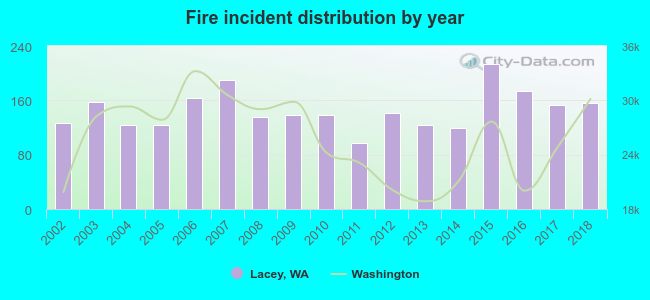 According to the data from the years 2002 - 2018 the average number of fires per year is 146. The highest number of reported fires - 214 took place in 2015, and the least - 97 in 2011. The data has an increasing trend.
The average number of yearly fire incidents per 10k residents in Lacey, WA compared to nearest cities:
(Note: Based on data for the last 3 years, including only cities with population 5,000 and above)
| Lacey: | 35.4 |
| Olympia: | 118.4 |
| Tumwater: | 58.6 |
| DuPont: | 2.9 |
| Yelm: | 167.0 |
| Steilacoom: | 8.1 |
| Lakewood: | 25.9 |
| University Place: | 13.1 |
| Spanaway: | 42.1 |
 The median response time based on all reported fire incidents is 6 minutes. This is close to the Washington median value.
The median response time in Lacey, WA compared to nearest cities:
(Note: Based on data for all years, including only cities with at least 500 fire incidents)
| Lacey: | 6 minutes |
| Olympia: | 7 minutes |
| Tumwater: | 7 minutes |
| Yelm: | 10 minutes |
| Tenino: | 10 minutes |
| Roy: | 13 minutes |
| Lakewood: | 7 minutes |
| University Place: | 6 minutes |
| Spanaway: | 7 minutes |
 Based on the reports from the years 2002 - 2018 the average number of fire-related yearly deaths is 0. The highest number of reported deaths - 1 took place in 2003, and the lowest - 0 in 2002. The data has a constant trend.
 Based on the reports from the years 2002 - 2018 the average number of fire-related casualties per year is 1. The highest number of casualties - 2 took place in 2008, and the lowest - 0 in 2003. The data has a constant trend.
The average number of casualties per 1,000 fire incidents is 4. This indicator was the highest - 15 in 2008, and the lowest 0 in 2003. The trend for casualties per 1,000 fires is decreasing. Compared to the Washington value the number of casualties per 1,000 incidents is much lower.
Based on the reports from the years 2002 - 2018 the average number of fire-related casualties per year is 1. The highest number of casualties - 2 took place in 2008, and the lowest - 0 in 2003. The data has a constant trend.
The average number of casualties per 1,000 fire incidents is 4. This indicator was the highest - 15 in 2008, and the lowest 0 in 2003. The trend for casualties per 1,000 fires is decreasing. Compared to the Washington value the number of casualties per 1,000 incidents is much lower.
 35.8% incidents where reported in the morning and 64.2% in the evening. The most fires (15.6%) took place on Monday, and the least (13.1%) on Sunday.
 Based on the 2,476 reports from years 2002 - 2018 most fires (19.1%) took place during July, and the least (4.5%) in February.
 Out of all 39,926 cases reported during the years 2002 - 2018, the most belonged to the categories: Rescue & EMS (71.2%), Service Call (8.2%), and Fire (6.2%).
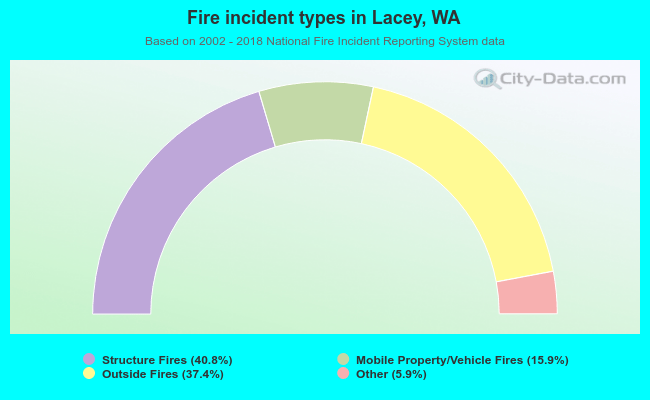 When looking into fire subcategories, the most incidents belonged to: Structure Fires (40.8%), and Outside Fires (37.4%).