Knoxville: Fire Incidents, Iowa (IA)
Where are fire incidents reported in Knoxville, IA
Something went wrong! Please refresh the page.
|
| |||||||||||||||||||||||||||||||||||||||||||||||||||||||||||||||||||||||||||||||||||||||||||||||||||||||||||||
2002 - 2018 National Fire Incident Reporting System (NFIRS) incidents
- Incident types reported to NFIRS in Knoxville, IA
- 35650.9%Fire
- 14220.3%Hazardous Condition
- 7110.1%False Alarm
- 699.9%Rescue & EMS
- 263.7%Good Intent Call
- 202.9%Service Call
- 121.7%Special Incident
- 40.6%Overpressure Rupture
- Fire incident types reported to NFIRS in Knoxville, IA
- 14139.6%Outside Fires
- 13537.9%Structure Fires
- 5014.0%Mobile Property/Vehicle Fires
- 308.4%Other
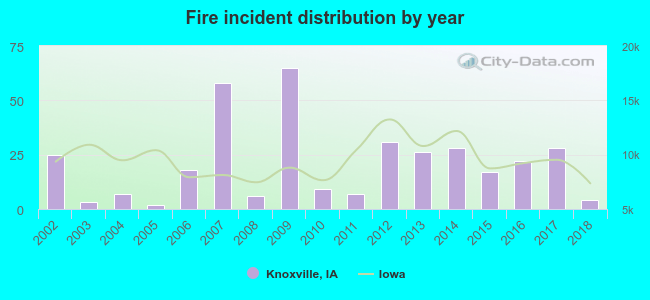 Based on the data from the years 2002 - 2018 the average number of fire incidents per year is 21. The highest number of reported fires - 65 took place in 2009, and the least - 2 in 2005. The data has a decreasing trend.
The average number of yearly fire incidents per 10k residents in Knoxville, IA compared to nearest cities:
(Note: Based on data for the last 3 years, including only cities with population 5,000 and above)
| Knoxville: | 24.8 |
| Pella: | 33.2 |
| Oskaloosa: | 40.1 |
| Indianola: | 7.6 |
| Newton: | 20.7 |
| Pleasant Hill: | 13.1 |
| Altoona: | 12.6 |
| Norwalk: | 2.0 |
| Des Moines: | 20.0 |
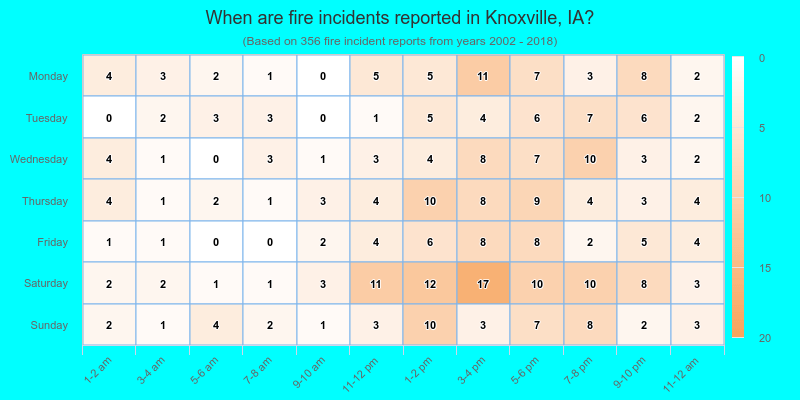
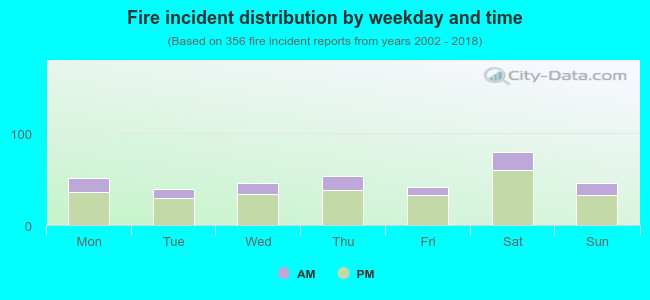 25.8% incidents where reported in the morning and 74.2% in the evening. The most fires (22.5%) took place on Saturday, and the least (11.0%) on Tuesday.
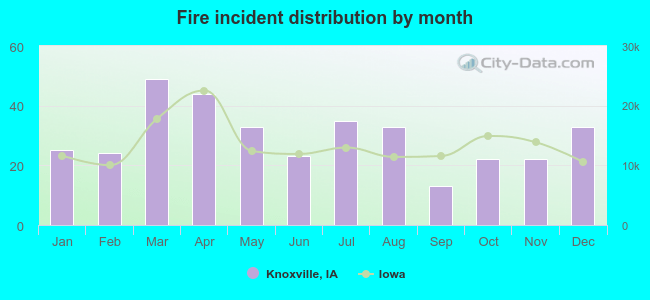 According to the 356 reports from years 2002 - 2018 most fires (13.8%) took place during March, and the least (3.7%) in September.
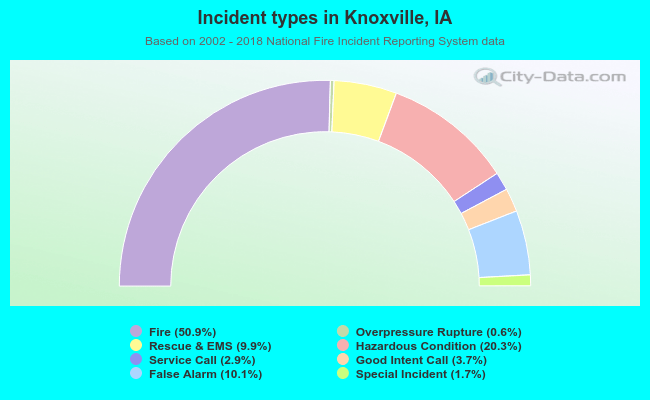 Out of all 700 cases reported during the years 2002 - 2018, the most belonged to the categories: Fire (50.9%), Hazardous Condition (20.3%), and False Alarm (10.1%).
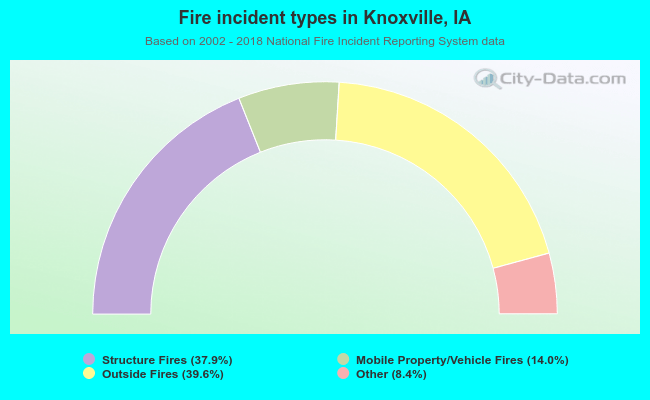 When looking into fire subcategories, the most incidents belonged to: Outside Fires (39.6%), and Structure Fires (37.9%).