Kennedale: Fire Incidents, Texas (TX)
Where are fire incidents reported in Kennedale, TX
Something went wrong! Please refresh the page.
| Fire incidents reported | |
|---|---|
| Sreet name | Count |
| KENNEDALE PKY | 190 |
| DICK PRICE RD | 144 |
| MANSFIELD HWY | 96 |
| NEW HOPE RD | 74 |
| EDEN RD | 68 |
| OAKCREST DR | 56 |
| LITTLE SCHOOL RD | 50 |
| JOPLIN RD | 48 |
| NORTH RD | 44 |
| MANSFIELD CARDINAL RD | 42 |
| SWINEY HIETT RD | 38 |
| BOWMAN SPRINGS RD | 30 |
| DANNY DR | 28 |
| HUDSON VILLAGE CREEK RD | 26 |
| HUDSON CEMETERY RD | 24 |
| SUBLETT RD | 24 |
| WOODLAND CT | 22 |
| GERTIE BARRETT RD | 20 |
| PEACHTREE CT | 20 |
| COLLETT SUBLETT RD | 18 |
| PINE MEADOW DR | 16 |
| VALLEY TRL | 16 |
| ARTHUR DR | 14 |
| KENNEDALE NEW HOPE RD | 14 |
| LINDALE RD | 14 |
| MISTLETOE DR | 14 |
| PENNSYLVANIA AVE | 14 |
| SHADY OAKS DR | 14 |
| TREEPOINT DR | 14 |
| VALLEY LA | 14 |
2002 - 2018 National Fire Incident Reporting System (NFIRS) incidents
- Incident types reported to NFIRS in Kennedale, TX
- 3,17850.7%Rescue & EMS
- 98615.7%Fire
- 81112.9%Hazardous Condition
- 6039.6%Service Call
- 4767.6%Good Intent Call
- 2023.2%False Alarm
- 70.1%Overpressure Rupture
- Fire incident types reported to NFIRS in Kennedale, TX
- 48649.3%Outside Fires
- 35836.3%Structure Fires
- 12012.2%Mobile Property/Vehicle Fires
- 222.2%Other
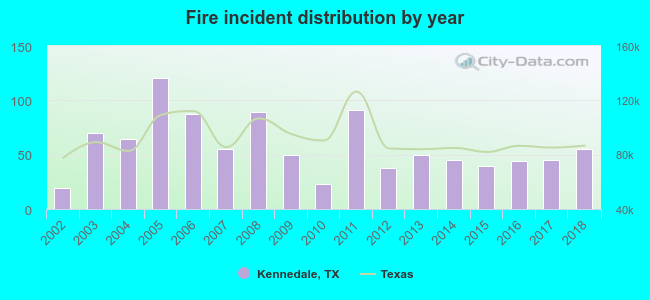 According to the data from the years 2002 - 2018 the average number of fires per year is 58. The highest number of reported fire incidents - 121 took place in 2005, and the least - 19 in 2002. The data has an increasing trend.
The average number of yearly fire incidents per 10k residents in Kennedale, TX compared to nearest cities:
(Note: Based on data for the last 3 years, including only cities with population 5,000 and above)
| Kennedale: | 64.9 |
| Forest Hill: | 53.9 |
| Everman: | 45.4 |
| Rendon: | 22.8 |
| Arlington: | 23.6 |
| Mansfield: | 22.7 |
| Fort Worth: | 11.7 |
| Crowley: | 48.7 |
| Burleson: | 41.9 |
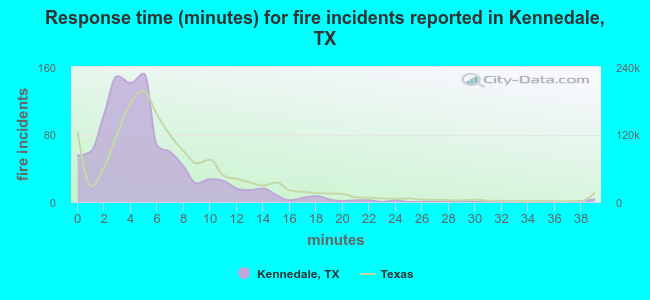 The median response time based on all reported fire incidents is 4 minutes. This is lower than the Texas median value.
The median response time in Kennedale, TX compared to nearest cities:
(Note: Based on data for all years, including only cities with at least 500 fire incidents)
| Kennedale: | 4 minutes |
| Forest Hill: | 5 minutes |
| Everman: | 6 minutes |
| Rendon: | 12 minutes |
| Arlington: | 5 minutes |
| Mansfield: | 6 minutes |
| Fort Worth: | 4 minutes |
| Crowley: | 6 minutes |
| Burleson: | 8 minutes |
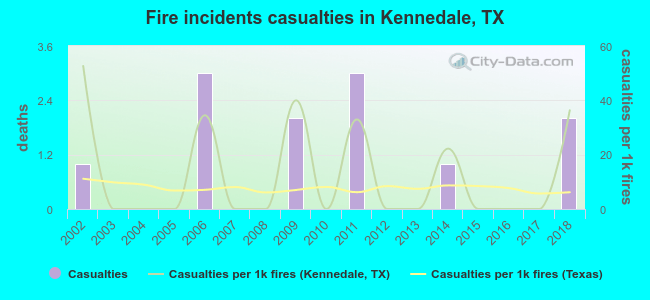 Based on the reports from the years 2002 - 2018 the average number of fire-related yearly casualties is 1. The highest number of reported injuries - 3 took place in 2006, and the lowest - 0 in 2003. The data has a rising trend.
The average number of injuries per 1,000 fires is 13. This indicator was the highest - 53 in 2002, and the lowest 0 in 2003. The trend for casualties per 1,000 fire incidents is declining. Compared to the Texas value the number of casualties per 1,000 incidents is higher.
Based on the reports from the years 2002 - 2018 the average number of fire-related yearly casualties is 1. The highest number of reported injuries - 3 took place in 2006, and the lowest - 0 in 2003. The data has a rising trend.
The average number of injuries per 1,000 fires is 13. This indicator was the highest - 53 in 2002, and the lowest 0 in 2003. The trend for casualties per 1,000 fire incidents is declining. Compared to the Texas value the number of casualties per 1,000 incidents is higher.Casualties per 1,000 incidents in Kennedale, TX compared to nearest cities:
(Note: Based on data for all years, including only cities with at least 500 fire incidents)
| Kennedale: | 12.2 |
| Forest Hill: | 9.5 |
| Everman: | 0.0 |
| Rendon: | 0.0 |
| Arlington: | 26.2 |
| Mansfield: | 18.9 |
| Fort Worth: | 9.7 |
| Crowley: | 5.4 |
| Burleson: | 3.1 |
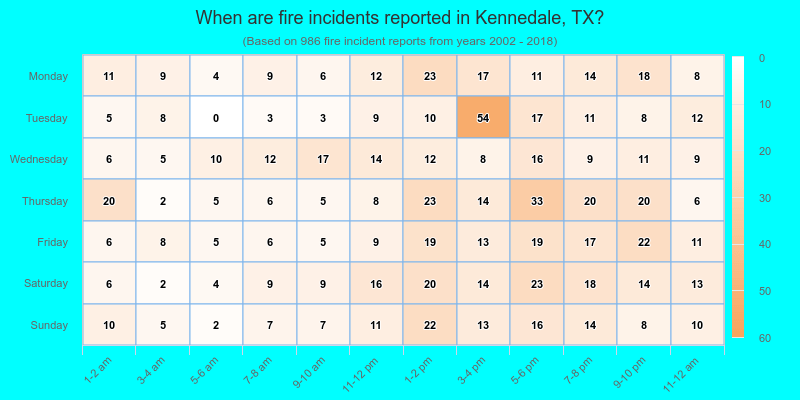
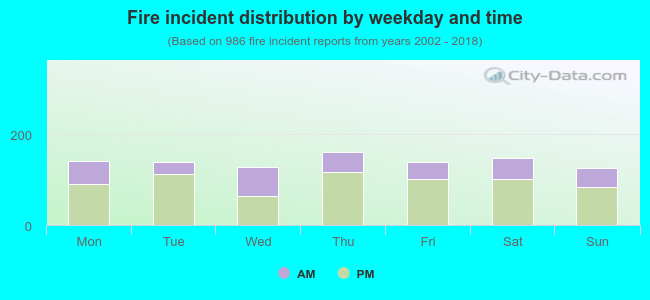 32.0% incidents where reported in the morning and 68.0% in the evening. The most fires (16.4%) took place on Thursday, and the least (12.7%) on Sunday.
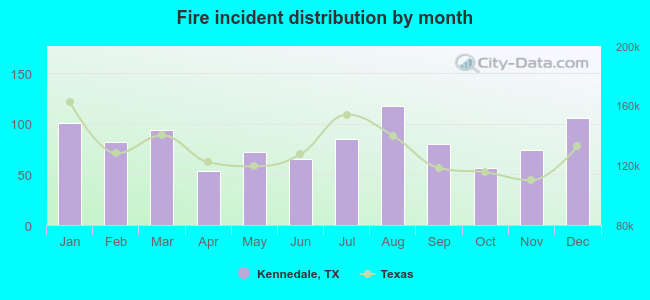 Based on the 986 fire incident reports from years 2002 - 2018 most fires (12.0%) took place during August, and the least (5.4%) in April.
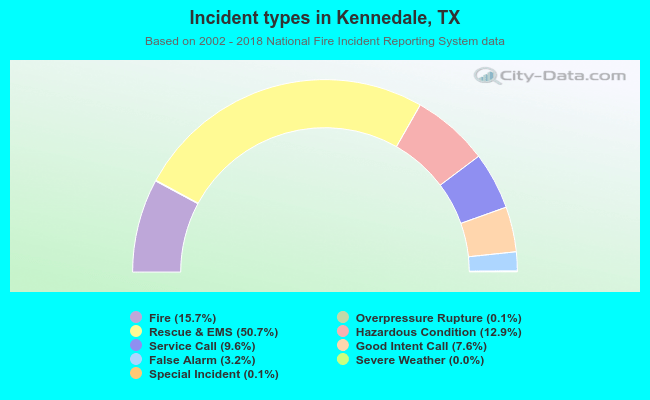 Out of all 6,270 cases reported during the years 2002 - 2018, the most belonged to the categories: Rescue & EMS (50.7%), Fire (15.7%), and Hazardous Condition (12.9%).
 When looking into fire subcategories, the most incidents belonged to: Outside Fires (49.3%), and Structure Fires (36.3%).