Kalamazoo: Fire Incidents, Michigan (MI)
Where are fire incidents reported in Kalamazoo, MI
Something went wrong! Please refresh the page.
| Fire incidents reported | |
|---|---|
| Sreet name | Count |
| MAIN ST | 434 |
| MICHIGAN AVE | 344 |
| BURDICK ST | 242 |
| GULL RD | 238 |
| STADIUM DR | 230 |
| DRAKE RD | 216 |
| D AVE | 196 |
| DOUGLAS AVE | 188 |
| 9TH ST | 166 |
| CORK ST | 150 |
| WESTNEDGE AVE | 136 |
| ROSE ST | 120 |
| RIVERVIEW DR | 118 |
| G AVE | 114 |
| 6TH ST | 108 |
| US 131 HWY | 108 |
| FRATERNITY VILLAGE DR | 106 |
| 12TH ST | 96 |
| I-94 EXPY | 94 |
| PORTAGE ST | 92 |
| SUNNYSIDE DR | 92 |
| LAKE ST | 90 |
| N AVE | 90 |
| H AVE | 86 |
| KENDALL AVE | 86 |
| 11TH ST | 80 |
| PARK ST | 80 |
| RAVINE RD | 78 |
| 2ND ST | 76 |
| KNOLLWOOD AVE | 74 |
| Other | 4,161 |
2002 - 2018 National Fire Incident Reporting System (NFIRS) incidents
- Incident types reported to NFIRS in Kalamazoo, MI
- 42,34057.5%Rescue & EMS
- 10,03913.6%Good Intent Call
- 8,48911.5%Fire
- 4,6376.3%Service Call
- 4,1405.6%Hazardous Condition
- 3,7285.1%False Alarm
- 900.1%Special Incident
- 830.1%Overpressure Rupture
- Fire incident types reported to NFIRS in Kalamazoo, MI
- 4,48352.8%Structure Fires
- 2,20426.0%Outside Fires
- 1,59718.8%Mobile Property/Vehicle Fires
- 2052.4%Other
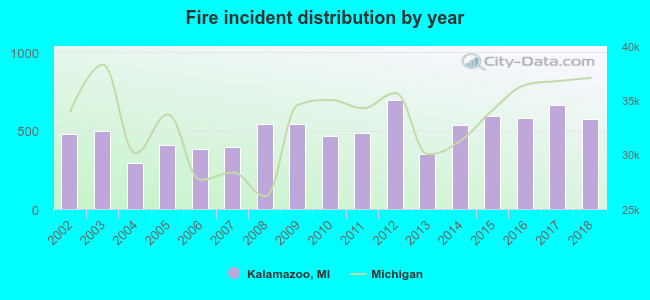 Based on the data from the years 2002 - 2018 the average number of fires per year is 499. The highest number of reported fire incidents - 693 took place in 2012, and the least - 294 in 2004. The data has a growing trend.
The average number of yearly fire incidents per 10k residents in Kalamazoo, MI compared to nearest cities:
(Note: Based on data for the last 3 years, including only cities with population 5,000 and above)
| Kalamazoo: | 79.9 |
| Portage: | 23.9 |
| Springfield: | 46.1 |
| Battle Creek: | 54.7 |
| Allegan: | 153.8 |
| Three Rivers: | 23.2 |
| Hastings: | 89.5 |
| Marshall: | 75.8 |
| Dowagiac: | 121.2 |
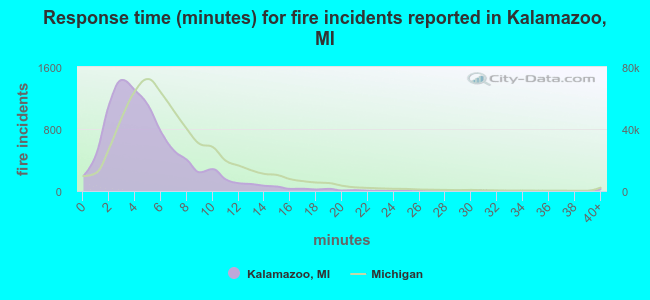 The median response time based on all reported fire incidents is 4 minutes. This is lower compared to the state median value.
The median response time in Kalamazoo, MI compared to nearest cities:
(Note: Based on data for all years, including only cities with at least 500 fire incidents)
| Kalamazoo: | 4 minutes |
| Portage: | 5 minutes |
| Richland: | 6 minutes |
| Vicksburg: | 8 minutes |
| Plainwell: | 7 minutes |
| Paw Paw: | 5 minutes |
| Delton: | 10 minutes |
| Battle Creek: | 5 minutes |
| Allegan: | 8 minutes |
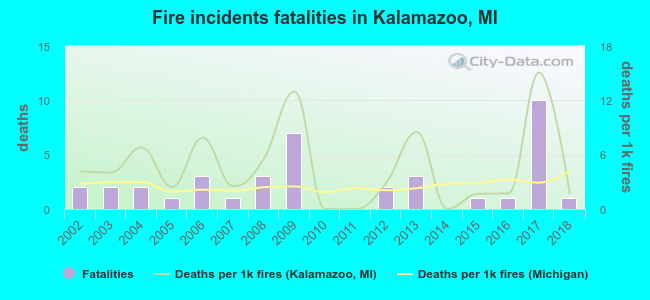 Based on the reports from the years 2002 - 2018 the average number of fire-related yearly deaths is 2. The highest number of reported deaths - 10 took place in 2017, and the lowest - 0 in 2010. The data has a dropping trend.
The average number of deaths per 1,000 fire incidents is 5. This indicator was the highest - 15 in 2017, and the lowest 0 in 2010. The trend for deaths per 1,000 fire incidents is dropping. Compared to the state value the number of deaths per 1,000 fires is higher.
Based on the reports from the years 2002 - 2018 the average number of fire-related yearly deaths is 2. The highest number of reported deaths - 10 took place in 2017, and the lowest - 0 in 2010. The data has a dropping trend.
The average number of deaths per 1,000 fire incidents is 5. This indicator was the highest - 15 in 2017, and the lowest 0 in 2010. The trend for deaths per 1,000 fire incidents is dropping. Compared to the state value the number of deaths per 1,000 fires is higher.Deaths per 1,000 incidents in Kalamazoo, MI compared to nearest cities:
(Note: Based on data for all years, including only cities with at least 2,500 fire incidents)
| Kalamazoo: | 4.6 |
| Battle Creek: | 4.6 |
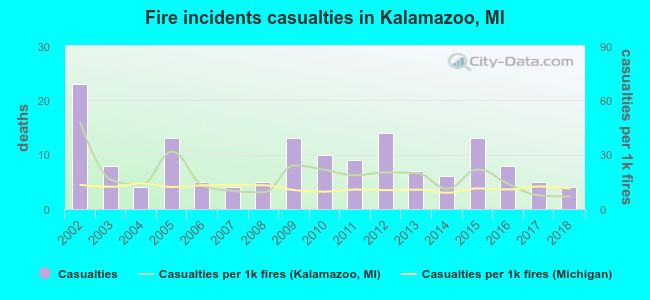 According to the data from the years 2002 - 2018 the average number of fire-related yearly casualties is 9. The highest number of casualties - 23 took place in 2002, and the lowest - 4 in 2004. The data has a decreasing trend.
The average number of casualties per 1,000 fires is 18. This indicator was the highest - 48 in 2002, and the lowest 7 in 2018. The trend for casualties per 1,000 fire incidents is dropping. Compared to the Michigan value the number of injuries per 1,000 fires is higher.
According to the data from the years 2002 - 2018 the average number of fire-related yearly casualties is 9. The highest number of casualties - 23 took place in 2002, and the lowest - 4 in 2004. The data has a decreasing trend.
The average number of casualties per 1,000 fires is 18. This indicator was the highest - 48 in 2002, and the lowest 7 in 2018. The trend for casualties per 1,000 fire incidents is dropping. Compared to the Michigan value the number of injuries per 1,000 fires is higher.
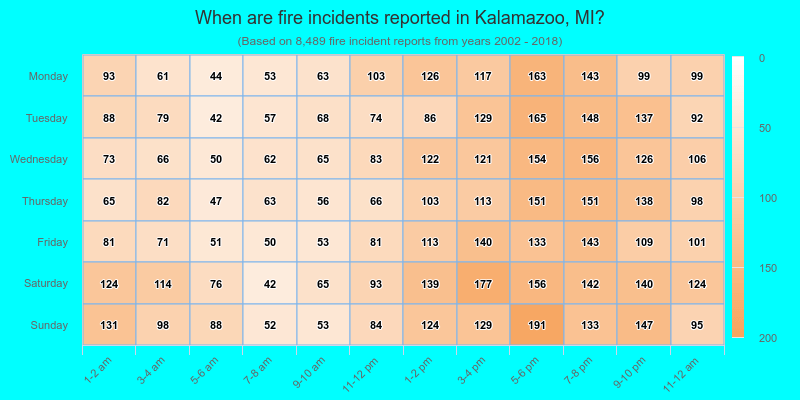
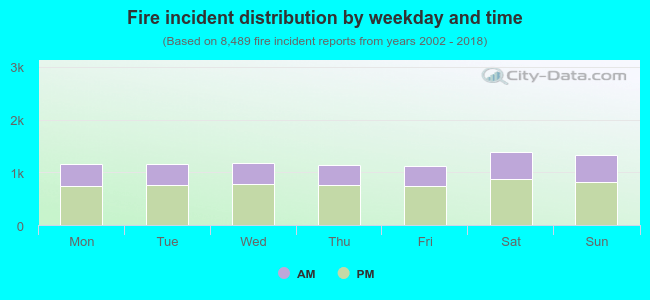 35.5% incidents where reported in the morning and 64.5% in the evening. The most fires (16.4%) took place on Saturday, and the least (13.3%) on Friday.
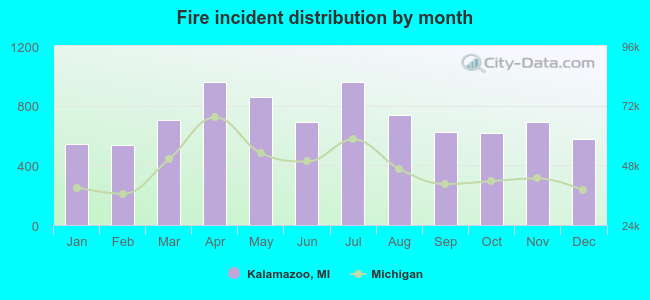 Based on the 8,489 fires from years 2002 - 2018 most fires (11.3%) took place during April, and the least (6.3%) in February.
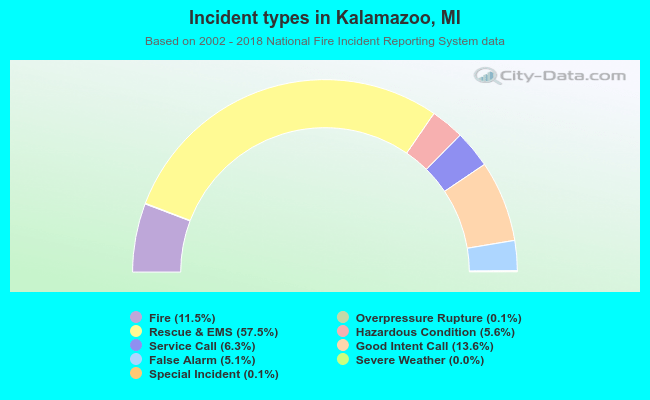 Out of all 73,581 cases reported during the years 2002 - 2018, the most belonged to the categories: Rescue & EMS (57.5%), Good Intent Call (13.6%), and Fire (11.5%).
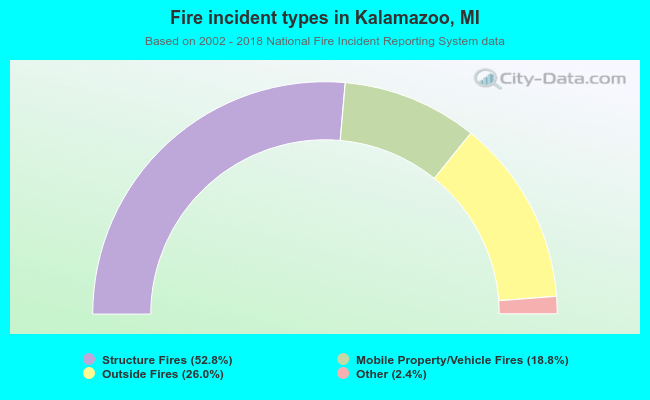 When looking into fire subcategories, the most incidents belonged to: Structure Fires (52.8%), and Outside Fires (26.0%).