Hernando: Fire Incidents, Mississippi (MS)
Where are fire incidents reported in Hernando, MS
Something went wrong! Please refresh the page.
| Fire incidents reported | |
|---|---|
| Sreet name | Count |
| I-55 | 94 |
| HWY 304 | 78 |
| HWY 51 | 72 |
| HWY 301 | 66 |
| I55 | 52 |
| GETWELL RD | 46 |
| I55 HWY | 42 |
| GETWELL | 38 |
| HOLLY SPRINGS RD | 36 |
| MCINGVALE | 36 |
| FOGG RD | 34 |
| BYHALIA | 32 |
| OAK GROVE RD | 32 |
| MALONE RD | 30 |
| HWY 305 | 28 |
| I-55 NORTH BOUND | 28 |
| MCINGVALE RD | 28 |
| BLUFF RD | 26 |
| HOLLY SPRINGS | 26 |
| LOVE RD | 26 |
| COMMERCE | 24 |
| OAK GROVE | 24 |
| I69 | 22 |
| WETONGA LN | 22 |
| GREEN RIVER RD | 20 |
| HIGHWAY 51 SOUTH | 20 |
| LAUGHTER RD | 20 |
| WILLIAMS RD | 20 |
| 305 HWY | 18 |
| BALDWIN RD | 18 |
| Other | 1,751 |
2003 - 2018 National Fire Incident Reporting System (NFIRS) incidents
- Incident types reported to NFIRS in Hernando, MS
- 8,19663.3%Rescue & EMS
- 2,80921.7%Fire
- 6735.2%Hazardous Condition
- 6404.9%False Alarm
- 3362.6%Good Intent Call
- 2501.9%Service Call
- 140.1%Overpressure Rupture
- Fire incident types reported to NFIRS in Hernando, MS
- 1,27145.2%Outside Fires
- 1,04037.0%Structure Fires
- 43115.3%Mobile Property/Vehicle Fires
- 672.4%Other
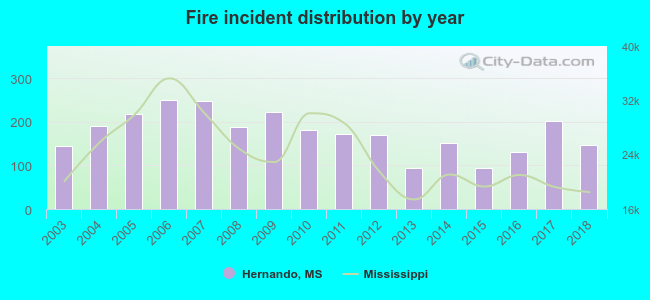 According to the data from the years 2003 - 2018 the average number of fires per year is 175. The highest number of reported fires - 249 took place in 2006, and the least - 94 in 2013. The data has an increasing trend.
The average number of yearly fire incidents per 10k residents in Hernando, MS compared to nearest cities:
(Note: Based on data for the last 3 years, including only cities with population 5,000 and above)
| Hernando: | 104.2 |
| Horn Lake: | 37.9 |
| Southaven: | 30.0 |
| Olive Branch: | 52.0 |
| Senatobia: | 158.1 |
| Holly Springs: | 220.9 |
| Batesville: | 247.3 |
| Oxford: | 98.1 |
 The median response time based on all reported fire incidents is 8 minutes. This is about the same as the Mississippi median value.
The median response time in Hernando, MS compared to nearest cities:
(Note: Based on data for all years, including only cities with at least 500 fire incidents)
| Hernando: | 8 minutes |
| Horn Lake: | 4 minutes |
| Southaven: | 5 minutes |
| Coldwater: | 10 minutes |
| Walls: | 8 minutes |
| Olive Branch: | 6 minutes |
| Senatobia: | 7 minutes |
| Byhalia: | 12 minutes |
| Como: | 12 minutes |
 Based on the data from the years 2003 - 2018 the average number of fire-related fatalities per year is 0. The highest number of deaths - 2 took place in 2017, and the lowest - 0 in 2003. The data has a growing trend.
The average number of fatalities per 1,000 fires is 2. This indicator was the highest - 14 in 2018, and the lowest 0 in 2003. The trend for fatalities per 1,000 fire incidents is growing. Compared to the Mississippi value the number of deaths per 1,000 incidents is about the same.
Based on the data from the years 2003 - 2018 the average number of fire-related fatalities per year is 0. The highest number of deaths - 2 took place in 2017, and the lowest - 0 in 2003. The data has a growing trend.
The average number of fatalities per 1,000 fires is 2. This indicator was the highest - 14 in 2018, and the lowest 0 in 2003. The trend for fatalities per 1,000 fire incidents is growing. Compared to the Mississippi value the number of deaths per 1,000 incidents is about the same.Deaths per 1,000 incidents in Hernando, MS compared to nearest cities:
(Note: Based on data for all years, including only cities with at least 2,500 fire incidents)
| Hernando: | 2.1 |
| Southaven: | 3.5 |
| Olive Branch: | 1.4 |
| Byhalia: | 1.4 |
| West Memphis: | 2.6 |
| Holly Springs: | 1.5 |
| Batesville: | 2.7 |
| Oxford: | 2.5 |
 Based on the data from the years 2003 - 2018 the average number of fire-related casualties per year is 1. The highest number of reported injuries - 5 took place in 2011, and the lowest - 0 in 2003. The data has a constant trend.
The average number of injuries per 1,000 fires is 3. This indicator was the highest - 29 in 2011, and the lowest 0 in 2003. The trend for injuries per 1,000 incidents is constant. Compared to the Mississippi value the number of casualties per 1,000 incidents is similar.
Based on the data from the years 2003 - 2018 the average number of fire-related casualties per year is 1. The highest number of reported injuries - 5 took place in 2011, and the lowest - 0 in 2003. The data has a constant trend.
The average number of injuries per 1,000 fires is 3. This indicator was the highest - 29 in 2011, and the lowest 0 in 2003. The trend for injuries per 1,000 incidents is constant. Compared to the Mississippi value the number of casualties per 1,000 incidents is similar.
 29.6% incidents where reported in the morning and 70.4% in the evening. The most fires (15.8%) took place on Monday, and the least (12.9%) on Wednesday.
 According to the 2,809 incident reports from years 2003 - 2018 most fires (11.1%) took place during March, and the least (6.6%) in October.
 Out of all 12,939 cases reported during the years 2003 - 2018, the most belonged to the categories: Rescue & EMS (63.3%), Fire (21.7%), and Hazardous Condition (5.2%).
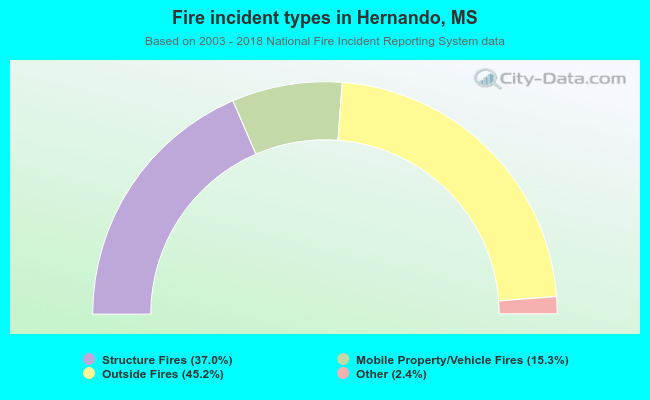 When looking into fire subcategories, the most reports belonged to: Outside Fires (45.2%), and Structure Fires (37.0%).