Grapevine: Fire Incidents, Texas (TX)
Where are fire incidents reported in Grapevine, TX
Something went wrong! Please refresh the page.
| Fire incidents reported | |
|---|---|
| Sreet name | Count |
| MUSTANG DR | 330 |
| STATE HWY 121 HWY | 228 |
| STATE HWY 114 HWY | 190 |
| SH 114 | 148 |
| SH 121 | 136 |
| MAIN ST | 120 |
| WILLIAM D TATE AVE | 120 |
| DOVE LOOP RD | 114 |
| PARK BLVD | 110 |
| GRAPEVINE MILLS PKWY | 94 |
| GRAPEVINE MILLS CIR | 92 |
| GRAYSON DR | 92 |
| FAIRWAY DR | 84 |
| NORTHWEST HWY | 80 |
| TIMBERLINE DR | 74 |
| INTERNATIONAL PARK | 72 |
| IRA E WOODS AVE | 70 |
| DOVE RD | 64 |
| TURNER RD | 64 |
| WILLIAM D. TATE AVE | 64 |
| HALL JOHNSON RD | 62 |
| GRAPEVINE MILLS BLVD | 58 |
| STATE HWY 26 HWY | 56 |
| STATE HWY 360 | 54 |
| SH 26 | 52 |
| INDUSTRIAL BLVD | 48 |
| BASS PRO DR | 44 |
| DALLAS RD | 42 |
| DOOLEY ST | 42 |
| SERVICE RD | 42 |
| Other | 410 |
2002 - 2018 National Fire Incident Reporting System (NFIRS) incidents
- Incident types reported to NFIRS in Grapevine, TX
- 28,50759.8%Rescue & EMS
- 5,02210.5%Hazardous Condition
- 4,4609.4%False Alarm
- 3,2656.9%Good Intent Call
- 3,2566.8%Fire
- 3,0536.4%Service Call
- Fire incident types reported to NFIRS in Grapevine, TX
- 1,25238.5%Outside Fires
- 1,07733.1%Structure Fires
- 68020.9%Mobile Property/Vehicle Fires
- 2477.6%Other
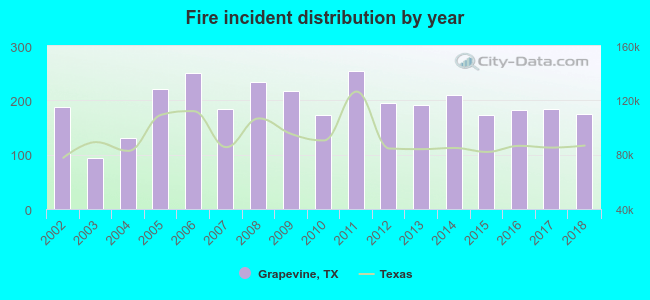 Based on the data from the years 2002 - 2018 the average number of fires per year is 192. The highest number of fire incidents - 254 took place in 2011, and the least - 93 in 2003. The data has a decreasing trend.
The average number of yearly fire incidents per 10k residents in Grapevine, TX compared to nearest cities:
(Note: Based on data for the last 3 years, including only cities with population 5,000 and above)
| Grapevine: | 35.5 |
| Southlake: | 28.4 |
| Colleyville: | 22.2 |
| Euless: | 29.7 |
| Coppell: | 20.3 |
| Flower Mound: | 16.0 |
| Bedford: | 29.2 |
| Trophy Club: | 24.9 |
| Lewisville: | 27.2 |
 The median response time based on all reported fire incidents is 5 minutes. This is lower than the Texas median value.
The median response time in Grapevine, TX compared to nearest cities:
(Note: Based on data for all years, including only cities with at least 500 fire incidents)
| Grapevine: | 5 minutes |
| Southlake: | 6 minutes |
| Colleyville: | 7 minutes |
| Euless: | 5 minutes |
| Coppell: | 5 minutes |
| Flower Mound: | 6 minutes |
| Bedford: | 4 minutes |
| Lewisville: | 5 minutes |
| Keller: | 6 minutes |
 Based on the reports from the years 2002 - 2018 the average number of fire-related casualties per year is 2. The highest number of casualties - 4 took place in 2002, and the lowest - 0 in 2013. The data has a declining trend.
The average number of injuries per 1,000 fires is 10. This indicator was the highest - 22 in 2003, and the lowest 0 in 2013. The trend for injuries per 1,000 fire incidents is dropping. Compared to the state value the number of injuries per 1,000 fires is higher.
Based on the reports from the years 2002 - 2018 the average number of fire-related casualties per year is 2. The highest number of casualties - 4 took place in 2002, and the lowest - 0 in 2013. The data has a declining trend.
The average number of injuries per 1,000 fires is 10. This indicator was the highest - 22 in 2003, and the lowest 0 in 2013. The trend for injuries per 1,000 fire incidents is dropping. Compared to the state value the number of injuries per 1,000 fires is higher.Casualties per 1,000 incidents in Grapevine, TX compared to nearest cities:
(Note: Based on data for all years, including only cities with at least 500 fire incidents)
| Grapevine: | 9.2 |
| Southlake: | 2.4 |
| Colleyville: | 2.2 |
| Euless: | 35.9 |
| Coppell: | 8.6 |
| Flower Mound: | 21.1 |
| Bedford: | 30.9 |
| Lewisville: | 8.1 |
| Keller: | 17.7 |
 31.7% incidents where reported in the morning and 68.3% in the evening. The most fires (16.3%) took place on Friday, and the least (12.8%) on Wednesday.
 Based on the 3,256 incident reports from years 2002 - 2018 most fires (11.4%) took place during July, and the least (6.5%) in September.
 Out of all 47,645 cases reported during the years 2002 - 2018, the most belonged to the categories: Rescue & EMS (59.8%), Hazardous Condition (10.5%), and False Alarm (9.4%).
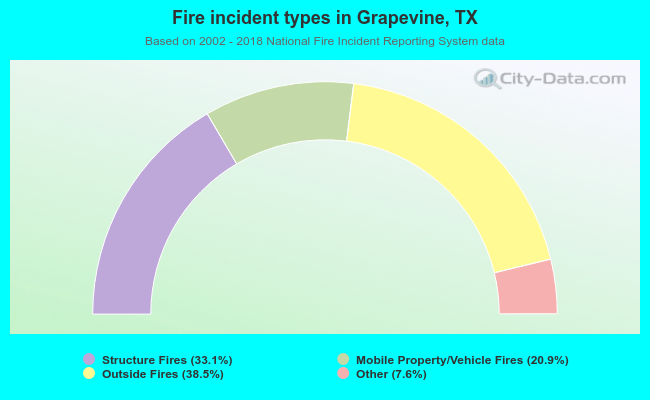 When looking into fire subcategories, the most reports belonged to: Outside Fires (38.5%), and Structure Fires (33.1%).