Gilbert: Fire Incidents, Arizona (AZ)
Where are fire incidents reported in Gilbert, AZ
Something went wrong! Please refresh the page.
| Fire incidents reported | |
|---|---|
| Sreet name | Count |
| GILBERT RD | 266 |
| BASELINE RD | 186 |
| GUADALUPE RD | 184 |
| HIGLEY RD | 164 |
| ELLIOT RD | 134 |
| VAL VISTA DR | 134 |
| POWER RD | 128 |
| GERMANN RD | 116 |
| GREENFIELD RD | 112 |
| JUNIPER AVE | 104 |
| LINDSAY RD | 104 |
| PECOS RD | 90 |
| WARNER RD | 84 |
| RAY RD | 80 |
| COOPER RD | 74 |
| MCQUEEN RD | 66 |
| WILLIAMS FIELD RD | 66 |
| SAN ANGELO ST | 64 |
| RECKER RD | 54 |
| CHANDLER HEIGHTS RD | 52 |
| VAUGHN AVE | 44 |
| GOLDEN KEY ST | 34 |
| CALISTOGA DR | 32 |
| MARTINGALE RD | 32 |
| NIELSON ST | 32 |
| ARIZONA AVE | 30 |
| CIVIC CENTER DR | 30 |
| MARKET ST | 30 |
| HOUSTON AVE | 28 |
| JASPER DR | 28 |
| Other | 795 |
2005 - 2018 National Fire Incident Reporting System (NFIRS) incidents
- Incident types reported to NFIRS in Gilbert, AZ
- 45,92666.7%Rescue & EMS
- 7,18010.4%Good Intent Call
- 5,8758.5%Service Call
- 3,9225.7%False Alarm
- 3,3774.9%Fire
- 2,5103.6%Hazardous Condition
- Fire incident types reported to NFIRS in Gilbert, AZ
- 1,62548.1%Outside Fires
- 1,07231.7%Structure Fires
- 51715.3%Mobile Property/Vehicle Fires
- 1634.8%Other
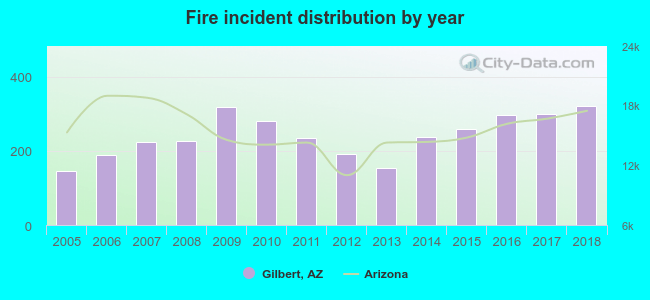 Based on the data from the years 2005 - 2018 the average number of fires per year is 241. The highest number of fire incidents - 322 took place in 2018, and the least - 146 in 2005. The data has a growing trend.
The average number of yearly fire incidents per 10k residents in Gilbert, AZ compared to nearest cities:
(Note: Based on data for the last 3 years, including only cities with population 5,000 and above)
| Gilbert: | 12.8 |
| Mesa: | 21.6 |
| Chandler: | 16.6 |
| Queen Creek: | 21.4 |
| Tempe: | 29.2 |
| Sun Lakes: | 19.1 |
| Salt River: | 1.1 |
| Guadalupe: | 9.3 |
| Apache Junction: | 8.3 |
 The median response time based on all reported fire incidents is 5 minutes. This is about the same as the state median value.
The median response time in Gilbert, AZ compared to nearest cities:
(Note: Based on data for all years, including only cities with at least 500 fire incidents)
| Gilbert: | 5 minutes |
| Mesa: | 5 minutes |
| Chandler: | 5 minutes |
| Queen Creek: | 6 minutes |
| Tempe: | 4 minutes |
| Apache Junction: | 6 minutes |
| Scottsdale: | 5 minutes |
| Phoenix: | 4 minutes |
| Coolidge: | 6 minutes |
 According to the data from the years 2005 - 2018 the average number of fire-related yearly casualties is 1. The highest number of reported injuries - 6 took place in 2018, and the lowest - 0 in 2006. The data has a rising trend.
The average number of casualties per 1,000 fires is 5. This indicator was the highest - 19 in 2018, and the lowest 0 in 2006. The trend for casualties per 1,000 fires is increasing. Compared to the state value the number of casualties per 1,000 fire incidents is similar.
According to the data from the years 2005 - 2018 the average number of fire-related yearly casualties is 1. The highest number of reported injuries - 6 took place in 2018, and the lowest - 0 in 2006. The data has a rising trend.
The average number of casualties per 1,000 fires is 5. This indicator was the highest - 19 in 2018, and the lowest 0 in 2006. The trend for casualties per 1,000 fires is increasing. Compared to the state value the number of casualties per 1,000 fire incidents is similar.Casualties per 1,000 incidents in Gilbert, AZ compared to nearest cities:
(Note: Based on data for all years, including only cities with at least 500 fire incidents)
| Gilbert: | 5.0 |
| Mesa: | 15.7 |
| Chandler: | 1.8 |
| Queen Creek: | 1.5 |
| Tempe: | 8.7 |
| Apache Junction: | 25.6 |
| Scottsdale: | 2.6 |
| Phoenix: | 0.0 |
| Coolidge: | 5.1 |
 29.5% incidents where reported in the morning and 70.5% in the evening. The most fires (15.7%) took place on Saturday, and the least (13.8%) on Monday.
 Based on the 3,377 reports from years 2005 - 2018 most fires (10.8%) took place during July, and the least (6.5%) in February.
 Out of all 68,854 cases reported during the years 2005 - 2018, the most belonged to the categories: Rescue & EMS (66.7%), Good Intent Call (10.4%), and Service Call (8.5%).
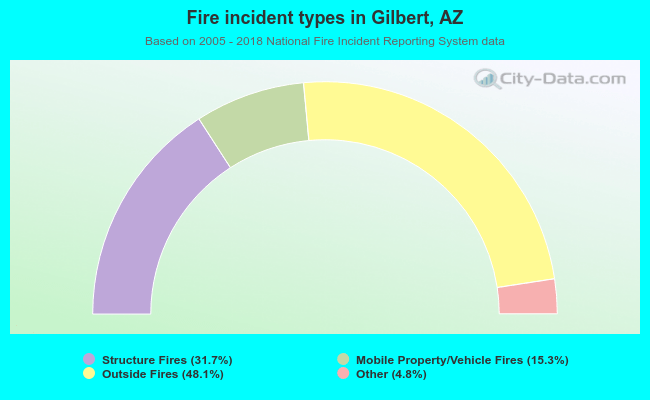 When looking into fire subcategories, the most reports belonged to: Outside Fires (48.1%), and Structure Fires (31.7%).