Edgewater: Fire Incidents, Maryland (MD)
Where are fire incidents reported in Edgewater, MD
Something went wrong! Please refresh the page.
|
| |||||||||||||||||||||||||||||||||||||||||||||||||||||||||||||||||||||||||||||||||||||||||||||||||||||||||||||
2008 - 2018 National Fire Incident Reporting System (NFIRS) incidents
- Incident types reported to NFIRS in Edgewater, MD
- 4,96359.0%Rescue & EMS
- 1,22214.5%Good Intent Call
- 8069.6%Hazardous Condition
- 4965.9%Service Call
- 4915.8%Fire
- 4114.9%False Alarm
- 170.2%Special Incident
- Fire incident types reported to NFIRS in Edgewater, MD
- 23848.5%Structure Fires
- 15130.8%Outside Fires
- 9218.7%Mobile Property/Vehicle Fires
- 102.0%Other
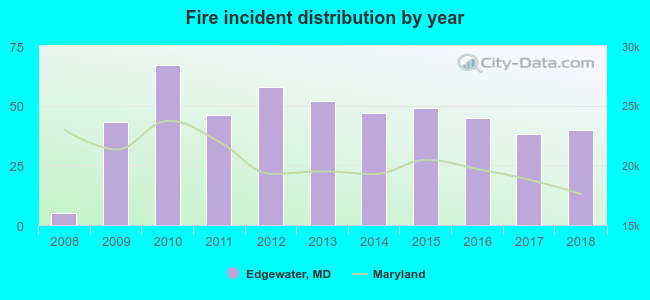 According to the data from the years 2008 - 2018 the average number of fire incidents per year is 45. The highest number of reported fires - 67 took place in 2010, and the least - 5 in 2008. The data has a growing trend.
The average number of yearly fire incidents per 10k residents in Edgewater, MD compared to nearest cities:
(Note: Based on data for the last 3 years, including only cities with population 5,000 and above)
| Edgewater: | 45.4 |
| Annapolis: | 64.3 |
| Mayo: | 1.2 |
| Arnold: | 13.8 |
| Crofton: | 14.3 |
| Shady Side: | 6.9 |
| Severna Park: | 10.5 |
| Bowie: | 7.9 |
| Lake Shore: | 0.5 |
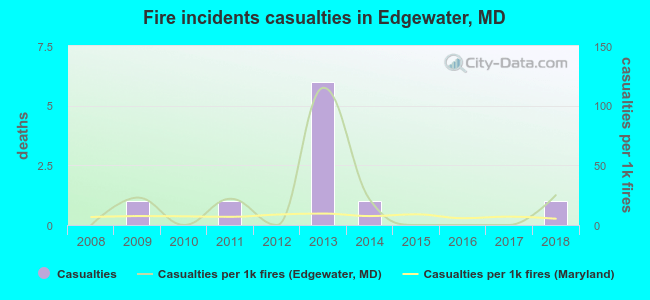 Based on the data from the years 2008 - 2018 the average number of fire-related casualties per year is 1. The highest number of reported injuries - 6 took place in 2013, and the lowest - 0 in 2008. The data has a growing trend.
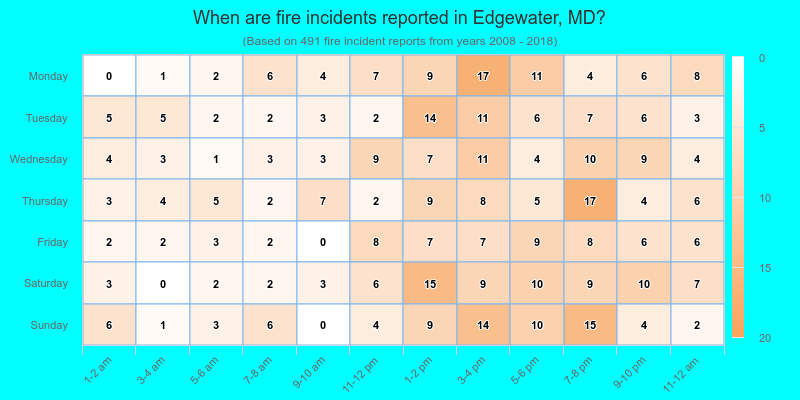
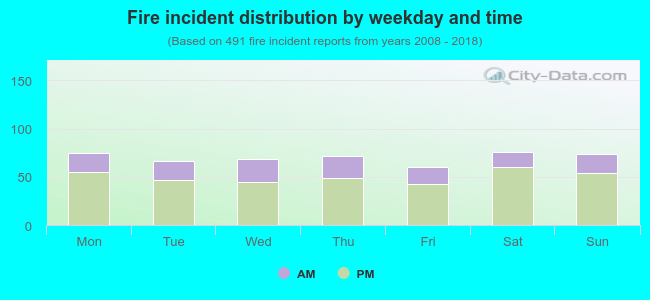 28.1% incidents where reported in the morning and 71.9% in the evening. The most fires (15.5%) took place on Saturday, and the least (12.2%) on Friday.
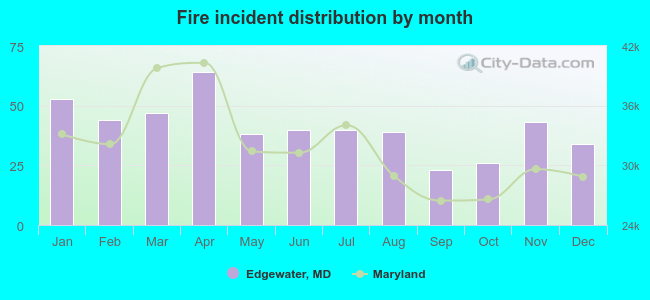 Based on the 491 fire incidents from years 2008 - 2018 most fires (13.0%) took place during April, and the least (4.7%) in September.
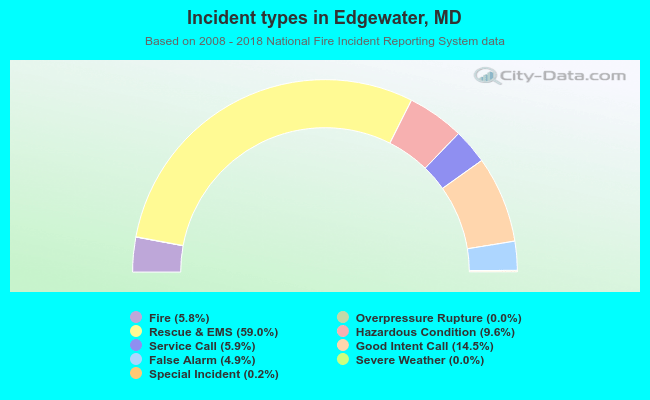 Out of all 8,412 cases reported during the years 2008 - 2018, the most belonged to the categories: Rescue & EMS (59.0%), Good Intent Call (14.5%), and Hazardous Condition (9.6%).
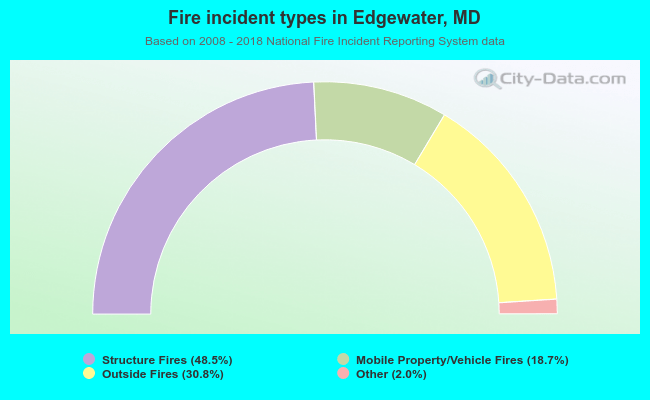 When looking into fire subcategories, the most incidents belonged to: Structure Fires (48.5%), and Outside Fires (30.8%).