Covington: Fire Incidents, Tennessee (TN)
Where are fire incidents reported in Covington, TN
Something went wrong! Please refresh the page.
| Fire incidents reported | |
|---|---|
| Sreet name | Count |
| 51 HWY | 358 |
| SIMONTON ST | 96 |
| COLLEGE ST | 88 |
| PEELER RD | 88 |
| 59 HWY | 86 |
| HOLLY GROVE RD | 70 |
| LIBERTY AVE | 62 |
| MT CARMEL RD | 62 |
| 179 HWY | 54 |
| WOOTEN ST | 50 |
| MAIN ST | 48 |
| MAPLE ST | 46 |
| TIPTON ST | 46 |
| 54 HWY | 44 |
| BUCKSNORT RD | 42 |
| HAYNIE ST | 32 |
| MT LEBANON RD | 32 |
| RIALTO RD | 32 |
| TATLOCK AVE | 32 |
| MELROSE RD | 28 |
| MUELLER BRASS RD | 28 |
| VILLAGE RD | 28 |
| BRIDE RD | 26 |
| HWY 179 HWY | 26 |
| PLEASANT AVE | 26 |
| WORTHAM DR | 26 |
| MORRIS RD | 24 |
| RAY LANE | 24 |
| SHILOH RD | 24 |
| WALTON LOOP | 24 |
| Other | 171 |
2002 - 2018 National Fire Incident Reporting System (NFIRS) incidents
- Incident types reported to NFIRS in Covington, TN
- 8,05366.5%Rescue & EMS
- 1,82315.1%Fire
- 6655.5%Good Intent Call
- 6315.2%Hazardous Condition
- 4633.8%False Alarm
- 4353.6%Service Call
- 150.1%Overpressure Rupture
- Fire incident types reported to NFIRS in Covington, TN
- 76942.2%Structure Fires
- 61533.7%Outside Fires
- 38721.2%Mobile Property/Vehicle Fires
- 522.9%Other
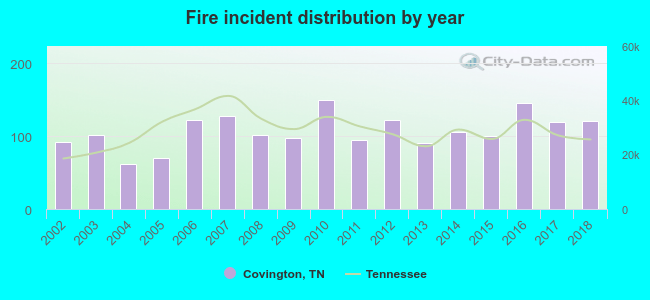 According to the data from the years 2002 - 2018 the average number of fire incidents per year is 107. The highest number of reported fires - 149 took place in 2010, and the least - 62 in 2004. The data has an increasing trend.
The average number of yearly fire incidents per 10k residents in Covington, TN compared to nearest cities:
(Note: Based on data for the last 3 years, including only cities with population 5,000 and above)
| Covington: | 142.4 |
| Atoka: | 78.0 |
| Munford: | 50.1 |
| Ripley: | 126.4 |
| Arlington: | 86.2 |
| Drummonds: | 38.0 |
| Millington: | 173.9 |
| Brownsville: | 118.3 |
| Lakeland: | 21.0 |
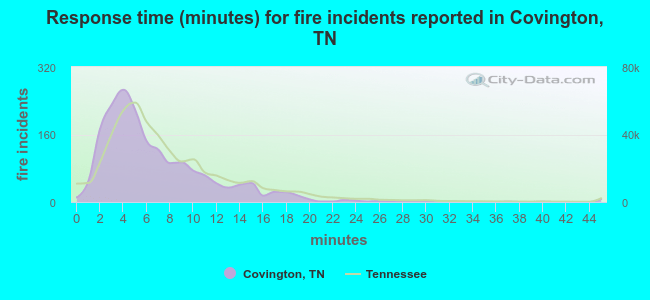 The median response time based on all reported fire incidents is 5 minutes. This is lower than the Tennessee median value.
The median response time in Covington, TN compared to nearest cities:
(Note: Based on data for all years, including only cities with at least 500 fire incidents)
| Covington: | 5 minutes |
| Brighton: | 9 minutes |
| Burlison: | 14 minutes |
| Atoka: | 7 minutes |
| Munford: | 5 minutes |
| Ripley: | 6 minutes |
| Arlington: | 6 minutes |
| Osceola: | 3 minutes |
| Millington: | 6 minutes |
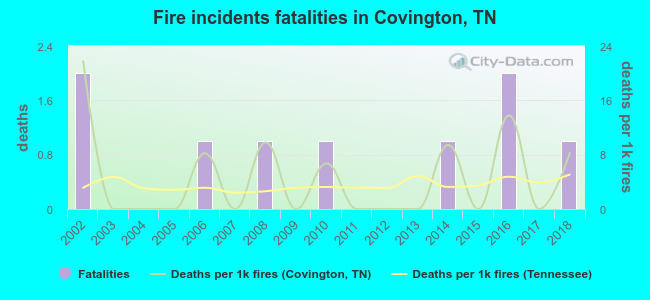 Based on the reports from the years 2002 - 2018 the average number of fire-related yearly deaths is 1. The highest number of deaths - 2 took place in 2002, and the lowest - 0 in 2003. The data has a decreasing trend.
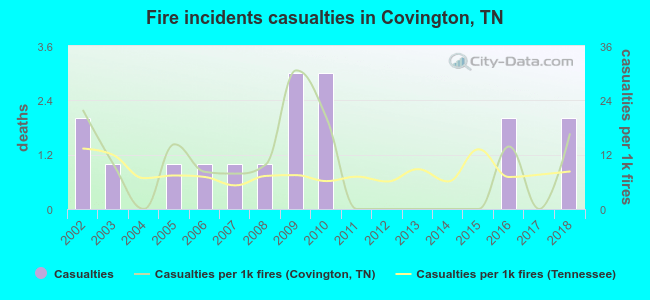 According to the reports from the years 2002 - 2018 the average number of fire-related yearly casualties is 1. The highest number of reported casualties - 3 took place in 2009, and the lowest - 0 in 2004. The data has a constant trend.
The average number of injuries per 1,000 fire incidents is 9. This indicator was the highest - 31 in 2009, and the lowest 0 in 2004. The trend for casualties per 1,000 incidents is decreasing. Compared to the Tennessee value the number of injuries per 1,000 fire incidents is higher.
According to the reports from the years 2002 - 2018 the average number of fire-related yearly casualties is 1. The highest number of reported casualties - 3 took place in 2009, and the lowest - 0 in 2004. The data has a constant trend.
The average number of injuries per 1,000 fire incidents is 9. This indicator was the highest - 31 in 2009, and the lowest 0 in 2004. The trend for casualties per 1,000 incidents is decreasing. Compared to the Tennessee value the number of injuries per 1,000 fire incidents is higher.
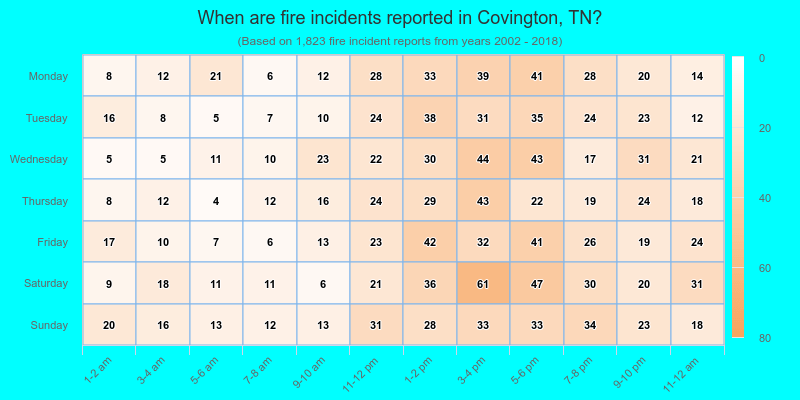
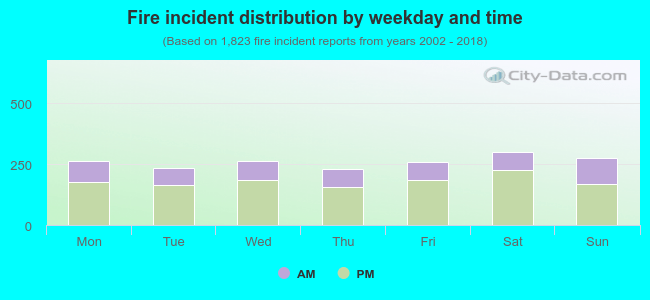 31.0% incidents where reported in the morning and 69.0% in the evening. The most fires (16.5%) took place on Saturday, and the least (12.7%) on Thursday.
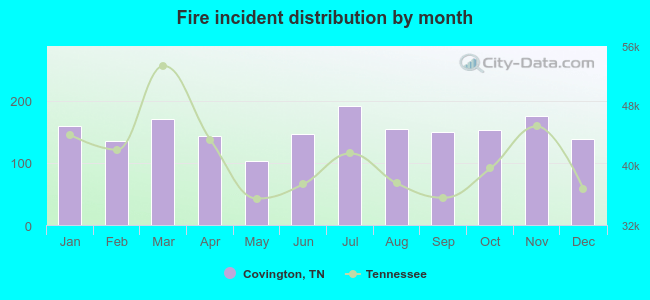 According to the 1,823 fire incidents from years 2002 - 2018 most fires (10.5%) took place during July, and the least (5.7%) in May.
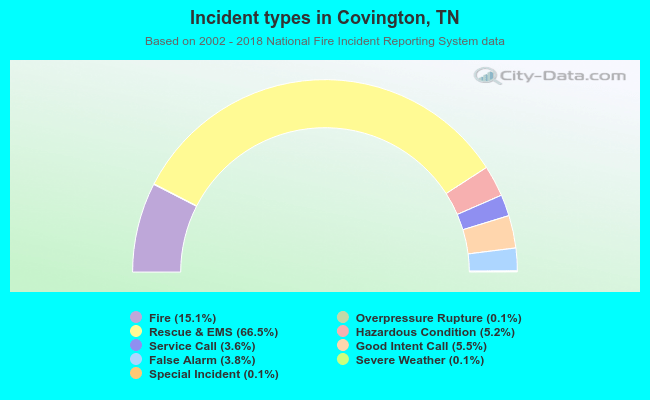 Out of all 12,103 cases reported during the years 2002 - 2018, the most belonged to the categories: Rescue & EMS (66.5%), Fire (15.1%), and Good Intent Call (5.5%).
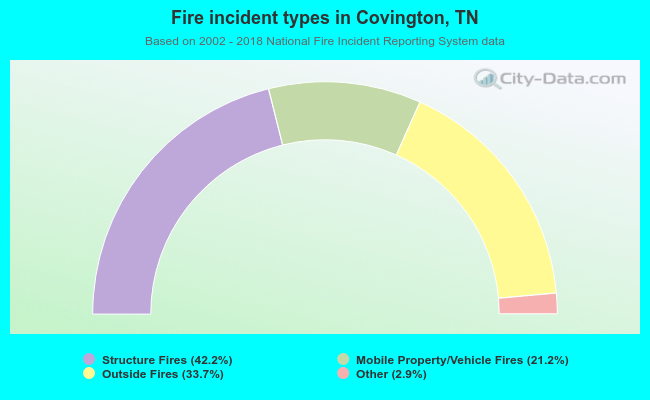 When looking into fire subcategories, the most reports belonged to: Structure Fires (42.2%), and Outside Fires (33.7%).