Colesville: Fire Incidents, Maryland (MD)
Where are fire incidents reported in Colesville, MD
Something went wrong! Please refresh the page.
|
| |||||||||||||||||||||||||||||||||||||||||||||||||||||||||||||||||||||||||||||||||||||||||||||||||||||||||||||
2004 - 2016 National Fire Incident Reporting System (NFIRS) incidents
- Incident types reported to NFIRS in Colesville, MD
- 4,07275.5%Rescue & EMS
- 55310.3%Good Intent Call
- 2364.4%Service Call
- 2244.2%Hazardous Condition
- 1933.6%False Alarm
- 1011.9%Fire
- 110.2%Special Incident
- Fire incident types reported to NFIRS in Colesville, MD
- 5655.4%Structure Fires
- 2322.8%Outside Fires
- 2221.8%Mobile Property/Vehicle Fires
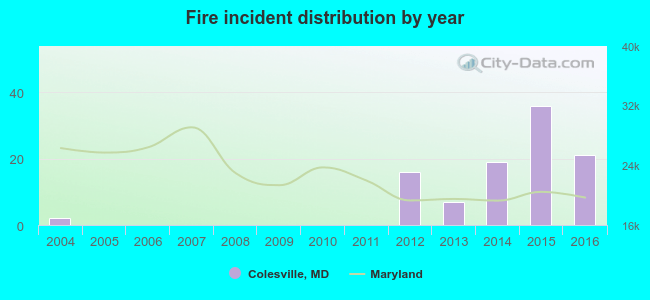 Based on the data from the years 2004 - 2016 the average number of fires per year is 8. The highest number of reported fire incidents - 36 took place in 2015, and the least - 0 in 2005. The data has a growing trend.
The average number of yearly fire incidents per 10k residents in Colesville, MD compared to nearest cities:
(Note: Based on data for the last 3 years, including only cities with population 5,000 and above)
| Colesville: | 14.3 |
| Burtonsville: | 30.0 |
| Silver Spring: | 44.6 |
| Beltsville: | 17.5 |
| Adelphi: | 1.1 |
| Olney: | 6.5 |
| North Bethesda: | 2.2 |
| Takoma Park: | 14.0 |
| College Park: | 2.5 |

 24.8% incidents where reported in the morning and 75.2% in the evening. The most fires (23.8%) took place on Thursday, and the least (5.9%) on Wednesday.
 According to the 101 reports from years 2004 - 2016 most fires (14.9%) took place during September, and the least (1.0%) in April.
 Out of all 5,394 cases reported during the years 2004 - 2016, the most belonged to the categories: Rescue & EMS (75.5%), Good Intent Call (10.3%), and Service Call (4.4%).
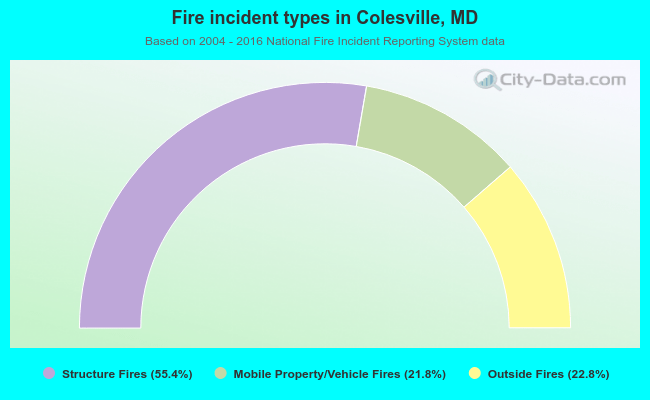 When looking into fire subcategories, the most incidents belonged to: Structure Fires (55.4%), and Outside Fires (22.8%).