Clovis: Fire Incidents, New Mexico (NM)
Where are fire incidents reported in Clovis, NM
Something went wrong! Please refresh the page.
| Fire incidents reported | |
|---|---|
| Sreet name | Count |
| PRINCE | 270 |
| 7TH ST | 114 |
| WALLACE | 102 |
| 21ST ST | 92 |
| SHELDON | 90 |
| BRADY | 86 |
| GIDDING | 82 |
| PRINCE ST | 80 |
| ROSS | 78 |
| EDWARDS | 72 |
| MLK | 72 |
| THORNTON | 72 |
| LEA | 70 |
| AXTELL | 62 |
| CAMEO | 62 |
| MAIN | 58 |
| MITCHELL ST | 58 |
| CHAPPARAL AVE | 56 |
| GRAND | 56 |
| SYCAMORE | 54 |
| HULL | 52 |
| 14TH ST | 50 |
| 10TH ST | 48 |
| BRADY ST | 48 |
| DAVIS | 48 |
| OAK | 42 |
| MABRY DR. | 40 |
| 9TH ST | 38 |
| MAPLE | 38 |
| 2ND ST | 36 |
| Other | 1,159 |
2002 - 2018 National Fire Incident Reporting System (NFIRS) incidents
- Incident types reported to NFIRS in Clovis, NM
- 3,28562.0%Fire
- 94717.9%Hazardous Condition
- 54010.2%False Alarm
- 2735.1%Service Call
- 1412.7%Good Intent Call
- 511.0%Special Incident
- 350.7%Rescue & EMS
- 230.4%Overpressure Rupture
- 60.1%Severe Weather
- Fire incident types reported to NFIRS in Clovis, NM
- 1,85756.5%Outside Fires
- 62819.1%Structure Fires
- 51015.5%Other
- 2908.8%Mobile Property/Vehicle Fires
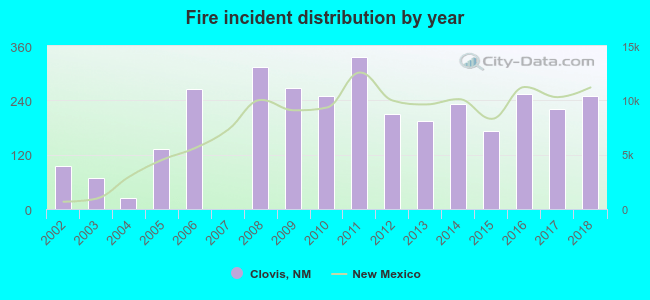 According to the data from the years 2002 - 2018 the average number of fires per year is 193. The highest number of reported fires - 336 took place in 2011, and the least - 1 in 2007. The data has a growing trend.
 The median response time based on all reported fire incidents is 5 minutes. This is lower compared to the state median value.
 Based on the data from the years 2002 - 2018 the average number of fire-related fatalities per year is 0. The highest number of deaths - 3 took place in 2017, and the lowest - 0 in 2002. The data has a constant trend.
The average number of fatalities per 1,000 fire incidents is 2. This indicator was the highest - 14 in 2017, and the lowest 0 in 2002. The trend for deaths per 1,000 fires is constant. Compared to the state value the number of deaths per 1,000 fire incidents is higher.
Based on the data from the years 2002 - 2018 the average number of fire-related fatalities per year is 0. The highest number of deaths - 3 took place in 2017, and the lowest - 0 in 2002. The data has a constant trend.
The average number of fatalities per 1,000 fire incidents is 2. This indicator was the highest - 14 in 2017, and the lowest 0 in 2002. The trend for deaths per 1,000 fires is constant. Compared to the state value the number of deaths per 1,000 fire incidents is higher.Deaths per 1,000 incidents in Clovis, NM compared to nearest cities:
(Note: Based on data for all years, including only cities with at least 2,500 fire incidents)
| Clovis: | 2.1 |
 According to the reports from the years 2002 - 2018 the average number of fire-related yearly casualties is 1. The highest number of injuries - 4 took place in 2010, and the lowest - 0 in 2003. The data has a dropping trend.
The average number of injuries per 1,000 fires is 8. This indicator was the highest - 83 in 2004, and the lowest 0 in 2003. The trend for casualties per 1,000 incidents is decreasing. Compared to the state value the number of injuries per 1,000 fire incidents is higher.
According to the reports from the years 2002 - 2018 the average number of fire-related yearly casualties is 1. The highest number of injuries - 4 took place in 2010, and the lowest - 0 in 2003. The data has a dropping trend.
The average number of injuries per 1,000 fires is 8. This indicator was the highest - 83 in 2004, and the lowest 0 in 2003. The trend for casualties per 1,000 incidents is decreasing. Compared to the state value the number of injuries per 1,000 fire incidents is higher.
 31.1% incidents where reported in the morning and 68.9% in the evening. The most fires (15.8%) took place on Monday, and the least (12.7%) on Tuesday.
 According to the 3,285 incident reports from years 2002 - 2018 most fires (11.2%) took place during July, and the least (5.8%) in August.
 Out of all 5,301 cases reported during the years 2002 - 2018, the most belonged to the categories: Fire (62.0%), Hazardous Condition (17.9%), and False Alarm (10.2%).
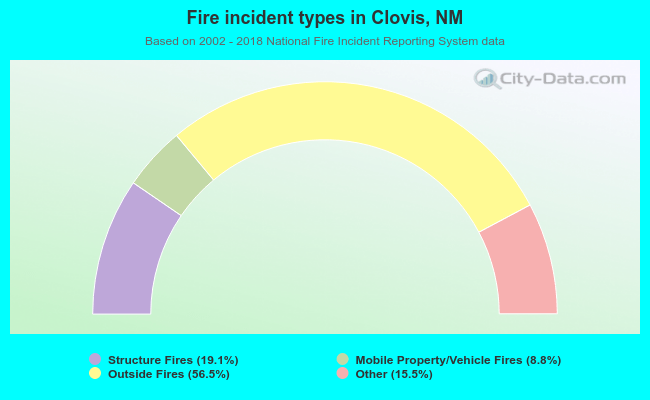 When looking into fire subcategories, the most reports belonged to: Outside Fires (56.5%), and Structure Fires (19.1%).