Charlottesville: Fire Incidents, Virginia (VA)
Where are fire incidents reported in Charlottesville, VA
Something went wrong! Please refresh the page.
| Fire incidents reported | |
|---|---|
| Sreet name | Count |
| MAIN ST | 260 |
| EMMET ST | 244 |
| SEMINOLE TRL | 206 |
| JEFFERSON PARK | 174 |
| PROSPECT AVE | 160 |
| LEE ST | 156 |
| 1ST ST | 150 |
| RIDGE ST | 136 |
| 5TH ST | 124 |
| GARRETT ST | 122 |
| BARRACKS RD | 114 |
| 14TH ST | 104 |
| IVY RD | 102 |
| MARKET ST | 100 |
| PRESTON AVE | 100 |
| MCCORMICK RD | 98 |
| RUGBY RD | 98 |
| HYDRAULIC RD | 96 |
| RICHMOND RD | 96 |
| RIO RD | 86 |
| CHERRY AVE | 68 |
| 6TH ST | 64 |
| COMMONWEALTH DR | 64 |
| BRANDON AVE | 62 |
| OLD LYNCHBURG RD | 60 |
| SCOTTSVILLE RD | 60 |
| WERTLAND ST | 60 |
| 15TH ST | 58 |
| 2ND ST | 58 |
| WATER ST | 58 |
| Other | 2,224 |
2003 - 2018 National Fire Incident Reporting System (NFIRS) incidents
- Incident types reported to NFIRS in Charlottesville, VA
- 29,80051.2%Rescue & EMS
- 8,43314.5%Hazardous Condition
- 5,5629.6%Fire
- 5,5549.5%False Alarm
- 5,0498.7%Good Intent Call
- 3,6446.3%Service Call
- 680.1%Severe Weather
- Fire incident types reported to NFIRS in Charlottesville, VA
- 2,36042.4%Structure Fires
- 2,08637.5%Outside Fires
- 88816.0%Mobile Property/Vehicle Fires
- 2284.1%Other
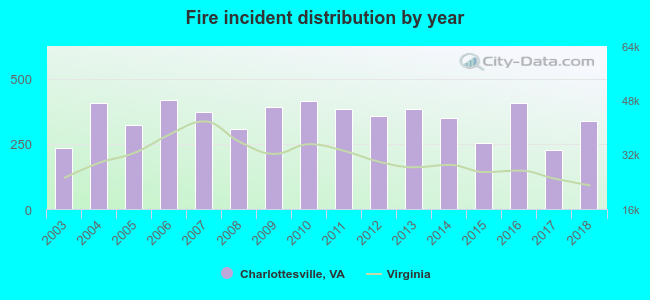 According to the data from the years 2003 - 2018 the average number of fires per year is 348. The highest number of reported fires - 417 took place in 2006, and the least - 225 in 2017. The data has a rising trend.
The average number of yearly fire incidents per 10k residents in Charlottesville, VA compared to nearest cities:
(Note: Based on data for the last 3 years, including only cities with population 5,000 and above)
| Charlottesville: | 70.8 |
| Crozet: | 24.0 |
| Waynesboro: | 53.7 |
| Fishersville: | 39.8 |
| Stuarts Draft: | 41.9 |
| Staunton: | 46.5 |
| Harrisonburg: | 17.0 |
| Bridgewater: | 29.7 |
| Culpeper: | 77.0 |
 The median response time based on all reported fire incidents is 5 minutes. This is lower than the state median value.
The median response time in Charlottesville, VA compared to nearest cities:
(Note: Based on data for all years, including only cities with at least 500 fire incidents)
| Charlottesville: | 5 minutes |
| Ruckersville: | 10 minutes |
| Waynesboro: | 7 minutes |
| Grottoes: | 9 minutes |
| Orange: | 9 minutes |
| Louisa: | 11 minutes |
| Fishersville: | 8 minutes |
| Elkton: | 10 minutes |
| Madison: | 6 minutes |
 Based on the data from the years 2003 - 2018 the average number of fire-related fatalities per year is 0. The highest number of reported deaths - 1 took place in 2007, and the lowest - 0 in 2003. The data has a constant trend.
The average number of deaths per 1,000 fires is 1. This indicator was the highest - 3 in 2008, and the lowest 0 in 2003. The trend for fatalities per 1,000 incidents is constant. Compared to the Virginia value the number of deaths per 1,000 fires is lower.
Based on the data from the years 2003 - 2018 the average number of fire-related fatalities per year is 0. The highest number of reported deaths - 1 took place in 2007, and the lowest - 0 in 2003. The data has a constant trend.
The average number of deaths per 1,000 fires is 1. This indicator was the highest - 3 in 2008, and the lowest 0 in 2003. The trend for fatalities per 1,000 incidents is constant. Compared to the Virginia value the number of deaths per 1,000 fires is lower.Deaths per 1,000 incidents in Charlottesville, VA compared to nearest cities:
(Note: Based on data for all years, including only cities with at least 2,500 fire incidents)
| Charlottesville: | 1.1 |
| Staunton: | 0.8 |
| Harrisonburg: | 2.0 |
 Based on the data from the years 2003 - 2018 the average number of fire-related yearly casualties is 5. The highest number of reported casualties - 12 took place in 2003, and the lowest - 1 in 2008. The data has a dropping trend.
The average number of casualties per 1,000 fires is 15. This indicator was the highest - 51 in 2003, and the lowest 3 in 2008. The trend for casualties per 1,000 fires is decreasing. Compared to the Virginia value the number of casualties per 1,000 incidents is similar.
Based on the data from the years 2003 - 2018 the average number of fire-related yearly casualties is 5. The highest number of reported casualties - 12 took place in 2003, and the lowest - 1 in 2008. The data has a dropping trend.
The average number of casualties per 1,000 fires is 15. This indicator was the highest - 51 in 2003, and the lowest 3 in 2008. The trend for casualties per 1,000 fires is decreasing. Compared to the Virginia value the number of casualties per 1,000 incidents is similar.Casualties per 1,000 incidents in Charlottesville, VA compared to nearest cities:
(Note: Based on data for all years, including only cities with at least 500 fire incidents)
| Charlottesville: | 15.1 |
| Ruckersville: | 0.0 |
| Waynesboro: | 18.3 |
| Grottoes: | 4.8 |
| Orange: | 14.7 |
| Louisa: | 0.0 |
| Fishersville: | 3.7 |
| Elkton: | 4.5 |
| Madison: | 0.0 |
 29.1% incidents where reported in the morning and 70.9% in the evening. The most fires (15.5%) took place on Sunday, and the least (12.5%) on Wednesday.
 According to the 5,562 fires from years 2003 - 2018 most fires (12.4%) took place during April, and the least (6.5%) in August.
 Out of all 58,189 cases reported during the years 2003 - 2018, the most belonged to the categories: Rescue & EMS (51.2%), Hazardous Condition (14.5%), and Fire (9.6%).
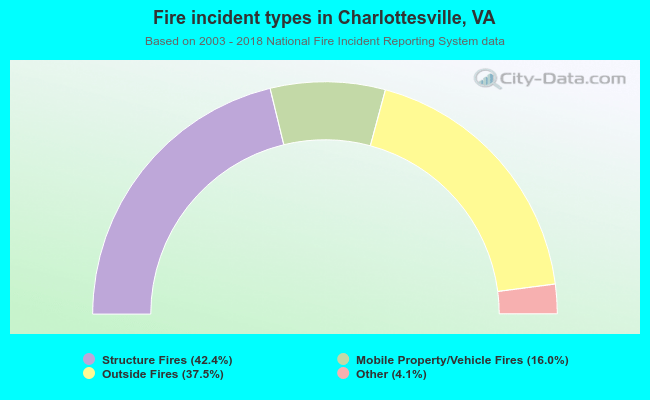 When looking into fire subcategories, the most reports belonged to: Structure Fires (42.4%), and Outside Fires (37.5%).