Charlestown: Fire Incidents, Indiana (IN)
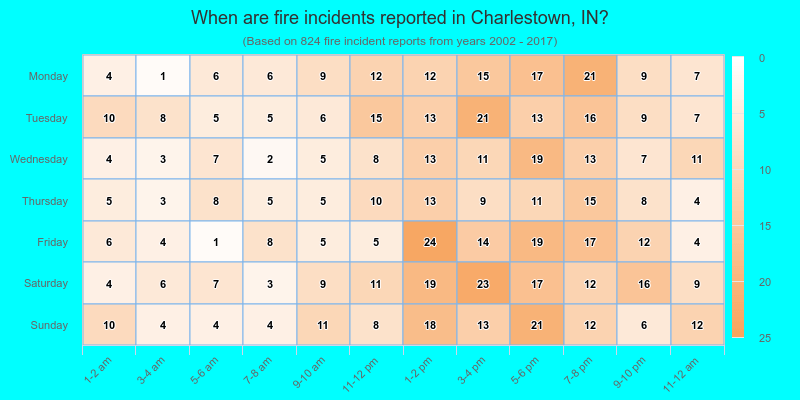
Where are fire incidents reported in Charlestown, IN
Something went wrong! Please refresh the page.
|
| |||||||||||||||||||||||||||||||||||||||||||||||||||||||||||||||||||||||||||||||||||||||||||||||||||||||||||||
| Other | 60 | |||||||||||||||||||||||||||||||||||||||||||||||||||||||||||||||||||||||||||||||||||||||||||||||||||||||||||||
2002 - 2017 National Fire Incident Reporting System (NFIRS) incidents
- Incident types reported to NFIRS in Charlestown, IN
- 1,07432.8%Hazardous Condition
- 82425.1%Fire
- 66220.2%Rescue & EMS
- 3179.7%Good Intent Call
- 1935.9%Service Call
- 1765.4%False Alarm
- 160.5%Special Incident
- 140.4%Severe Weather
- Fire incident types reported to NFIRS in Charlestown, IN
- 32038.8%Outside Fires
- 28134.1%Structure Fires
- 12415.0%Mobile Property/Vehicle Fires
- 9912.0%Other
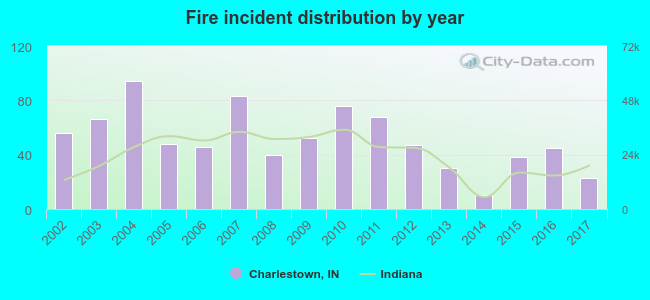 According to the data from the years 2002 - 2017 the average number of fire incidents per year is 51. The highest number of reported fires - 94 took place in 2004, and the least - 10 in 2014. The data has a dropping trend.
The average number of yearly fire incidents per 10k residents in Charlestown, IN compared to nearest cities:
(Note: Based on data for the last 3 years, including only cities with population 5,000 and above)
| Charlestown: | 29.0 |
| Sellersburg: | 36.8 |
| Clarksville: | 2.3 |
| Jeffersonville: | 15.8 |
| New Albany: | 19.7 |
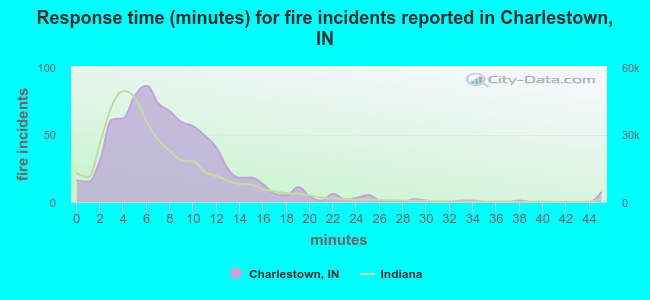 The median response time based on all reported fire incidents is 7 minutes. This is comparable to the state median value.
The median response time in Charlestown, IN compared to nearest cities:
(Note: Based on data for all years, including only cities with at least 500 fire incidents)
| Charlestown: | 7 minutes |
| Sellersburg: | 6 minutes |
| Clarksville: | 4 minutes |
| Jeffersonville: | 4 minutes |
| New Albany: | 4 minutes |
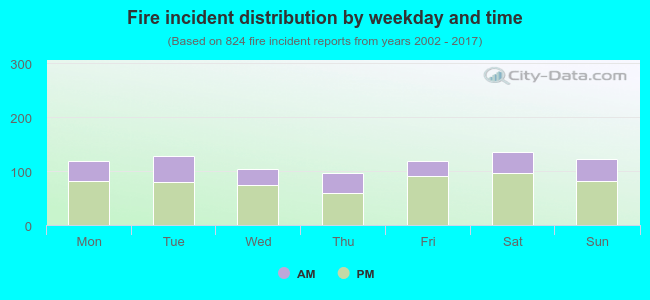 31.8% incidents where reported in the morning and 68.2% in the evening. The most fires (16.5%) took place on Saturday, and the least (11.7%) on Thursday.
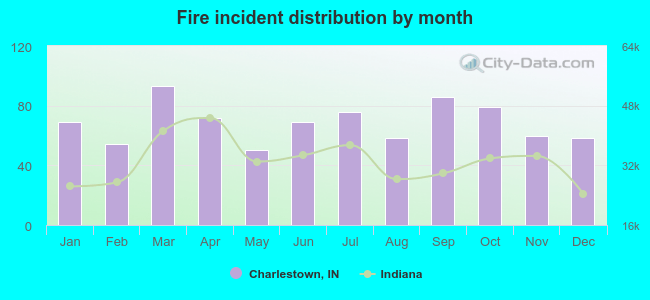 Based on the 824 incident reports from years 2002 - 2017 most fires (11.3%) took place during March, and the least (6.1%) in May.
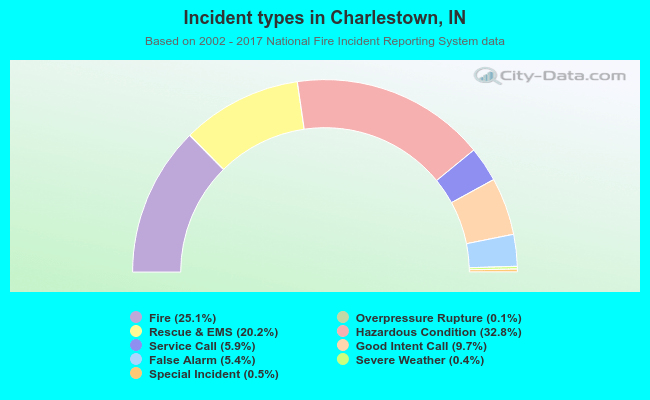 Out of all 3,279 cases reported during the years 2002 - 2017, the most belonged to the categories: Hazardous Condition (32.8%), Fire (25.1%), and Rescue & EMS (20.2%).
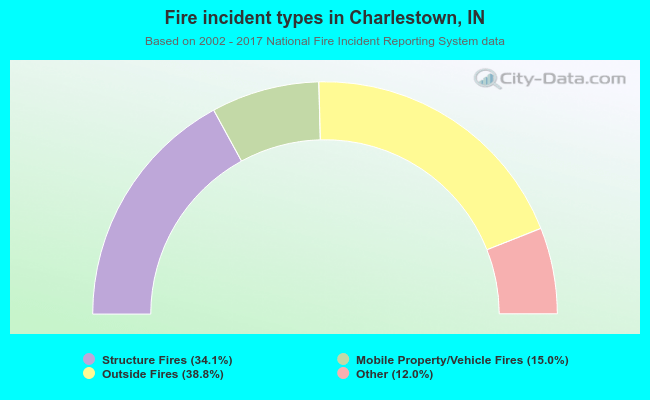 When looking into fire subcategories, the most incidents belonged to: Outside Fires (38.8%), and Structure Fires (34.1%).