Carroll: Fire Incidents, Iowa (IA)
Where are fire incidents reported in Carroll, IA
Something went wrong! Please refresh the page.
|
| |||||||||||||||||||||||||||||||||||||||||||||||||||||||||||||||||||||||||||||||||||||||||||||||||||||||||||||
2002 - 2018 National Fire Incident Reporting System (NFIRS) incidents
- Incident types reported to NFIRS in Carroll, IA
- 45554.2%Fire
- 10712.7%Hazardous Condition
- 9211.0%Good Intent Call
- 769.0%Rescue & EMS
- 708.3%False Alarm
- 364.3%Service Call
- 20.2%Overpressure Rupture
- 10.1%Severe Weather
- 10.1%Special Incident
- Fire incident types reported to NFIRS in Carroll, IA
- 18841.3%Outside Fires
- 16937.1%Structure Fires
- 9019.8%Mobile Property/Vehicle Fires
- 81.8%Other
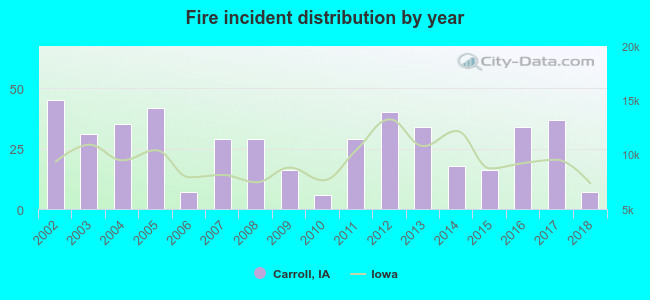 Based on the data from the years 2002 - 2018 the average number of fire incidents per year is 27. The highest number of reported fire incidents - 45 took place in 2002, and the least - 6 in 2010. The data has a declining trend.
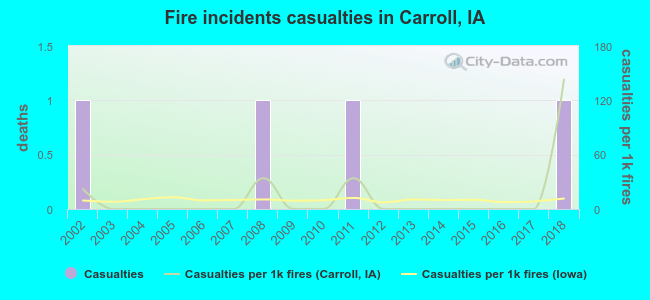 According to the reports from the years 2002 - 2018 the average number of fire-related casualties per year is 0. The highest number of casualties - 1 took place in 2002, and the lowest - 0 in 2003. The data has a constant trend.
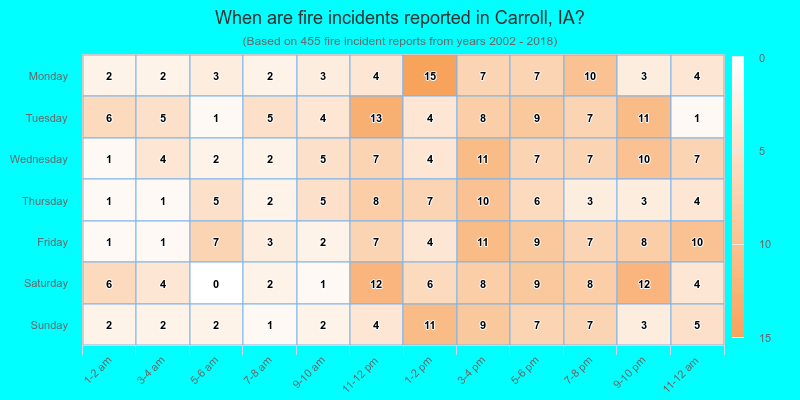
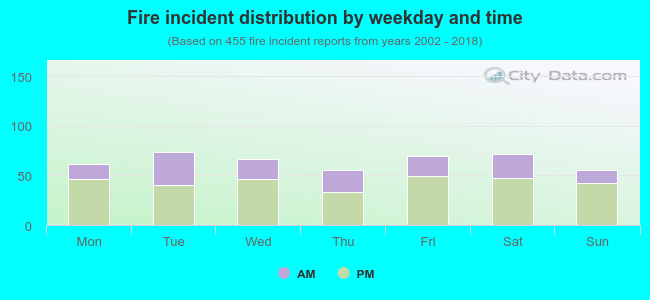 33.4% incidents where reported in the morning and 66.6% in the evening. The most fires (16.3%) took place on Tuesday, and the least (12.1%) on Thursday.
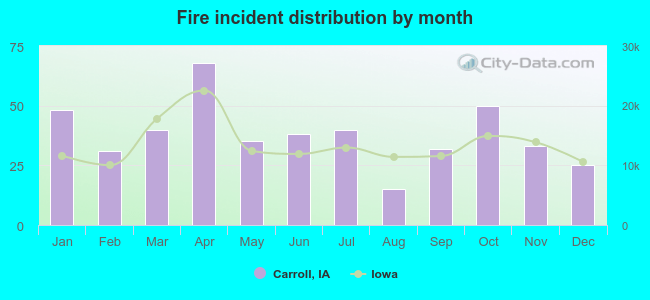 Based on the 455 reports from years 2002 - 2018 most fires (14.9%) took place during April, and the least (3.3%) in August.
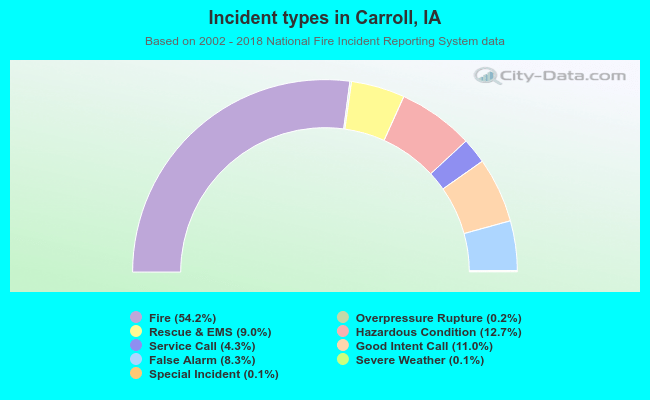 Out of all 840 cases reported during the years 2002 - 2018, the most belonged to the categories: Fire (54.2%), Hazardous Condition (12.7%), and Good Intent Call (11.0%).
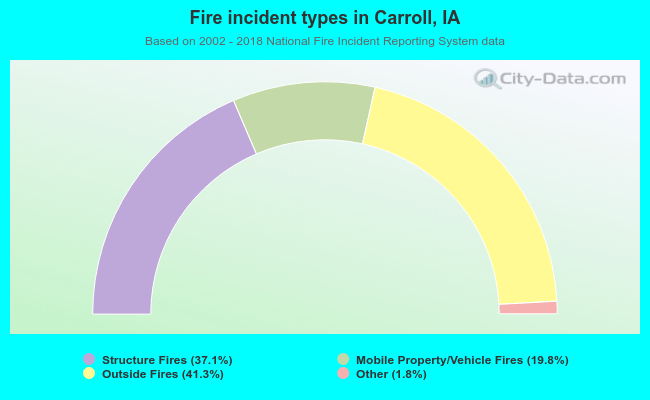 When looking into fire subcategories, the most incidents belonged to: Outside Fires (41.3%), and Structure Fires (37.1%).