Brownsburg: Fire Incidents, Indiana (IN)
Where are fire incidents reported in Brownsburg, IN
Something went wrong! Please refresh the page.
| Fire incidents reported | |
|---|---|
| Sreet name | Count |
| GREEN ST | 174 |
| NORTHFIELD DR | 160 |
| MAIN ST | 98 |
| SR 267 | 84 |
| US 136 | 74 |
| CR 1000 E | 50 |
| CR 650 E | 40 |
| CR 900 E | 38 |
| CR 1000 N | 34 |
| I-74 EASTBOUND | 32 |
| CR 600 N | 30 |
| JEFFERSON ST | 30 |
| COLLEGE AVE | 28 |
| CR 700 N | 28 |
| HORNADAY RD | 28 |
| MAPLEHURST DR | 28 |
| ODELL ST | 28 |
| RACEWAY RD | 28 |
| CR 300 N | 26 |
| ENDERLY AVE | 26 |
| CR 350 N | 24 |
| TILDEN RD | 24 |
| CR 400 N | 22 |
| CR 600 E | 22 |
| 1000 NORTH | 20 |
| CR 1025 E | 20 |
| CR 500 E | 20 |
| MALONEY RD | 20 |
| CR 900 N | 18 |
| WINDHAVEN CIR | 18 |
| Other | 283 |
2002 - 2017 National Fire Incident Reporting System (NFIRS) incidents
- Incident types reported to NFIRS in Brownsburg, IN
- 8,01960.5%Rescue & EMS
- 1,55511.7%Fire
- 1,1748.9%Good Intent Call
- 1,0588.0%Hazardous Condition
- 7735.8%False Alarm
- 6024.5%Service Call
- 280.2%Overpressure Rupture
- 250.2%Severe Weather
- 230.2%Special Incident
- Fire incident types reported to NFIRS in Brownsburg, IN
- 65342.0%Outside Fires
- 64441.4%Structure Fires
- 19312.4%Mobile Property/Vehicle Fires
- 654.2%Other
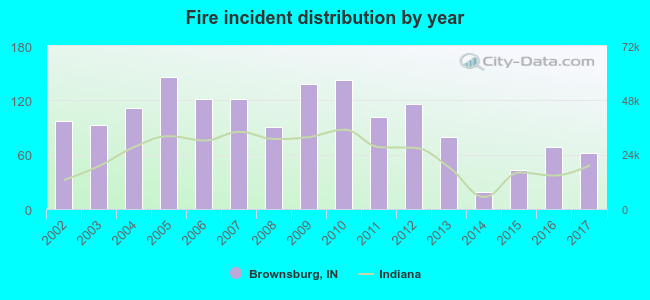 Based on the data from the years 2002 - 2017 the average number of fires per year is 97. The highest number of fire incidents - 146 took place in 2005, and the least - 19 in 2014. The data has a declining trend.
The average number of yearly fire incidents per 10k residents in Brownsburg, IN compared to nearest cities:
(Note: Based on data for the last 3 years, including only cities with population 5,000 and above)
| Brownsburg: | 19.2 |
| Avon: | 44.2 |
| Speedway: | 40.2 |
| Danville: | 44.1 |
| Plainfield: | 9.8 |
| Zionsville: | 16.1 |
| Whitestown: | 40.6 |
| Indianapolis: | 5.2 |
| Lebanon: | 10.9 |
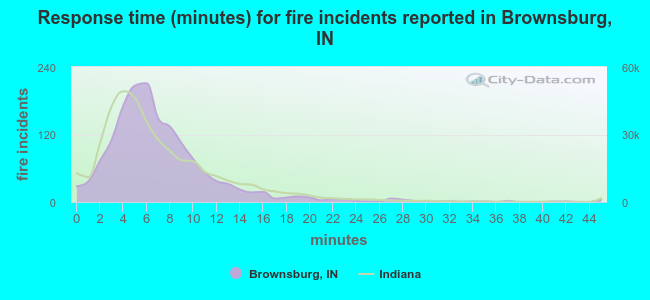 The median response time based on all reported fire incidents is 6 minutes. This is about the same as the Indiana median value.
The median response time in Brownsburg, IN compared to nearest cities:
(Note: Based on data for all years, including only cities with at least 500 fire incidents)
| Brownsburg: | 6 minutes |
| Avon: | 7 minutes |
| Danville: | 8 minutes |
| Plainfield: | 6 minutes |
| Zionsville: | 6 minutes |
| Clayton: | 10 minutes |
| Indianapolis: | 6 minutes |
| Lebanon: | 5 minutes |
| Mooresville: | 6 minutes |
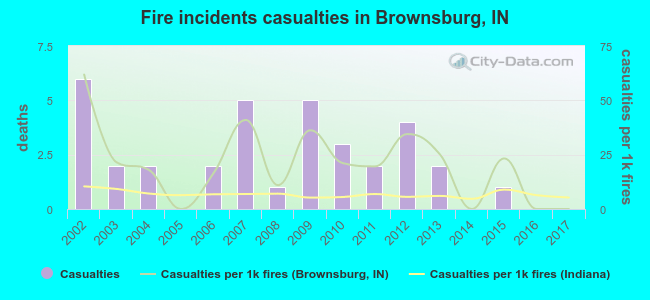 According to the reports from the years 2002 - 2017 the average number of fire-related yearly casualties is 2. The highest number of casualties - 6 took place in 2002, and the lowest - 0 in 2005. The data has a declining trend.
The average number of injuries per 1,000 fires is 21. This indicator was the highest - 62 in 2002, and the lowest 0 in 2005. The trend for casualties per 1,000 incidents is dropping. Compared to the Indiana value the number of casualties per 1,000 fire incidents is much higher.
According to the reports from the years 2002 - 2017 the average number of fire-related yearly casualties is 2. The highest number of casualties - 6 took place in 2002, and the lowest - 0 in 2005. The data has a declining trend.
The average number of injuries per 1,000 fires is 21. This indicator was the highest - 62 in 2002, and the lowest 0 in 2005. The trend for casualties per 1,000 incidents is dropping. Compared to the Indiana value the number of casualties per 1,000 fire incidents is much higher.Casualties per 1,000 incidents in Brownsburg, IN compared to nearest cities:
(Note: Based on data for all years, including only cities with at least 500 fire incidents)
| Brownsburg: | 22.5 |
| Avon: | 2.4 |
| Danville: | 0.9 |
| Plainfield: | 33.4 |
| Zionsville: | 0.9 |
| Clayton: | 2.4 |
| Indianapolis: | 4.7 |
| Lebanon: | 16.4 |
| Mooresville: | 11.7 |
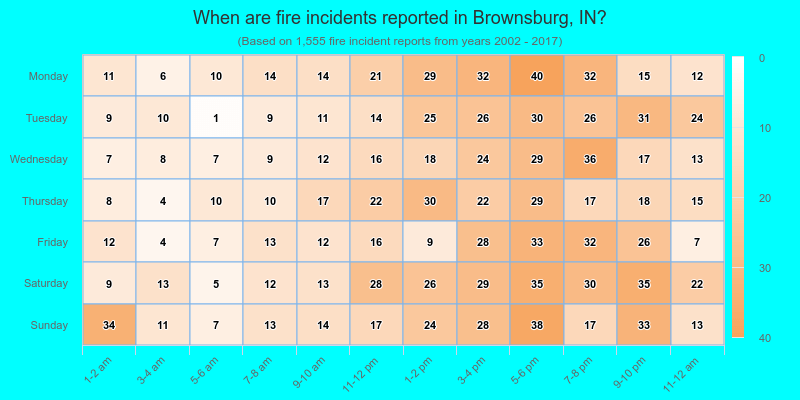
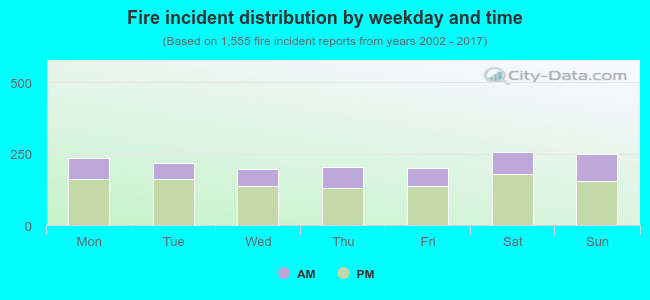 32.2% incidents where reported in the morning and 67.8% in the evening. The most fires (16.5%) took place on Saturday, and the least (12.6%) on Wednesday.
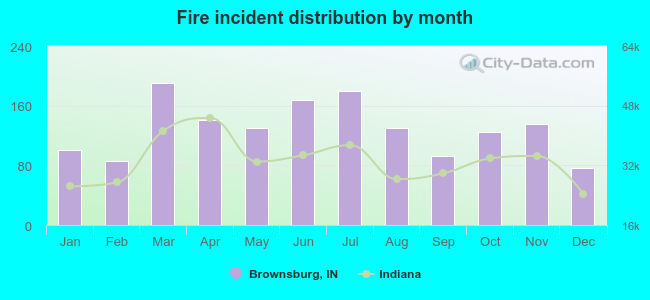 According to the 1,555 incident reports from years 2002 - 2017 most fires (12.2%) took place during March, and the least (5.0%) in December.
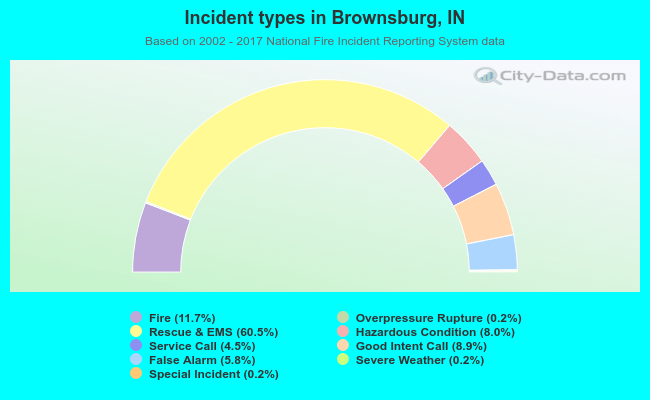 Out of all 13,257 cases reported during the years 2002 - 2017, the most belonged to the categories: Rescue & EMS (60.5%), Fire (11.7%), and Good Intent Call (8.9%).
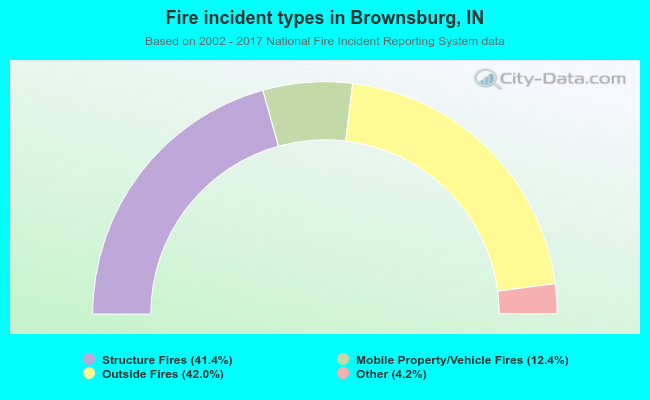 When looking into fire subcategories, the most reports belonged to: Outside Fires (42.0%), and Structure Fires (41.4%).