Auburn Hills: Fire Incidents, Michigan (MI)
Where are fire incidents reported in Auburn Hills, MI
Something went wrong! Please refresh the page.
| Fire incidents reported | |
|---|---|
| Sreet name | Count |
| OPDYKE RD | 162 |
| SQUIRREL RD | 128 |
| I75 | 112 |
| BALDWIN RD | 94 |
| UNIVERSITY | 66 |
| CHRYSLER DR | 54 |
| LAPEER RD | 54 |
| M59 | 52 |
| AUBURN RD | 46 |
| BROWN RD | 44 |
| SQUIRREL | 44 |
| FEATHERSTONE RD | 40 |
| WALTON BLVD | 40 |
| JOSLYN RD | 36 |
| ATLANTIC | 28 |
| BEACON HILL DR | 24 |
| BROOKSHEAR | 24 |
| SHIMMONS RD | 24 |
| I75 OFRP | 22 |
| TALL OAKS CT | 22 |
| KNOLLWOOD RD | 20 |
| PONTIAC RD | 20 |
| COLLIER RD | 18 |
| DAVISON AVE | 18 |
| HARMON RD | 18 |
| I75 COLL | 18 |
| OAKNOLL RD | 18 |
| TALL OAKS BLVD | 18 |
| BALD MOUNTAIN RD | 16 |
| MEADOW BROOK RD | 16 |
2002 - 2018 National Fire Incident Reporting System (NFIRS) incidents
- Incident types reported to NFIRS in Auburn Hills, MI
- 9,66858.7%Rescue & EMS
- 1,77510.8%Good Intent Call
- 1,3518.2%Service Call
- 1,3468.2%False Alarm
- 1,1697.1%Fire
- 1,1156.8%Hazardous Condition
- 390.2%Special Incident
- Fire incident types reported to NFIRS in Auburn Hills, MI
- 49242.1%Structure Fires
- 36931.6%Mobile Property/Vehicle Fires
- 25822.1%Outside Fires
- 504.3%Other
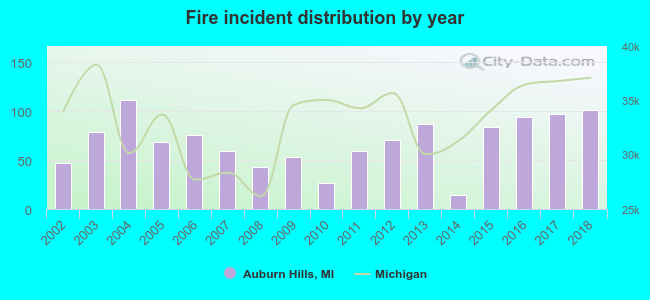 Based on the data from the years 2002 - 2018 the average number of fire incidents per year is 69. The highest number of reported fire incidents - 111 took place in 2004, and the least - 14 in 2014. The data has a rising trend.
The average number of yearly fire incidents per 10k residents in Auburn Hills, MI compared to nearest cities:
(Note: Based on data for the last 3 years, including only cities with population 5,000 and above)
| Auburn Hills: | 44.6 |
| Pontiac: | 46.2 |
| Rochester Hills: | 16.9 |
| Bloomfield Township: | 0.2 |
| Rochester: | 16.9 |
| Waterford: | 12.0 |
| Troy: | 21.2 |
| Birmingham: | 15.9 |
| Beverly Hills: | 23.9 |
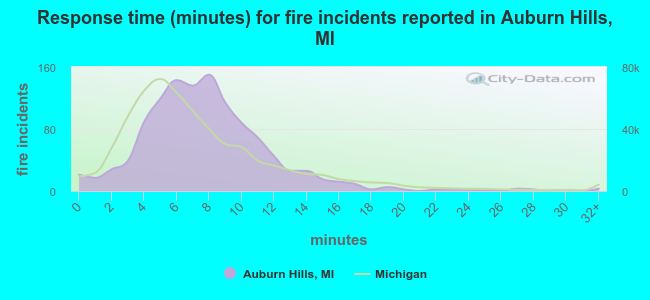 The median response time based on all reported fire incidents is 7 minutes. This is comparable to the state median value.
The median response time in Auburn Hills, MI compared to nearest cities:
(Note: Based on data for all years, including only cities with at least 500 fire incidents)
| Auburn Hills: | 7 minutes |
| Pontiac: | 5 minutes |
| Rochester Hills: | 6 minutes |
| Waterford: | 5 minutes |
| Troy: | 7 minutes |
| Lake Orion: | 5 minutes |
| Oxford: | 6 minutes |
| Royal Oak: | 6 minutes |
| Sterling Heights: | 5 minutes |
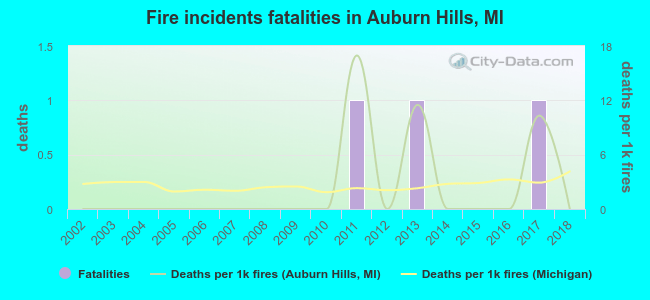 According to the data from the years 2002 - 2018 the average number of fire-related fatalities per year is 0. The highest number of deaths - 1 took place in 2011, and the lowest - 0 in 2002. The data has a constant trend.
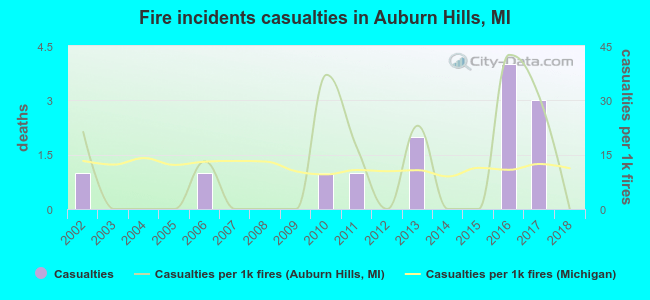 According to the reports from the years 2002 - 2018 the average number of fire-related casualties per year is 1. The highest number of reported injuries - 4 took place in 2016, and the lowest - 0 in 2003. The data has a decreasing trend.
The average number of casualties per 1,000 fires is 11. This indicator was the highest - 43 in 2016, and the lowest 0 in 2003. The trend for injuries per 1,000 fires is declining. Compared to the Michigan value the number of injuries per 1,000 fire incidents is similar.
According to the reports from the years 2002 - 2018 the average number of fire-related casualties per year is 1. The highest number of reported injuries - 4 took place in 2016, and the lowest - 0 in 2003. The data has a decreasing trend.
The average number of casualties per 1,000 fires is 11. This indicator was the highest - 43 in 2016, and the lowest 0 in 2003. The trend for injuries per 1,000 fires is declining. Compared to the Michigan value the number of injuries per 1,000 fire incidents is similar.Casualties per 1,000 incidents in Auburn Hills, MI compared to nearest cities:
(Note: Based on data for all years, including only cities with at least 500 fire incidents)
| Auburn Hills: | 11.1 |
| Pontiac: | 5.5 |
| Rochester Hills: | 28.1 |
| Waterford: | 24.0 |
| Troy: | 18.0 |
| Lake Orion: | 4.6 |
| Oxford: | 9.5 |
| Royal Oak: | 24.1 |
| Sterling Heights: | 49.4 |
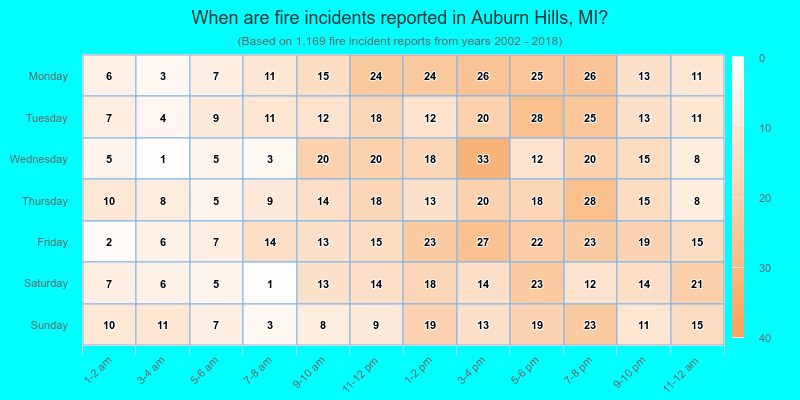
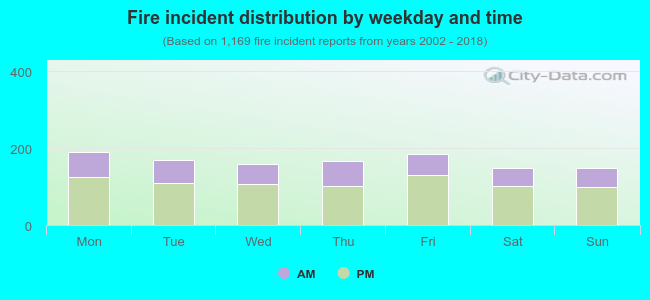 33.9% incidents where reported in the morning and 66.1% in the evening. The most fires (16.3%) took place on Monday, and the least (12.7%) on Saturday.
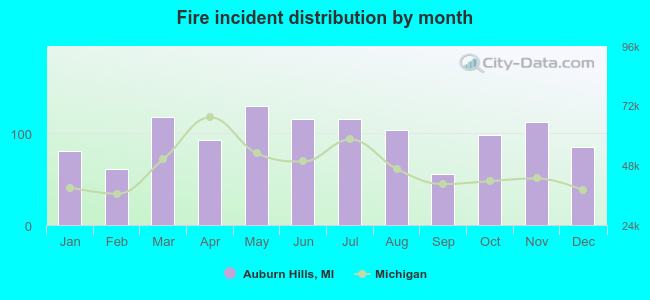 Based on the 1,169 reports from years 2002 - 2018 most fires (11.1%) took place during May, and the least (4.8%) in September.
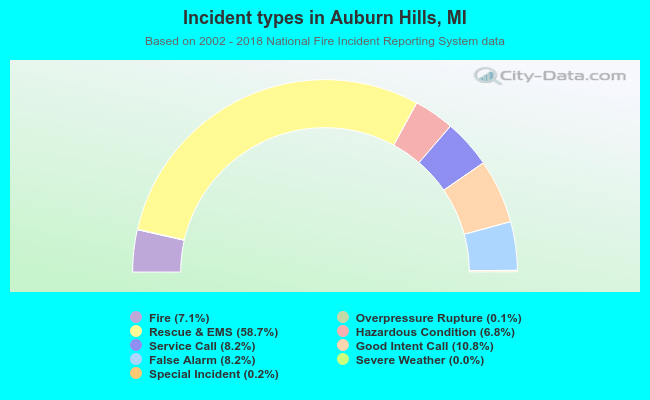 Out of all 16,474 cases reported during the years 2002 - 2018, the most belonged to the categories: Rescue & EMS (58.7%), Good Intent Call (10.8%), and Service Call (8.2%).
 When looking into fire subcategories, the most incidents belonged to: Structure Fires (42.1%), and Mobile Property/Vehicle Fires (31.6%).