Aransas Pass: Fire Incidents, Texas (TX)
Where are fire incidents reported in Aransas Pass, TX
Something went wrong! Please refresh the page.
| Fire incidents reported | |
|---|---|
| Sreet name | Count |
| WHEELER | 106 |
| COMMERCIAL | 74 |
| RIFE ST | 74 |
| 361 HWY | 60 |
| COMMERCIAL ST | 56 |
| MCCAMPBELL ST | 54 |
| LAMONT ST | 46 |
| HWY 35 | 44 |
| WHITNEY ST | 44 |
| 361 | 42 |
| 13TH ST | 40 |
| 35 HWY | 38 |
| 35 BUSINESS HWY | 36 |
| ARCH ST | 34 |
| HOUSTON | 34 |
| HWY 361 | 34 |
| 1069 | 32 |
| 2725 HWY | 32 |
| WHEELER AVE | 32 |
| SMITH RD | 30 |
| FM 1069 | 28 |
| HIGHLAND | 28 |
| SHERWOOD FOREST | 28 |
| BEASLEY AVE | 26 |
| GOODNIGHT ST | 26 |
| 1069 HWY | 24 |
| 12TH | 24 |
| 35 BYPASS HWY | 24 |
| CLEVELAND BLVD | 24 |
| JOHNSON AVE | 24 |
| Other | 447 |
2002 - 2018 National Fire Incident Reporting System (NFIRS) incidents
- Incident types reported to NFIRS in Aransas Pass, TX
- 1,64538.2%Fire
- 97822.7%Hazardous Condition
- 75317.5%Rescue & EMS
- 3468.0%Good Intent Call
- 3047.1%False Alarm
- 2576.0%Service Call
- 140.3%Special Incident
- Fire incident types reported to NFIRS in Aransas Pass, TX
- 95758.2%Outside Fires
- 41125.0%Structure Fires
- 16810.2%Mobile Property/Vehicle Fires
- 1096.6%Other
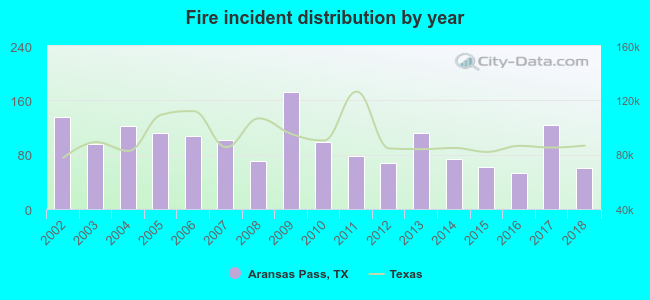 According to the data from the years 2002 - 2018 the average number of fires per year is 97. The highest number of reported fire incidents - 172 took place in 2009, and the least - 53 in 2016. The data has a dropping trend.
The average number of yearly fire incidents per 10k residents in Aransas Pass, TX compared to nearest cities:
(Note: Based on data for the last 3 years, including only cities with population 5,000 and above)
| Aransas Pass: | 93.0 |
| Ingleside: | 59.1 |
| Rockport: | 82.0 |
| Portland: | 26.2 |
| Corpus Christi: | 38.5 |
| Sinton: | 18.6 |
| Robstown: | 106.1 |
| Mathis: | 5.3 |
| Kingsville: | 32.0 |
 The median response time based on all reported fire incidents is 5 minutes. This is lower than the state median value.
The median response time in Aransas Pass, TX compared to nearest cities:
(Note: Based on data for all years, including only cities with at least 500 fire incidents)
| Aransas Pass: | 5 minutes |
| Ingleside: | 5 minutes |
| Rockport: | 7 minutes |
| Portland: | 5 minutes |
| Taft: | 10 minutes |
| Corpus Christi: | 5 minutes |
| Refugio: | 10 minutes |
| Robstown: | 5 minutes |
| Kingsville: | 4 minutes |
 32.6% incidents where reported in the morning and 67.4% in the evening. The most fires (16.0%) took place on Sunday, and the least (12.8%) on Thursday.
 According to the 1,645 incident reports from years 2002 - 2018 most fires (11.5%) took place during July, and the least (6.0%) in November.
 Out of all 4,304 cases reported during the years 2002 - 2018, the most belonged to the categories: Fire (38.2%), Hazardous Condition (22.7%), and Rescue & EMS (17.5%).
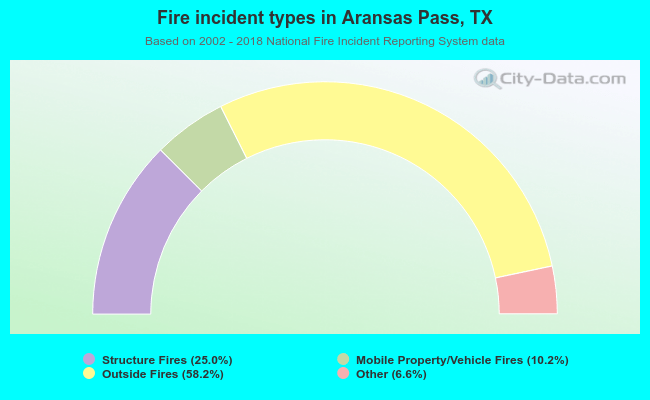 When looking into fire subcategories, the most incidents belonged to: Outside Fires (58.2%), and Structure Fires (25.0%).