Abilene: Fire Incidents, Texas (TX)
Where are fire incidents reported in Abilene, TX
Something went wrong! Please refresh the page.
| Fire incidents reported | |
|---|---|
| Sreet name | Count |
| 1ST ST | 494 |
| 7TH ST | 352 |
| CLACK ST | 340 |
| 14TH ST | 300 |
| BUFFALO GAP RD | 280 |
| PINE ST | 266 |
| 10TH ST | 264 |
| 3RD ST | 238 |
| 11TH ST | 226 |
| I-20 | 214 |
| JUDGE ELY BLVD | 208 |
| HWY 277 | 204 |
| 6TH ST | 198 |
| NONESUCH RD | 196 |
| TREADAWAY BLVD | 194 |
| GRAPE ST | 192 |
| HWY 80 | 174 |
| AMBLER AVE | 170 |
| DANVILLE DR | 166 |
| LAKE RD | 152 |
| MAPLE ST | 148 |
| WEST LAKE RD | 148 |
| WILLIS ST | 148 |
| PIONEER DR | 142 |
| 2ND ST | 140 |
| CLINTON ST | 140 |
| BUTTERNUT ST | 132 |
| MOCKINGBIRD LN | 130 |
| YEOMANS RD | 130 |
| PALM ST | 128 |
| Other | 4,117 |
2002 - 2018 National Fire Incident Reporting System (NFIRS) incidents
- Incident types reported to NFIRS in Abilene, TX
- 56,08760.1%Rescue & EMS
- 10,33111.1%Fire
- 7,9348.5%Good Intent Call
- 7,7938.3%Hazardous Condition
- 7,0557.6%Service Call
- 3,9924.3%False Alarm
- Fire incident types reported to NFIRS in Abilene, TX
- 5,36651.9%Outside Fires
- 3,20131.0%Structure Fires
- 1,55215.0%Mobile Property/Vehicle Fires
- 2122.1%Other
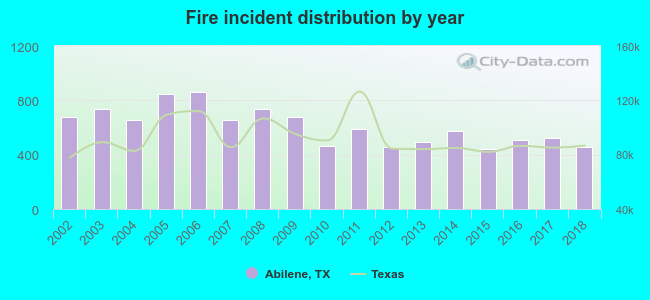 Based on the data from the years 2002 - 2018 the average number of fires per year is 608. The highest number of reported fires - 865 took place in 2006, and the least - 440 in 2015. The data has a decreasing trend.
The average number of yearly fire incidents per 10k residents in Abilene, TX compared to nearest cities:
(Note: Based on data for the last 3 years, including only cities with population 5,000 and above)
| Abilene: | 41.0 |
| Sweetwater: | 113.2 |
| Breckenridge: | 190.6 |
| Brownwood: | 74.8 |
| Snyder: | 47.5 |
 The median response time based on all reported fire incidents is 5 minutes. This is lower than the state median value.
The median response time in Abilene, TX compared to nearest cities:
(Note: Based on data for all years, including only cities with at least 500 fire incidents)
| Abilene: | 5 minutes |
| Clyde: | 12 minutes |
| Baird: | 15 minutes |
| Stamford: | 9 minutes |
| Sweetwater: | 4 minutes |
| Cisco: | 5 minutes |
| Coleman: | 9 minutes |
| Ballinger: | 8 minutes |
| Breckenridge: | 7 minutes |
 According to the reports from the years 2002 - 2018 the average number of fire-related yearly deaths is 2. The highest number of reported deaths - 5 took place in 2003, and the lowest - 0 in 2006. The data has a constant trend.
The average number of deaths per 1,000 fire incidents is 3. This indicator was the highest - 7 in 2003, and the lowest 0 in 2006. The trend for fatalities per 1,000 fire incidents is growing. Compared to the Texas value the number of deaths per 1,000 fires is higher.
According to the reports from the years 2002 - 2018 the average number of fire-related yearly deaths is 2. The highest number of reported deaths - 5 took place in 2003, and the lowest - 0 in 2006. The data has a constant trend.
The average number of deaths per 1,000 fire incidents is 3. This indicator was the highest - 7 in 2003, and the lowest 0 in 2006. The trend for fatalities per 1,000 fire incidents is growing. Compared to the Texas value the number of deaths per 1,000 fires is higher.Deaths per 1,000 incidents in Abilene, TX compared to nearest cities:
(Note: Based on data for all years, including only cities with at least 2,500 fire incidents)
| Abilene: | 2.8 |
 Based on the reports from the years 2002 - 2018 the average number of fire-related yearly casualties is 12. The highest number of casualties - 34 took place in 2003, and the lowest - 3 in 2016. The data has a decreasing trend.
The average number of casualties per 1,000 fires is 20. This indicator was the highest - 46 in 2003, and the lowest 6 in 2016. The trend for injuries per 1,000 fires is dropping. Compared to the state value the number of injuries per 1,000 fires is much higher.
Based on the reports from the years 2002 - 2018 the average number of fire-related yearly casualties is 12. The highest number of casualties - 34 took place in 2003, and the lowest - 3 in 2016. The data has a decreasing trend.
The average number of casualties per 1,000 fires is 20. This indicator was the highest - 46 in 2003, and the lowest 6 in 2016. The trend for injuries per 1,000 fires is dropping. Compared to the state value the number of injuries per 1,000 fires is much higher.Casualties per 1,000 incidents in Abilene, TX compared to nearest cities:
(Note: Based on data for all years, including only cities with at least 500 fire incidents)
| Abilene: | 19.9 |
| Clyde: | 0.0 |
| Baird: | 4.4 |
| Stamford: | 17.4 |
| Sweetwater: | 0.6 |
| Cisco: | 5.6 |
| Coleman: | 2.1 |
| Ballinger: | 3.3 |
| Breckenridge: | 14.1 |
 31.9% incidents where reported in the morning and 68.1% in the evening. The most fires (15.2%) took place on Sunday, and the least (13.8%) on Tuesday.
 According to the 10,331 reports from years 2002 - 2018 most fires (11.0%) took place during July, and the least (6.7%) in September.
 Out of all 93,391 cases reported during the years 2002 - 2018, the most belonged to the categories: Rescue & EMS (60.1%), Fire (11.1%), and Good Intent Call (8.5%).
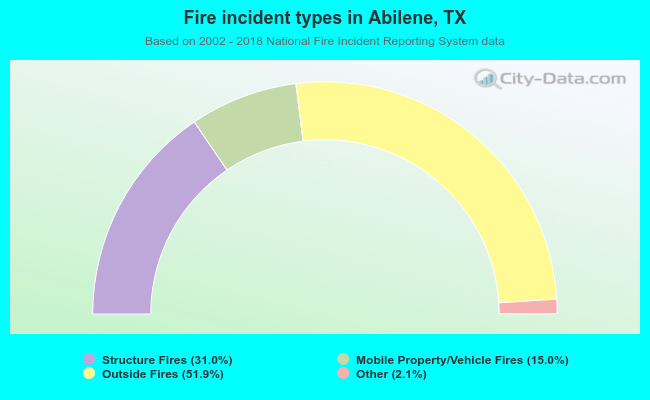 When looking into fire subcategories, the most reports belonged to: Outside Fires (51.9%), and Structure Fires (31.0%).