Crime rate in Billings, Montana (MT): murders, rapes, robberies, assaults, burglaries, thefts, auto thefts, arson, law enforcement employees, police officers, crime map
Crime rate in Billings, MT
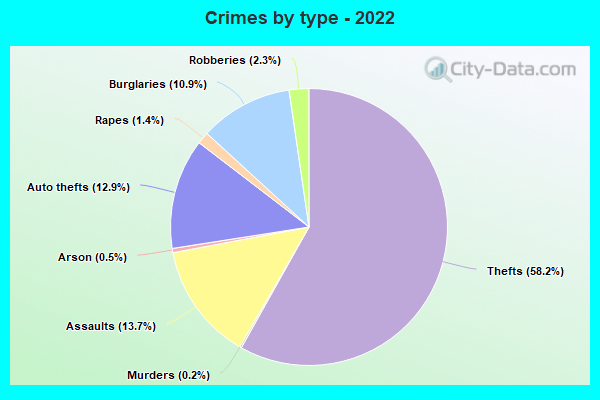
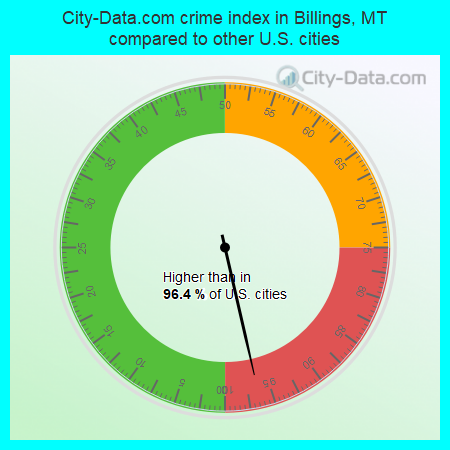
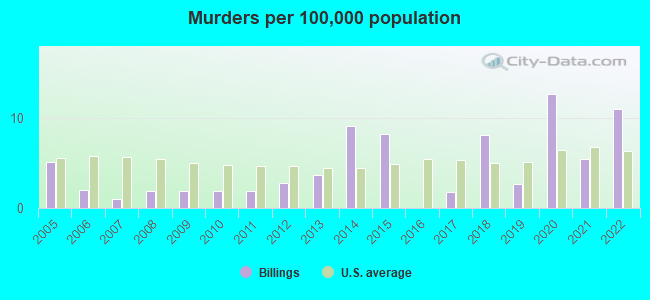
The 2022 crime rate in Billings, MT is 480 (City-Data.com crime index), which is 2.0 times greater than the U.S. average. It was higher than in 96.4% U.S. cities. The 2022 Billings crime rate fell by 13% compared to 2021. The number of homicides stood at 13 - an increase of 7 compared to 2021. In the last 5 years Billings has seen increasing violent crime and decline of property crime.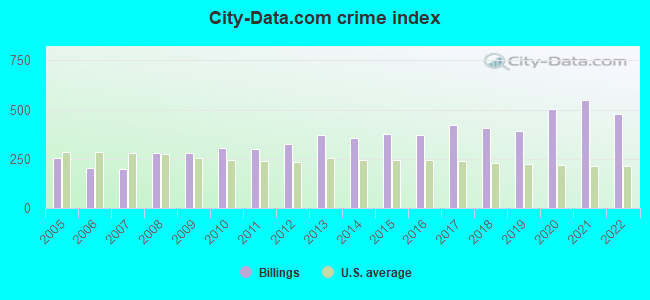
The City-Data.com crime index weighs serious crimes and violent crimes more heavily. Higher means more crime, U.S. average is 246.1. It adjusts for the number of visitors and daily workers commuting into cities.
- means the value is smaller than the state average.- means the value is about the same as the state average.
- means the value is bigger than the state average.
- means the value is much bigger than the state average.
According to our research of Montana and other state lists, there were 525 registered sex offenders living in Billings, Montana as of June 10, 2024.
The ratio of all residents to sex offenders in Billings is 210 to 1.
Violent crime rate in 2022
| Billings: | 518.8 |
| U.S. Average: | 219.8 |
Violent crime rate in 2021
| Billings: | 602.1 |
| U.S. Average: | 224.8 |
Violent crime rate in 2020
| Billings: | 502.5 |
| U.S. Average: | 228.2 |
Violent crime rate in 2019
| Billings: | 358.4 |
| U.S. Average: | 219.9 |
Violent crime rate in 2018
| Billings: | 315.2 |
| U.S. Average: | 221.2 |
Violent crime rate in 2017
| Billings: | 283.4 |
| U.S. Average: | 226.2 |
Violent crime rate in 2016
| Billings: | 258.9 |
| U.S. Average: | 227.3 |
Violent crime rate in 2015
| Billings: | 262.7 |
| U.S. Average: | 219.3 |
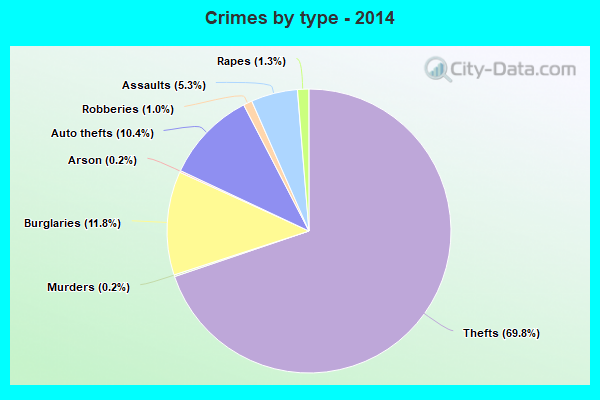
Violent crime rate in 2014
| Billings: | 236.7 |
| U.S. Average: | 211.1 |
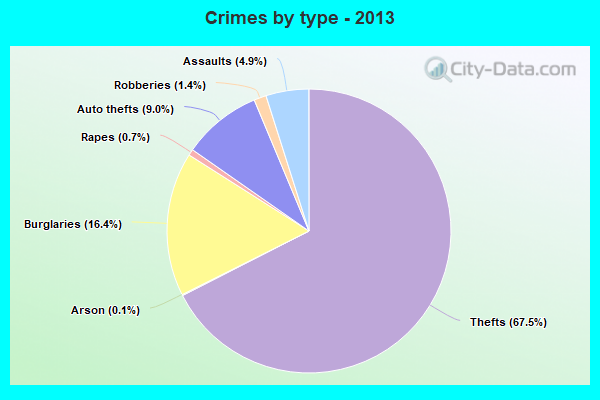
Violent crime rate in 2013
| Billings: | 222.2 |
| U.S. Average: | 214.2 |
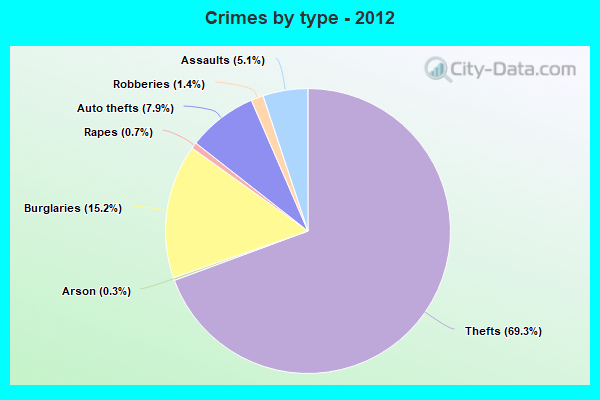
Violent crime rate in 2012
| Billings: | 201.2 |
| U.S. Average: | 187.4 |
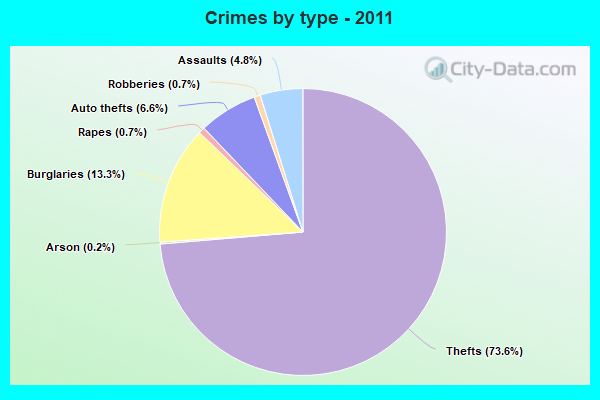
Violent crime rate in 2011
| Billings: | 169.4 |
| U.S. Average: | 187.1 |
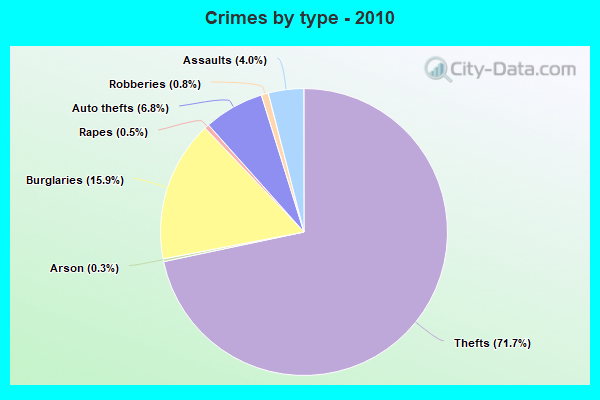
Violent crime rate in 2010
| Billings: | 150.7 |
| U.S. Average: | 195.7 |
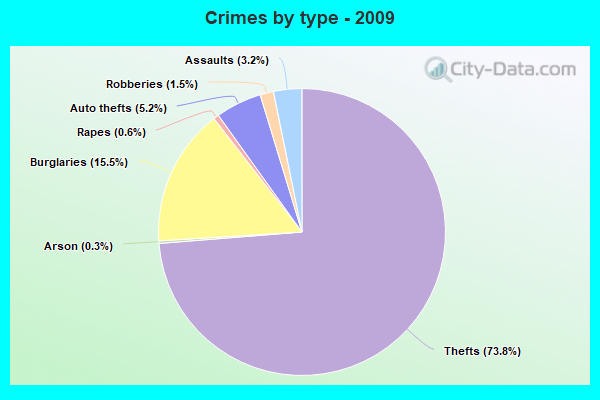
Violent crime rate in 2009
| Billings: | 138.0 |
| U.S. Average: | 208.9 |
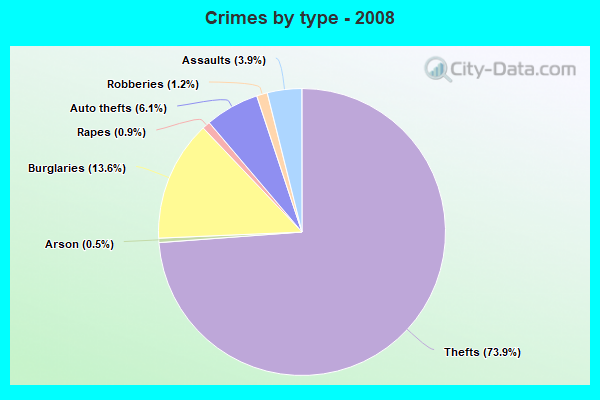
Violent crime rate in 2008
| Billings: | 154.1 |
| U.S. Average: | 222.5 |
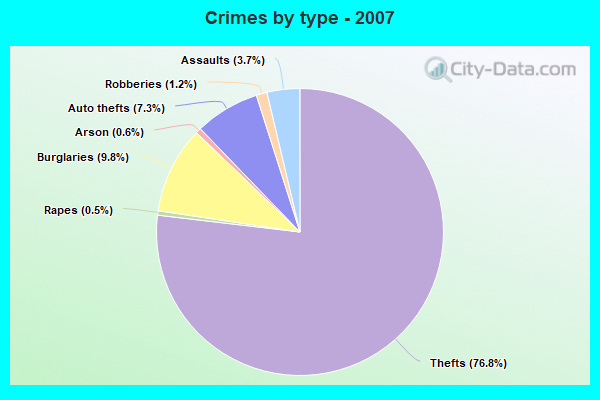
Violent crime rate in 2007
| Billings: | 101.1 |
| U.S. Average: | 229.1 |
Violent crime rate in 2006
| Billings: | 93.0 |
| U.S. Average: | 232.6 |
Violent crime rate in 2005
| Billings: | 96.6 |
| U.S. Average: | 227.0 |
Property crime rate in 2022
| Billings: | 369.6 |
| U.S. Average: | 166.5 |
Property crime rate in 2021
| Billings: | 419.3 |
| U.S. Average: | 157.8 |
Property crime rate in 2020
| Billings: | 412.9 |
| U.S. Average: | 169.6 |
Property crime rate in 2019
| Billings: | 347.7 |
| U.S. Average: | 179.7 |
Property crime rate in 2018
| Billings: | 412.6 |
| U.S. Average: | 190.2 |
Property crime rate in 2017
| Billings: | 454.2 |
| U.S. Average: | 206.4 |
Property crime rate in 2016
| Billings: | 403.3 |
| U.S. Average: | 216.6 |
Property crime rate in 2015
| Billings: | 387.6 |
| U.S. Average: | 221.5 |
Property crime rate in 2014
| Billings: | 362.2 |
| U.S. Average: | 230.8 |
Property crime rate in 2013
| Billings: | 448.5 |
| U.S. Average: | 250.4 |
Property crime rate in 2012
| Billings: | 376.8 |
| U.S. Average: | 267.3 |
Property crime rate in 2011
| Billings: | 350.4 |
| U.S. Average: | 273.5 |
Property crime rate in 2010
| Billings: | 398.0 |
| U.S. Average: | 276.4 |
Property crime rate in 2009
| Billings: | 348.6 |
| U.S. Average: | 285.6 |
Property crime rate in 2008
| Billings: | 323.0 |
| U.S. Average: | 302.2 |
Property crime rate in 2007
| Billings: | 229.2 |
| U.S. Average: | 309.2 |
Property crime rate in 2006
| Billings: | 240.6 |
| U.S. Average: | 317.3 |
Property crime rate in 2005
| Billings: | 310.3 |
| U.S. Average: | 322.3 |

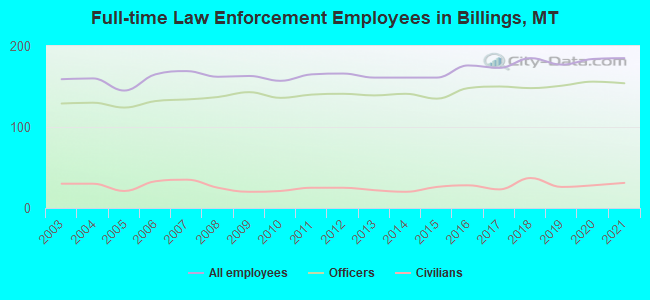
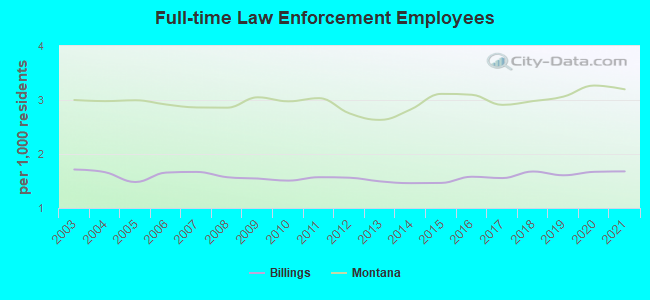
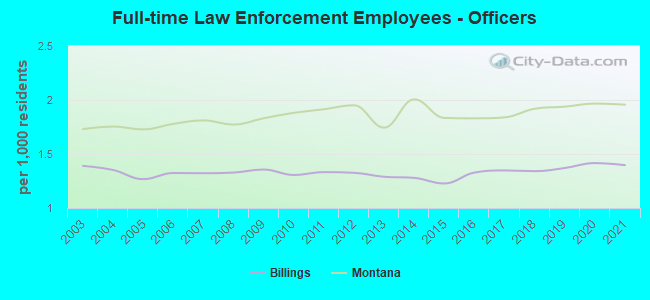
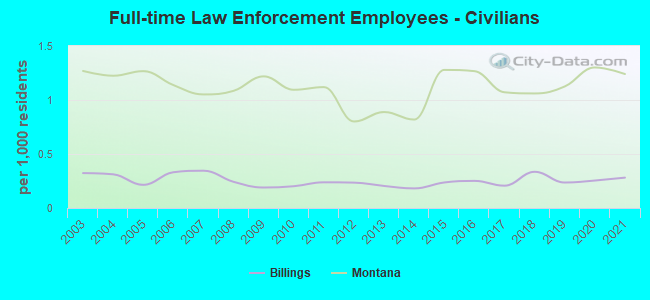
Full-time law enforcement employees in 2021, including police officers: 185 (154 officers - 141 male; 13 female).
| Officers per 1,000 residents here: | 1.40 |
| Montana average: | 1.96 |
Full-time law enforcement employees in 2020, including police officers: 184 (156 officers - 142 male; 14 female).
| Officers per 1,000 residents here: | 1.42 |
| Montana average: | 1.97 |
Full-time law enforcement employees in 2019, including police officers: 177 (151 officers - 138 male; 13 female).
| Officers per 1,000 residents here: | 1.37 |
| Montana average: | 1.94 |
Full-time law enforcement employees in 2018, including police officers: 185 (148 officers - 136 male; 12 female).
| Officers per 1,000 residents here: | 1.34 |
| Montana average: | 1.92 |
Full-time law enforcement employees in 2017, including police officers: 173 (150 officers - 140 male; 10 female).
| Officers per 1,000 residents here: | 1.35 |
| Montana average: | 1.84 |
Full-time law enforcement employees in 2016, including police officers: 176 (148 officers - 139 male; 9 female).
| Officers per 1,000 residents here: | 1.33 |
| Montana average: | 1.83 |
Full-time law enforcement employees in 2015, including police officers: 161 (135 officers - 125 male; 10 female).
| Officers per 1,000 residents here: | 1.23 |
| Montana average: | 1.83 |
Full-time law enforcement employees in 2014, including police officers: 161 (141 officers - 131 male; 10 female).
| Officers per 1,000 residents here: | 1.28 |
| Montana average: | 2.01 |
Full-time law enforcement employees in 2013, including police officers: 161 (139 officers - 127 male; 12 female).
| Officers per 1,000 residents here: | 1.29 |
| Montana average: | 1.74 |
Full-time law enforcement employees in 2012, including police officers: 166 (141 officers - 128 male; 13 female).
| Officers per 1,000 residents here: | 1.33 |
| Montana average: | 1.95 |
Full-time law enforcement employees in 2011, including police officers: 165 (140 officers - 128 male; 12 female).
| Officers per 1,000 residents here: | 1.33 |
| Montana average: | 1.91 |
Full-time law enforcement employees in 2010, including police officers: 157 (136 officers - 124 male; 12 female).
| Officers per 1,000 residents here: | 1.31 |
| Montana average: | 1.88 |
Full-time law enforcement employees in 2009, including police officers: 163 (143 officers - 131 male; 12 female).
| Officers per 1,000 residents here: | 1.36 |
| Montana average: | 1.83 |
Full-time law enforcement employees in 2008, including police officers: 162 (137 officers - 126 male; 11 female).
| Officers per 1,000 residents here: | 1.33 |
| Montana average: | 1.77 |
Full-time law enforcement employees in 2007, including police officers: 169 (134 officers - 122 male; 12 female).
| Officers per 1,000 residents here: | 1.32 |
| Montana average: | 1.81 |
Full-time law enforcement employees in 2006, including police officers: 165 (132 officers - 120 male; 12 female).
| Officers per 1,000 residents here: | 1.32 |
| Montana average: | 1.78 |
Full-time law enforcement employees in 2005, including police officers: 145 (124 officers - 112 male; 12 female).
| Officers per 1,000 residents here: | 1.27 |
| Montana average: | 1.73 |
Full-time law enforcement employees in 2004, including police officers: 160 (130 officers - 118 male; 12 female).
| Officers per 1,000 residents here: | 1.35 |
| Montana average: | 1.75 |
Full-time law enforcement employees in 2003, including police officers: 159 (129 officers - 118 male; 11 female).
| Officers per 1,000 residents here: | 1.39 |
| Montana average: | 1.73 |