Clay County, Texas (TX)
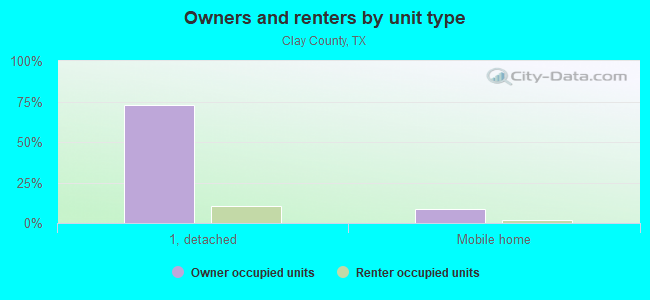
County owner-occupied free and clear houses and condos in 2010: 1,937
County owner-occupied houses and condos in 2000: 3,589
Renter-occupied apartments: 717 (it was 734 in 2000)
| % of renters here: | 17% |
| State: | 36% |
Land area: 1098 sq. mi.
Water area: 18.4 sq. mi.
Population density: 10 people per square mile (low).
Industries providing employment: Educational, health and social services (24.4%), Retail trade (12.4%), Agriculture,forestry,fishing and hunting, and mining (10.3%).
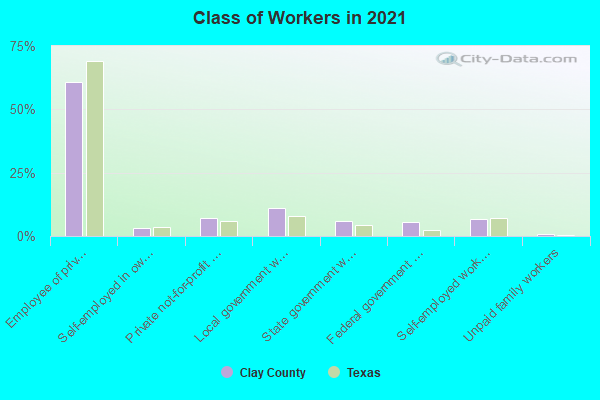
Type of workers:
- Private wage or salary: 68%
- Government: 24%
- Self-employed, not incorporated: 7%
- Unpaid family work: 0%
- OSM Map
- General Map
- Google Map
- MSN Map

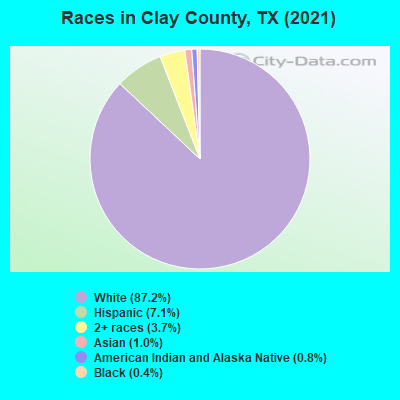
- 8,98586.7%White Non-Hispanic Alone
- 7567.3%Hispanic or Latino
- 3703.6%Two or more races
- 1151.1%American Indian and Alaska Native alone
- 1021.0%Asian alone
- 270.3%Black Non-Hispanic Alone
- 40.04%Some other race alone
| Median resident age: | 47.3 years |
| Texas median age: | 35.6 years |
| Males: 5,311 | |
| Females: 5,255 |


| Clay County: | 2.0 people |
| Texas: | 3 people |
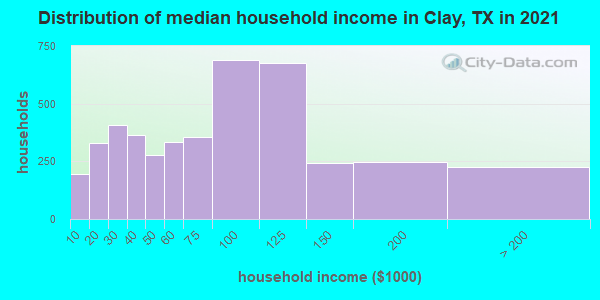
Estimated median household income in 2022: $74,453 ($35,738 in 1999)
| This county: | $74,453 |
| Texas: | $72,284 |
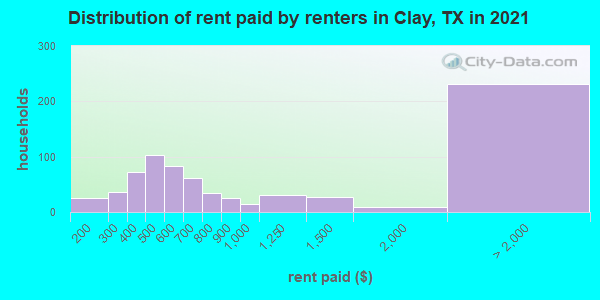
Median contract rent in 2022 for apartments: $586 (lower quartile is $461, upper quartile is $804)
| This county: | $586 |
| State: | $1117 |
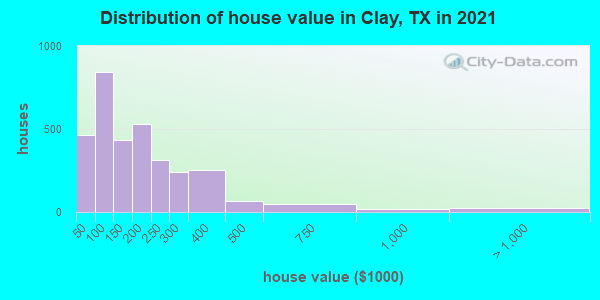
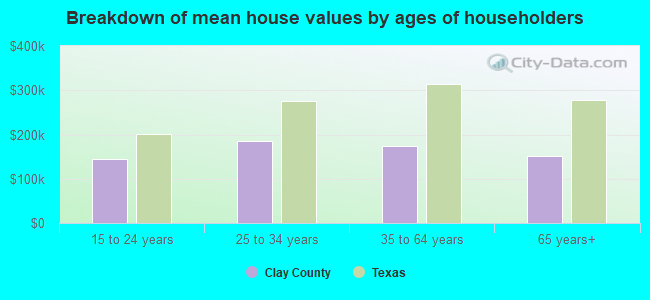
Estimated median house or condo value in 2022: $161,653 (it was $52,100 in 2000)
| Clay: | $161,653 |
| Texas: | $275,400 |
Mean price in 2022:
Median monthly housing costs for homes and condos with a mortgage: $1,367Detached houses: $200,998
Here: $200,998 State: $369,058 Townhouses or other attached units: $192,838
Here: $192,838 State: $327,631 Mobile homes: $82,637
Here: $82,637 State: $124,413
Median monthly housing costs for units without a mortgage: $537
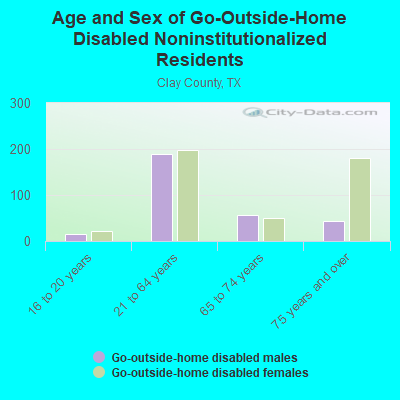
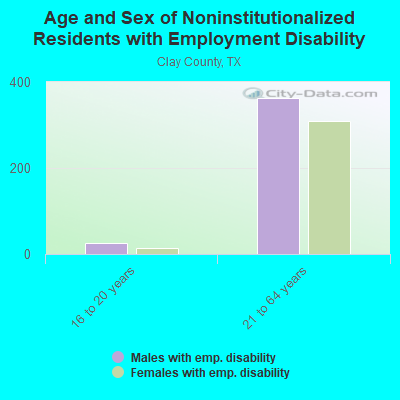
Institutionalized population: 70
Crime in 2021 (reported by the sheriff's office or county police, not the county total):
- Murders: 0
- Rapes: 3
- Robberies: 0
- Assaults: 8
- Burglaries: 25
- Thefts: 28
- Auto thefts: 14
Crime in 2020 (reported by the sheriff's office or county police, not the county total):
- Murders: 0
- Rapes: 3
- Robberies: 1
- Assaults: 9
- Burglaries: 34
- Thefts: 49
- Auto thefts: 9
Health of residents in Clay County based on CDC Behavioral Risk Factor Surveillance System Survey Questionnaires from 2013 to 2021:
General health status score of residents in this county from 1 (poor) to 5 (excellent) is 3.1. This is significantly worse than average.60.6% of residents exercised in the past month. This is less than average.
46.9% of residents smoked 100+ cigarettes in their lives. This is about average.
34.3% of adult residents drank alcohol in the past 30 days. This is less than average.
65.5% of residents visited a dentist within the past year. This is less than average.
Average weight of males is 201 pounds. This is more than average.
Average weight of females is 166 pounds. This is about average.
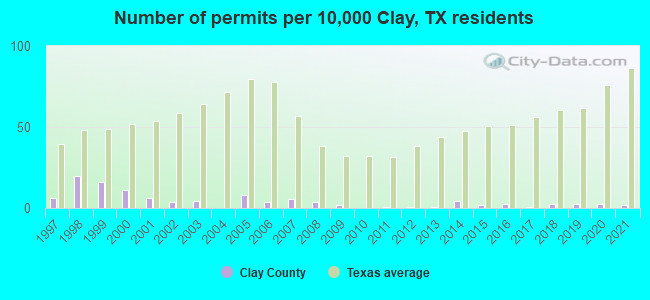
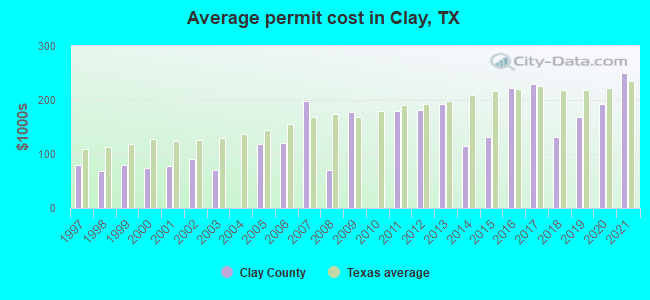
Single-family new house construction building permits:
- 2022: 8 buildings, average cost: $158,800
- 2021: 2 buildings, average cost: $250,000
- 2020: 3 buildings, average cost: $192,700
- 2019: 3 buildings, average cost: $167,700
- 2018: 3 buildings, average cost: $131,000
- 2017: 1 building, cost: $230,000
- 2016: 3 buildings, average cost: $223,300
- 2015: 2 buildings, average cost: $131,500
- 2014: 5 buildings, average cost: $113,600
- 2013: 1 building, cost: $192,600
- 2012: 1 building, cost: $181,600
- 2011: 1 building, cost: $179,400
- 2010: 0 buildings
- 2009: 2 buildings, average cost: $177,100
- 2008: 4 buildings, average cost: $70,000
- 2007: 6 buildings, average cost: $198,600
- 2006: 4 buildings, average cost: $119,500
- 2005: 9 buildings, average cost: $118,100
- 2004: 0 buildings
- 2003: 5 buildings, average cost: $69,800
- 2002: 4 buildings, average cost: $90,000
- 2001: 7 buildings, average cost: $77,600
- 2000: 12 buildings, average cost: $73,900
- 1999: 18 buildings, average cost: $80,400
- 1998: 22 buildings, average cost: $68,300
- 1997: 7 buildings, average cost: $80,400
Median real estate property taxes paid for housing units with mortgages in 2022: $2,829 (1.6%)
Median real estate property taxes paid for housing units with no mortgage in 2022: $1,590 (1.2%)
| Clay County: | 9.1% |
| Texas: | 14.0% |
Median age of residents in 2022: 47.3 years old
(Males: 46.8 years old, Females: 47.7 years old)
(Median age for: White residents: 49.0 years old, American Indian residents: 29.9 years old, Asian residents: 21.2 years old, Hispanic or Latino residents: 34.7 years old, Other race residents: 49.2 years old)
Area name: Wichita Falls, TX MSA
Fair market rent in 2006 for a 1-bedroom apartment in Clay County is $459 a month.
Fair market rent for a 2-bedroom apartment is $547 a month.
Fair market rent for a 3-bedroom apartment is $768 a month.
Cities in this county include: Henrietta, Bellevue-Joy, Petrolia, Byers, Bellevue, Dean, Jolly.
Notable locations in this county outside city limits:
Streams, rivers, and creeks: Sanders Creek (A), Ford Creek (B), Dead Man Branch (C). Display/hide their locations on the map
Neighboring counties: Calhoun County, Mississippi  , Cleburne County, Alabama , Little River County, Arkansas , Lee County, Mississippi , Pushmataha County, Oklahoma
  , Stephens County, Oklahoma
  .
.
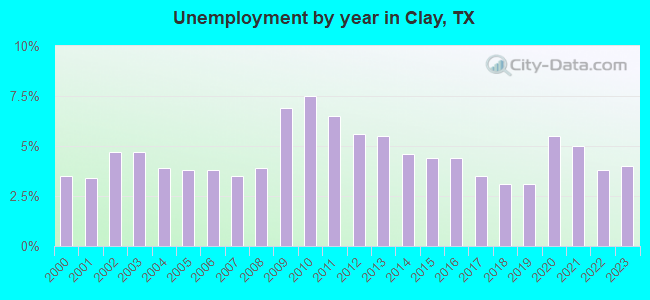
| Here: | 3.3% |
| Texas: | 3.5% |
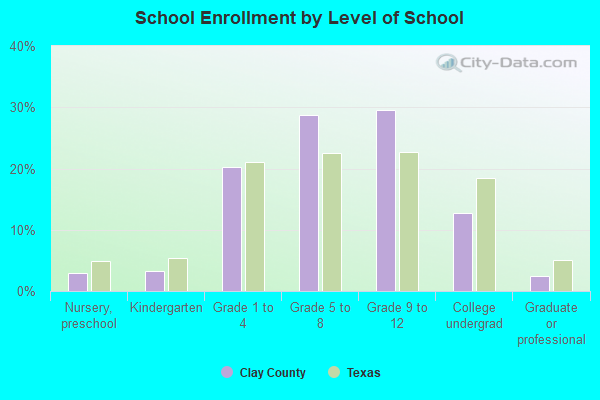
Current college students: 372
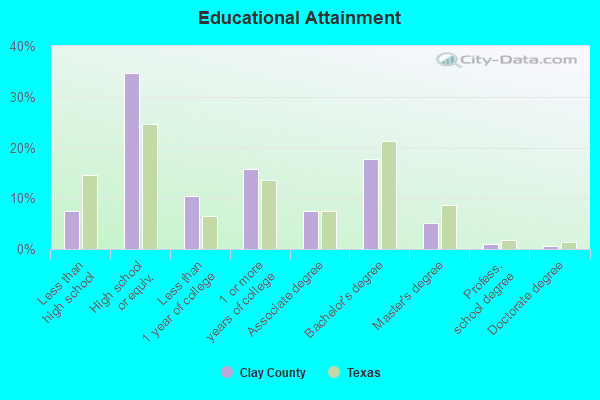
People 25 years of age or older with a high school degree or higher: 92.9%
People 25 years of age or older with a bachelor's degree or higher: 23.2%
Number of foreign born residents: 276 (34.6% naturalized citizens)
| Clay County: | 2.6% |
| Whole state: | 17.2% |
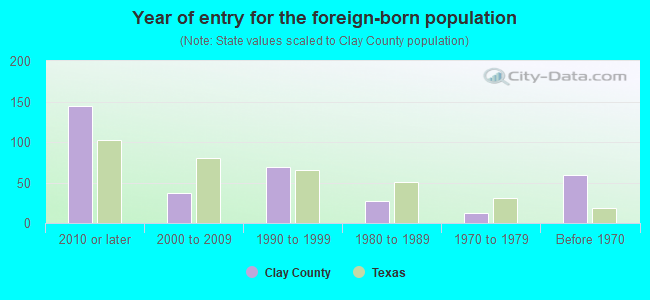
- Year of entry for the foreign-born population
- 1152010 or later
- 392000 to 2009
- 781990 to 1999
- 271980 to 1989
- 121970 to 1979
- 59Before 1970
Mean travel time to work (commute): minutes
Percentage of county residents living and working in this county: 98.2%
Housing units in structures:
- One, detached: 4,355
- One, attached: 75
- Two: 68
- 3 or 4: 42
- 10 to 19: 12
- Mobile homes: 739
- Boats, RVs, vans, etc.: 5
Housing units in Clay County with a mortgage: 1,421 (39 second mortgage, 0 home equity loan, 30 both second mortgage and home equity loan)
Houses without a mortgage: 70
| Here: | 1.4% with mortgage |
| State: | 98.4% with mortgage |
Religion statistics for Clay County
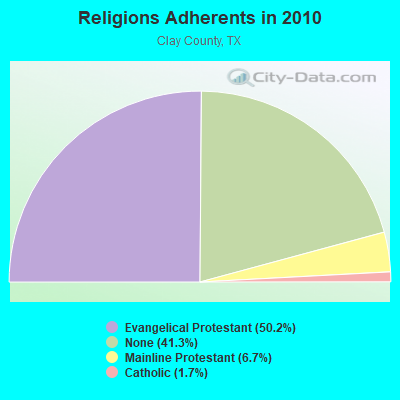
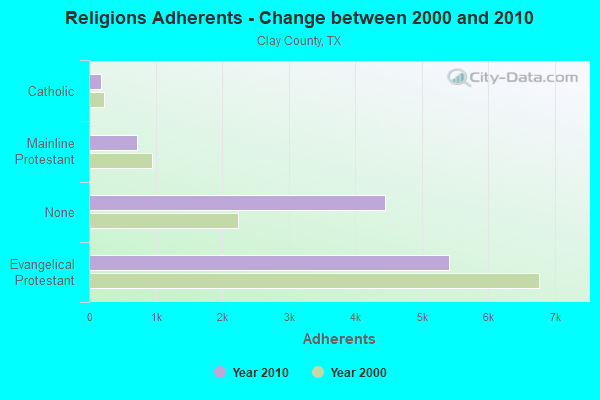
| Religion | Adherents | Congregations |
|---|---|---|
| Evangelical Protestant | 5,401 | 19 |
| Mainline Protestant | 724 | 6 |
| Catholic | 180 | 1 |
| Other | 2 | - |
| None | 4,445 | - |
Source: Clifford Grammich, Kirk Hadaway, Richard Houseal, Dale E.Jones, Alexei Krindatch, Richie Stanley and Richard H.Taylor. 2012. 2010 U.S.Religion Census: Religious Congregations & Membership Study. Association of Statisticians of American Religious Bodies. Jones, Dale E., et al. 2002. Congregations and Membership in the United States 2000. Nashville, TN: Glenmary Research Center.
Food Environment Statistics:
| Clay County: | 2.70 / 10,000 pop. |
| State: | 1.47 / 10,000 pop. |
| This county: | 0.90 / 10,000 pop. |
| Texas: | 1.11 / 10,000 pop. |
| Clay County: | 2.70 / 10,000 pop. |
| Texas: | 3.95 / 10,000 pop. |
| This county: | 2.70 / 10,000 pop. |
| State: | 6.13 / 10,000 pop. |
| Clay County: | 9.4% |
| Texas: | 8.9% |
| Clay County: | 28.0% |
| State: | 26.6% |
Agriculture in Clay County:
Average size of farms: 734 acresAverage value of agricultural products sold per farm: $43,906
Average value of crops sold per acre for harvested cropland: $70.26
The value of nursery, greenhouse, floriculture, and sod as a percentage of the total market value of agricultural products sold: 1.72%
The value of livestock, poultry, and their products as a percentage of the total market value of agricultural products sold: 89.98%
Average total farm production expenses per farm: $39,580
Harvested cropland as a percentage of land in farms: 8.54%
Average market value of all machinery and equipment per farm: $46,556
The percentage of farms operated by a family or individual: 91.26%
Average age of principal farm operators: 57 years
Average number of cattle and calves per 100 acres of all land in farms: 12.93
Milk cows as a percentage of all cattle and calves: 2.96%
All wheat for grain: 20528 harvested acres
Vegetables: 100 harvested acres
Land in orchards: 3,265 acres
Earthquake activity:
Clay County-area historical earthquake activity is significantly above Texas state average. It is 585% greater than the overall U.S. average.On 11/6/2011 at 03:53:10, a magnitude 5.7 (5.7 MW, Depth: 3.2 mi, Class: Moderate, Intensity: VI - VII) earthquake occurred 146.1 miles away from Clay County center
On 9/3/2016 at 12:02:44, a magnitude 5.8 (5.8 MW, Depth: 3.5 mi) earthquake occurred 196.7 miles away from the county center
On 6/16/1978 at 11:46:54, a magnitude 5.3 (4.4 MB, 4.6 UK, 5.3 ML) earthquake occurred 157.3 miles away from the county center
On 2/13/2016 at 17:07:06, a magnitude 5.1 (5.1 MW, Depth: 5.2 mi) earthquake occurred 190.1 miles away from the county center
On 11/7/2016 at 01:44:24, a magnitude 5.0 (5.0 MW, Depth: 2.8 mi) earthquake occurred 172.3 miles away from Clay County center
On 11/8/2011 at 02:46:57, a magnitude 4.8 (4.8 MW, Depth: 3.1 mi, Class: Light, Intensity: IV - V) earthquake occurred 145.4 miles away from the county center
Magnitude types: body-wave magnitude (MB), local magnitude (ML), moment magnitude (MW)
Most recent natural disasters:
- Texas Covid-19 Pandemic, Incident Period: January 20, 2020, FEMA Id: 4485, Natural disaster type: Other
- Texas Severe Storms, Tornadoes, Straight-line Winds, and Flooding, Incident Period: May 04, 2015 to June 23, 2015, Major Disaster (Presidential) Declared DR-4223: May 29, 2015, FEMA Id: 4223, Natural disaster type: Storm, Tornado, Flood, Wind
- Texas Wildfires, Incident Period: August 30, 2011 to December 31, 2011, Major Disaster (Presidential) Declared DR-4029: September 09, 2011, FEMA Id: 4029, Natural disaster type: Fire
- Texas McDonald 2 Fire, Incident Period: June 19, 2011 to June 30, 2011, Fire Management Assistance Declared: June 20, 2011, FEMA Id: 2928, Natural disaster type: Fire
- Texas 148/2332 Fire, Incident Period: April 14, 2011 to April 17, 2011, Fire Management Assistance Declared: April 21, 2011, FEMA Id: 2899, Natural disaster type: Fire
- Texas Wildfires, Incident Period: March 14, 2008 to September 01, 2008, Emergency Declared EM-3284: March 14, 2008, FEMA Id: 3284, Natural disaster type: Fire
- Texas Hurricane Rita, Incident Period: September 23, 2005 to October 14, 2005, Major Disaster (Presidential) Declared DR-1606: September 24, 2005, FEMA Id: 1606, Natural disaster type: Hurricane
- Texas Hurricane Rita, Incident Period: September 20, 2005 to October 14, 2005, Emergency Declared EM-3261: September 21, 2005, FEMA Id: 3261, Natural disaster type: Hurricane
- Texas Hurricane Katrina, Incident Period: August 29, 2005 to October 01, 2005, Emergency Declared EM-3216: September 02, 2005, FEMA Id: 3216, Natural disaster type: Hurricane
- Texas Extreme Fire Hazards, Incident Period: August 01, 1999 to December 10, 1999, Emergency Declared EM-3142: September 01, 1999, FEMA Id: 3142, Natural disaster type: Fire
- 4 other natural disasters have been reported since 1953.
The number of natural disasters in Clay County (14) is near the US average (15).
Major Disasters (Presidential) Declared: 6
Emergencies Declared: 5
Causes of natural disasters: Fires: 6, Storms: 4, Tornadoes: 4, Floods: 3, Hurricanes: 3, Wind: 1, Other: 1 (Note: some incidents may be assigned to more than one category).
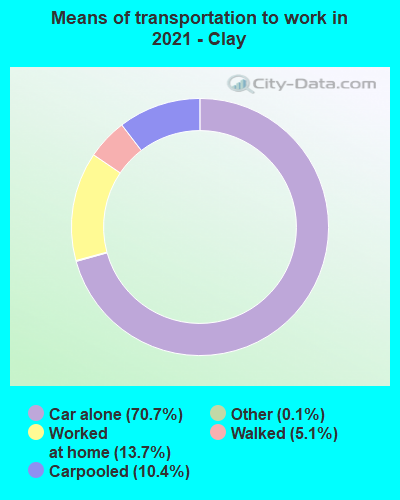
Means of transportation to work:
- Drove a car alone: 1,269 (66.9%)
- Carpooled: 195 (10.3%)
- Walked: 88 (4.6%)
- Worked at home: 371 (19.6%)
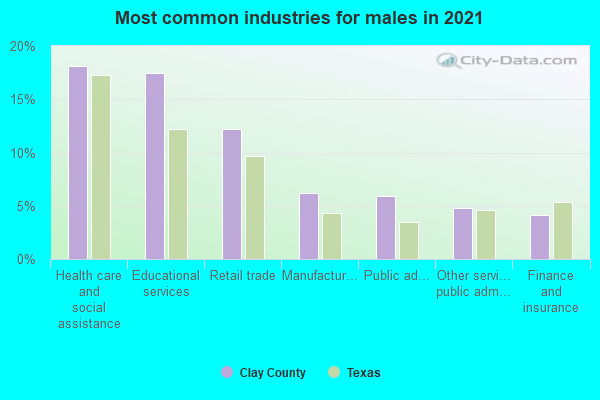
- Health care and social assistance (21%)
- Educational services (18%)
- Retail trade (13%)
- Public administration (6%)
- Manufacturing (5%)
- Finance and insurance (4%)
- Other services, except public administration (4%)
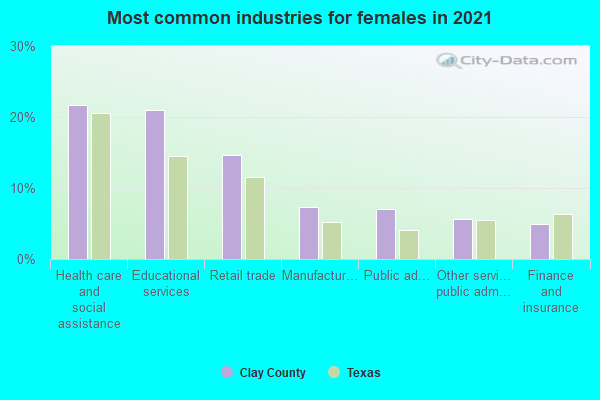
- Health care and social assistance (24%)
- Educational services (20%)
- Retail trade (15%)
- Public administration (7%)
- Manufacturing (5%)
- Finance and insurance (5%)
- Other services, except public administration (5%)
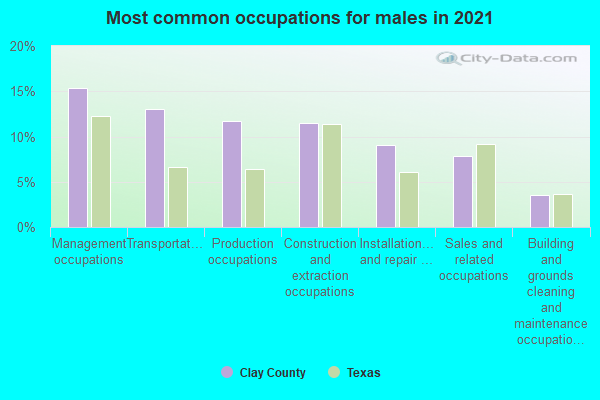
- Management occupations (19%)
- Transportation occupations (13%)
- Construction and extraction occupations (13%)
- Production occupations (12%)
- Sales and related occupations (10%)
- Installation, maintenance, and repair occupations (6%)
- Educational instruction, and library occupations (3%)
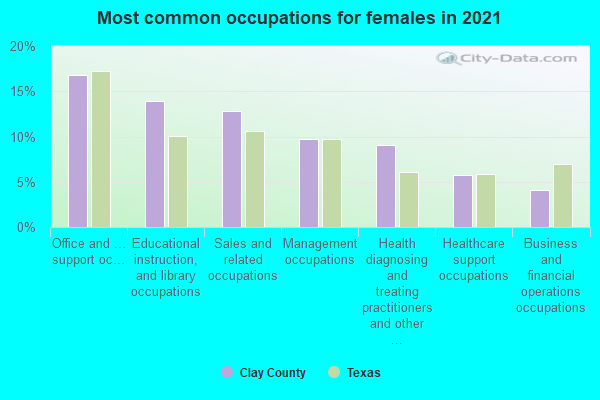
- Office and administrative support occupations (20%)
- Educational instruction, and library occupations (15%)
- Sales and related occupations (13%)
- Management occupations (9%)
- Health diagnosing and treating practitioners and other technical occupations (7%)
- Healthcare support occupations (6%)
- Health technologists and technicians (5%)
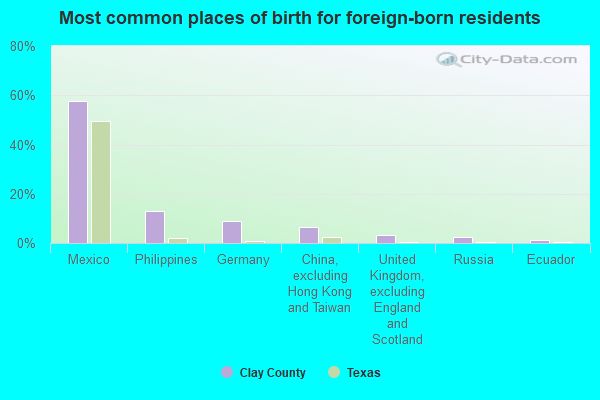
- Mexico (55%)
- Philippines (16%)
- China, excluding Hong Kong and Taiwan (6%)
- Germany (5%)
- United Kingdom, excluding England and Scotland (5%)
- Russia (3%)
- Colombia (1%)
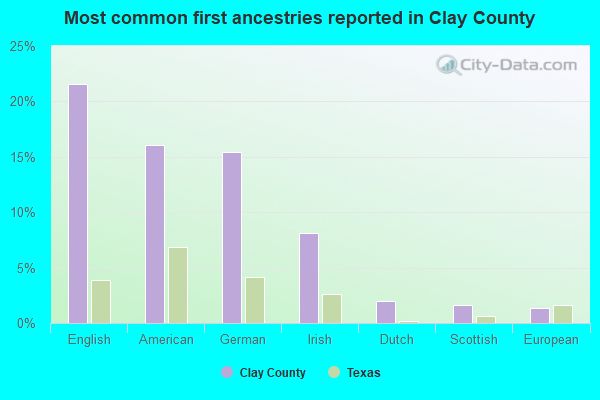
- English (21%)
- American (18%)
- German (15%)
- Irish (8%)
- Scotch-Irish (1%)
- Dutch (1%)
- European (1%)
25 people in local jails and other municipal confinement facilities
People in group quarters in Clay County, Texas in 2000:
- 61 people in nursing homes
- 25 people in local jails and other confinement facilities (including police lockups)
- 8 people in other noninstitutional group quarters
9.21% of this county's 2021 resident taxpayers lived in other counties in 2020 ($58,704 average adjusted gross income)
| Here: | 9.21% |
| Texas average: | 8.12% |
10 or fewer of this county's residents moved from foreign countries.
7.76% relocated from other counties in Texas ($47,771 average AGI)
1.45% relocated from other states ($10,934 average AGI)
Clay County: 1.45% Texas average: 2.83%
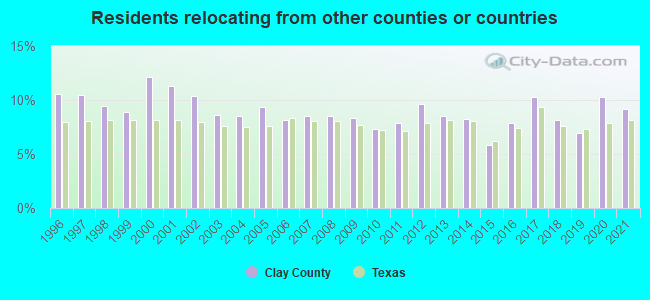
Top counties from which taxpayers relocated into this county between 2020 and 2021:
| from Wichita County, TX | |
| from Montague County, TX | |
| from Tarrant County, TX |
7.78% of this county's 2020 resident taxpayers moved to other counties in 2021 ($53,286 average adjusted gross income)
| Here: | 7.78% |
| Texas average: | 7.40% |
10 or fewer of this county's residents moved to foreign countries.
6.85% relocated to other counties in Texas ($47,814 average AGI)
0.93% relocated to other states ($5,475 average AGI)
Clay County: 0.93% Texas average: 2.08%
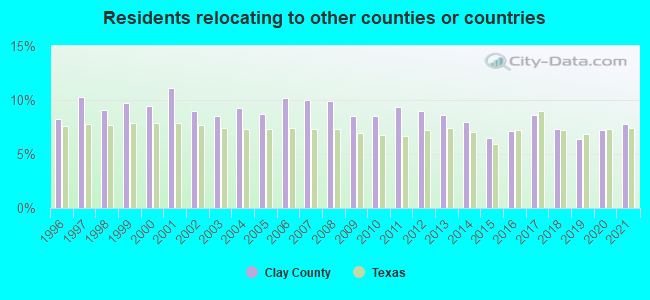
Top counties to which taxpayers relocated from this county between 2020 and 2021:
| to Wichita County, TX |
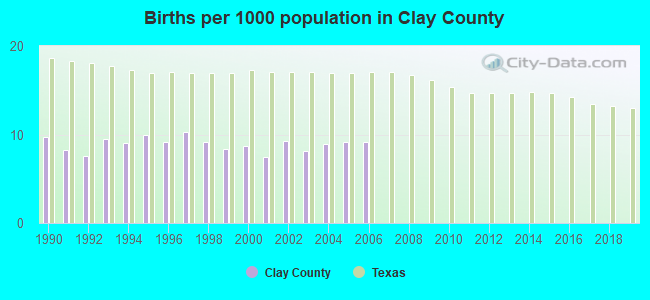
Births per 1000 population from 1990 to 1999: 9.1
Births per 1000 population from 2000 to 2006: 8.7
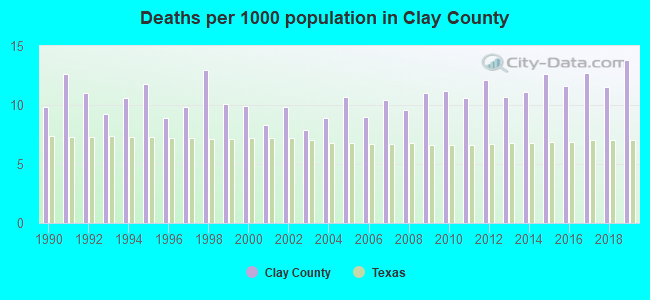
Deaths per 1000 population from 1990 to 1999: 10.7
Deaths per 1000 population from 2000 to 2009: 9.5
Deaths per 1000 population from 2010 to 2020: 12.0
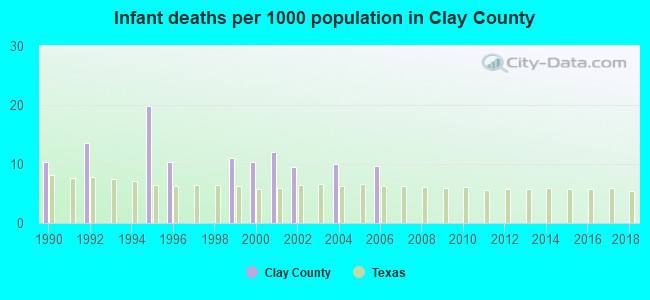
Infant deaths per 1000 live births from 1990 to 1999: 6.5
Infant deaths per 1000 live births from 2000 to 2006: 7.4
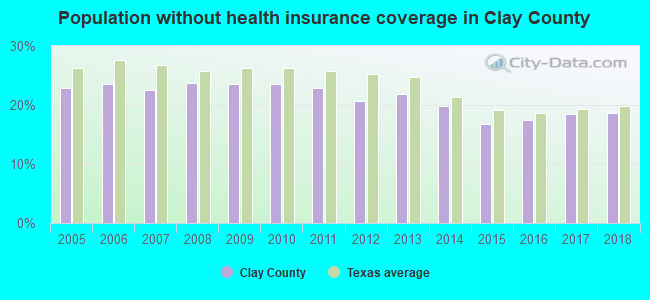
Persons under 19 years old without health insurance coverage in 2018: 13.2%
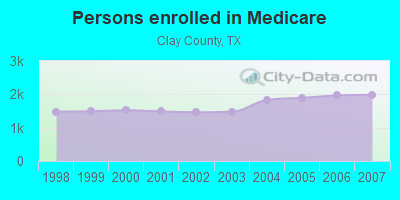
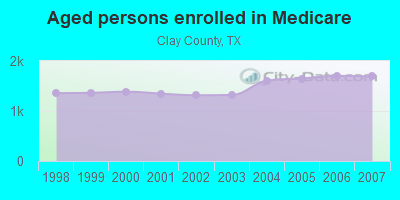
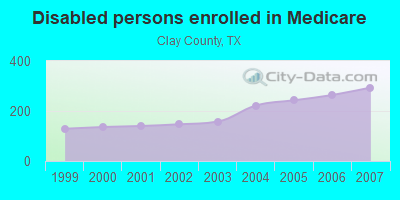
Persons enrolled in hospital insurance and/or supplemental medical insurance (Medicare) in July 1, 2007: 1,986 (1,692 aged, 294 disabled)
Children under 18 without health insurance coverage in 2007: 343 (15%)
Most common underlying causes of death in Clay County, Texas in 1999 - 2019:
- Acute myocardial infarction, unspecified (183)
- Bronchus or lung, unspecified - Malignant neoplasms (81)
- Atherosclerotic heart disease (36)
- Chronic obstructive pulmonary disease, unspecified (25)
Population without health insurance coverage in 2000: 14%
Children under 18 without health insurance coverage in 2000: 12%
Short term general hospital admissions per 100,000 population in 2004: 3,544
Short term general hospital beds per 100,000 population in 2004: 223
Emergency room visits per 100,000 population in 2004: 24,370
General practice office based MDs per 100,000 population in 2005: 895
Medical specialist MDs per 100,000 population in 2005: 913
Total deaths per 100,000 population, July 2005 - July 2006: 27
Household type by relationship:
Households: 10,566- Male householders: 2,279 (577 living alone), Female householders: 2,163 (593 living alone)
2,676 spouses (2,638 opposite-sex spouses), 89 unmarried partners, (82 opposite-sex unmarried partners), 2,387 children (2,192 natural, 67 adopted, 126 stepchildren), 360 grandchildren, 72 brothers or sisters, 139 parents, 16 foster children, 137 other relatives, 201 non-relatives
- In group quarters: 87
Size of family households: 1,711 2-persons, 659 3-persons, 381 4-persons, 262 5-persons, 56 6-persons, 73 7-or-more-persons.
Size of nonfamily households: 1,171 1-person, 131 2-persons, 5 4-persons, 3 5-persons.
1,367 married couples with children.
424 single-parent households (74 men, 350 women).
94.7% of residents of Clay speak English at home.
4.4% of residents speak Spanish at home (66% speak English very well, 22% speak English well, 6% speak English not well, 5% don't speak English at all).
0.4% of residents speak other Indo-European language at home (97% speak English very well, 3% speak English well).
0.6% of residents speak Asian or Pacific Island language at home (21% speak English very well, 61% speak English well, 11% speak English not well, 7% don't speak English at all).
0.1% of residents speak other language at home (100% speak English very well).
In fiscal year 2004:
Federal Government expenditure: $48,575,000 ($4,325 per capita)
Department of Defense expenditure: $1,832,000
Federal direct payments to individuals for retirement and disability: $24,692,000
Federal other direct payments to individuals: $12,210,000
Federal direct payments not to individuals: $2,108,000
Federal grants: $7,759,000
Federal procurement contracts: $348,000 ($0,000 Department of Defense)
Federal salaries and wages: $1,458,000 ($0,000 Department of Defense)
Federal Government direct loans: $4,000
Federal guaranteed/insured loans: $3,210,000
Federal Government insurance: $7,383,000
Population change from April 1, 2000 to July 1, 2005:
Births: 475| Here: | 42 per 1000 residents |
| State: | 85 per 1000 residents |
Deaths: 499
| Here: | 44 per 1000 residents |
| State: | 35 per 1000 residents |
Net international migration: +14
| Here: | +1 per 1000 residents |
| State: | +29 per 1000 residents |
Net internal migration: +327
| Here: | +29 per 1000 residents |
| State: | +10 per 1000 residents |
Total withdrawal of fresh water for public supply: 23.82 millions of gallons per day (1% from ground, 99% from surface)
| Here: | 6.1 |
| State: | 6.3 |
| Here: | 4.9 |
| State: | 4.0 |
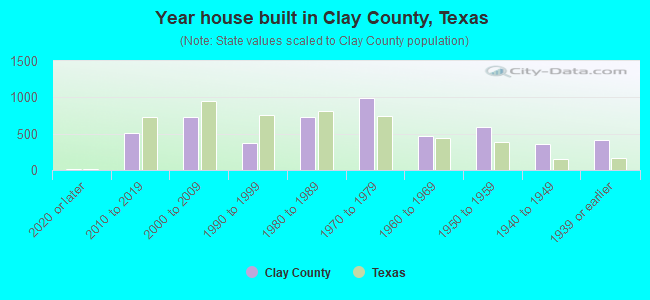
- Year house built in Clay County, Texas
- 202020 or later
- 5752010 to 2019
- 5642000 to 2009
- 3861990 to 1999
- 7441980 to 1989
- 9701970 to 1979
- 4891960 to 1969
- 6111950 to 1959
- 3151940 to 1949
- 4311939 or earlier
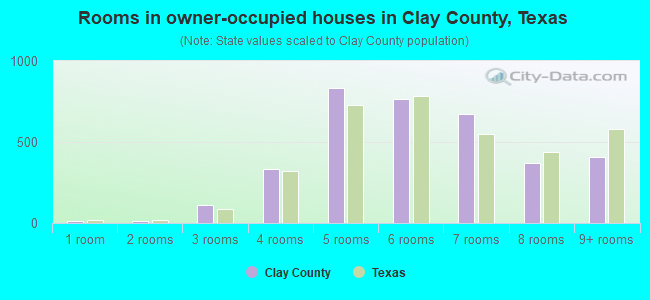
- Rooms in owner-occupied houses in Clay County, Texas
- 171 room
- 132 rooms
- 1203 rooms
- 3404 rooms
- 8275 rooms
- 8726 rooms
- 6877 rooms
- 4188 rooms
- 3249+ rooms
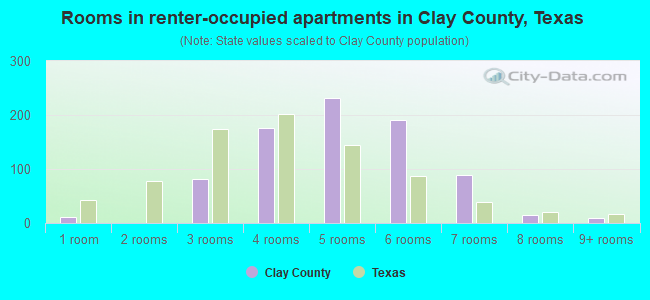
- Rooms in renter-occupied apartments in Clay County, Texas
- 241 room
- 02 rooms
- 723 rooms
- 2044 rooms
- 2115 rooms
- 1556 rooms
- 1107 rooms
- 268 rooms
- 29+ rooms
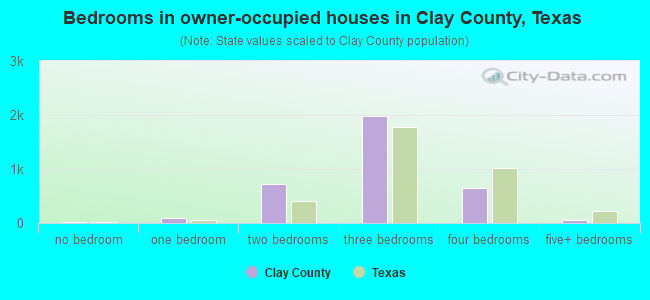
- Bedrooms in owner-occupied houses in Clay County, Texas
- 19no bedroom
- 861 bedroom
- 7772 bedrooms
- 2,1003 bedrooms
- 5654 bedrooms
- 525+ bedrooms
- Bedrooms in renter-occupied apartments in Clay County, Texas
- 24no bedroom
- 581 bedroom
- 2912 bedrooms
- 3633 bedrooms
- 794 bedrooms
- 05+ bedrooms
- Cars and other vehicles available in Clay County in owner-occupied houses/condos
- 69no vehicle
- 9041 vehicle
- 1,4382 vehicles
- 7793 vehicles
- 2774 vehicles
- 1545+ vehicles
- Cars and other vehicles available in Clay County in renter-occupied apartments
- 81no vehicle
- 3051 vehicle
- 3002 vehicles
- 993 vehicles
- 344 vehicles
- 05+ vehicles
88.7% of Clay County residents lived in the same house 1 years ago.
Out of people who lived in different houses, 21% lived in this county.
Out of people who lived in different counties, 76% lived in Texas.
| Clay County: | 88.7% |
| State average: | 85.7% |
Place of birth for U.S.-born residents:
- This state: 8,051
- Other state: 2,057
- Northeast: 218
- Midwest: 355
- South: 736
- West: 756
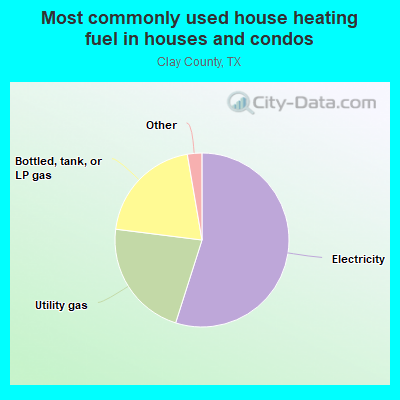
- 57.5%Electricity
- 21.7%Utility gas
- 18.3%Bottled, tank, or LP gas
- 1.2%Wood
- 0.8%Other fuel
- 0.6%No fuel used
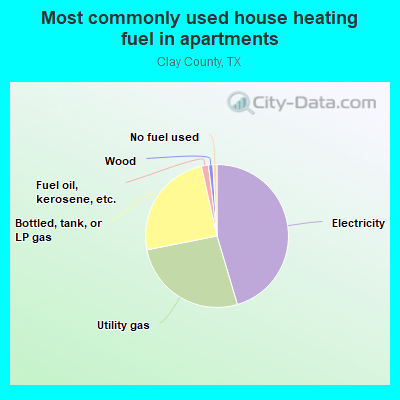
- 43.9%Electricity
- 29.5%Utility gas
- 22.9%Bottled, tank, or LP gas
- 2.9%Fuel oil, kerosene, etc.
- 0.8%No fuel used
Private vs. public school enrollment:
| Here: | 7.0% |
| Texas: | 8.8% |
| Here: | 13.1% |
| Texas: | 8.0% |
| Here: | 1.4% |
| Texas: | 16.2% |
Clay County government finances - Expenditure in 2017:
- Charges - Hospital Public: $12,000,000
- Construction - Hospitals: $25,000
- Current Operations - Hospitals: $6,000,000
Regular Highways: $3,231,000
Police Protection: $2,195,000
General - Other: $1,896,000
Judicial and Legal Services: $775,000
Central Staff Services: $668,000
Financial Administration: $220,000
Public Welfare, Vendor Payments for Medical Care: $175,000
General Public Buildings: $143,000
Natural Resources - Other: $103,000
Local Fire Protection: $43,000
- Local Intergovernmental - Health and Hospitals: $150,000
- Miscellaneous - General Revenue - Other: $1,151,000
Fines and Forfeits: $537,000
Sale of Property: $374,000
Interest Earnings: $1,000
- Other Capital Outlay - Regular Highways: $367,000
Hospitals: $100,000
- Other Funds - Cash and Securities: $6,056,000
- State Intergovernmental - General Local Government Support: $924,000
Highways: $153,000
- Tax - Property: $4,881,000
Motor Vehicle License: $480,000
Other License: $155,000
- Total Salaries and Wages: $3,500,000
Clay County government finances - Revenue in 2017:
- Charges - Hospital Public: $12,000,000
- Construction - Hospitals: $25,000
- Current Operations - Hospitals: $6,000,000
Regular Highways: $3,231,000
Police Protection: $2,195,000
General - Other: $1,896,000
Judicial and Legal Services: $775,000
Central Staff Services: $668,000
Financial Administration: $220,000
Public Welfare, Vendor Payments for Medical Care: $175,000
General Public Buildings: $143,000
Natural Resources - Other: $103,000
Local Fire Protection: $43,000
- Local Intergovernmental - Health and Hospitals: $150,000
- Miscellaneous - General Revenue - Other: $1,151,000
Fines and Forfeits: $537,000
Sale of Property: $374,000
Interest Earnings: $1,000
- Other Capital Outlay - Regular Highways: $367,000
Hospitals: $100,000
- Other Funds - Cash and Securities: $6,056,000
- State Intergovernmental - General Local Government Support: $924,000
Highways: $153,000
- Tax - Property: $4,881,000
Motor Vehicle License: $480,000
Other License: $155,000
- Total Salaries and Wages: $3,500,000
Clay County government finances - Debt in 2017:
- Charges - Hospital Public: $12,000,000
- Construction - Hospitals: $25,000
- Current Operations - Hospitals: $6,000,000
Regular Highways: $3,231,000
Police Protection: $2,195,000
General - Other: $1,896,000
Judicial and Legal Services: $775,000
Central Staff Services: $668,000
Financial Administration: $220,000
Public Welfare, Vendor Payments for Medical Care: $175,000
General Public Buildings: $143,000
Natural Resources - Other: $103,000
Local Fire Protection: $43,000
- Local Intergovernmental - Health and Hospitals: $150,000
- Miscellaneous - General Revenue - Other: $1,151,000
Fines and Forfeits: $537,000
Sale of Property: $374,000
Interest Earnings: $1,000
- Other Capital Outlay - Regular Highways: $367,000
Hospitals: $100,000
- Other Funds - Cash and Securities: $6,056,000
- State Intergovernmental - General Local Government Support: $924,000
Highways: $153,000
- Tax - Property: $4,881,000
Motor Vehicle License: $480,000
Other License: $155,000
- Total Salaries and Wages: $3,500,000
Clay County government finances - Cash and Securities in 2017:
- Charges - Hospital Public: $12,000,000
- Construction - Hospitals: $25,000
- Current Operations - Hospitals: $6,000,000
Regular Highways: $3,231,000
Police Protection: $2,195,000
General - Other: $1,896,000
Judicial and Legal Services: $775,000
Central Staff Services: $668,000
Financial Administration: $220,000
Public Welfare, Vendor Payments for Medical Care: $175,000
General Public Buildings: $143,000
Natural Resources - Other: $103,000
Local Fire Protection: $43,000
- Local Intergovernmental - Health and Hospitals: $150,000
- Miscellaneous - General Revenue - Other: $1,151,000
Fines and Forfeits: $537,000
Sale of Property: $374,000
Interest Earnings: $1,000
- Other Capital Outlay - Regular Highways: $367,000
Hospitals: $100,000
- Other Funds - Cash and Securities: $6,056,000
- State Intergovernmental - General Local Government Support: $924,000
Highways: $153,000
- Tax - Property: $4,881,000
Motor Vehicle License: $480,000
Other License: $155,000
- Total Salaries and Wages: $3,500,000
Supplemental Security Income (SSI) in 2006:
- Total number of recipients: 191
- Number of aged recipients: 23
- Number of blind and disabled recipients: 168
- Number of recipients under 18: 23
- Number of recipients between 18 and 64: 131
- Number of recipients older than 64: 37
- Number of recipients also receiving OASDI: 89
- Amount of payments (thousands of dollars): 77
| Most common first names in Clay County, TX among deceased individuals | ||
| Name | Count | Lived (average) |
|---|---|---|
| Mary | 283 | 78.1 years |
| John | 279 | 76.8 years |
| James | 260 | 71.8 years |
| William | 223 | 75.4 years |
| Robert | 158 | 72.9 years |
| Willie | 132 | 75.9 years |
| Charles | 130 | 70.6 years |
| George | 122 | 76.9 years |
| Henry | 93 | 77.6 years |
| Joe | 85 | 71.9 years |
| Most common last names in Clay County, TX among deceased individuals | ||
| Last name | Count | Lived (average) |
|---|---|---|
| Smith | 139 | 75.1 years |
| Williams | 138 | 76.0 years |
| Johnson | 121 | 74.9 years |
| Davis | 118 | 75.4 years |
| Brown | 115 | 75.5 years |
| Jones | 113 | 73.7 years |
| Jackson | 76 | 74.8 years |
| Moore | 67 | 74.2 years |
| Taylor | 62 | 72.9 years |
| Thompson | 57 | 73.8 years |
| Businesses in Clay County, TX | ||||
| Name | Count | Name | Count | |
|---|---|---|---|---|
| Best Western | 1 | SONIC Drive-In | 1 | |
| Chevrolet | 1 | Subway | 1 | |
| Dairy Queen | 1 | UPS | 1 | |
| H&R Block | 1 | |||
Clay County on our top lists:
- #95 on the list of "Top 101 counties with highest percentage of residents voting for Romney (Republican) in the 2012 Presidential Election"