Percentage of residents living in poverty in 2022: 2.0%
(2.3% for White Non-Hispanic residents, 0.5% for Hispanic or Latino residents, 1.6% for other race residents)
According to our research of Indiana and other state lists, there was 1 registered sex offender living in St. John, Indiana as of May 26, 2024. The ratio of all residents to sex offenders in St. John is 15,652 to 1. The ratio of registered sex offenders to all residents in this city is much lower than the state average.
Crime rates in St. John by year
Type
2009
2010
2011
2012
2013
2014
2015
2016
2017
2018
2019
2020
2021
2022
Murders (per 100,000)
0 (0.0)
0 (0.0)
0 (0.0)
0 (0.0)
0 (0.0)
0 (0.0)
1 (6.1)
0 (0.0)
0 (0.0)
0 (0.0)
0 (0.0)
0 (0.0)
0 (0.0)
0 (0.0)
Rapes (per 100,000)
1 (7.3)
0 (0.0)
0 (0.0)
1 (6.7)
0 (0.0)
0 (0.0)
0 (0.0)
2 (11.9)
0 (0.0)
1 (5.7)
1 (5.4)
1 (5.2)
0 (0.0)
0 (0.0)
Robberies (per 100,000)
1 (7.3)
1 (6.7)
1 (6.7)
1 (6.7)
0 (0.0)
0 (0.0)
1 (6.1)
1 (5.9)
1 (5.8)
0 (0.0)
3 (16.2)
0 (0.0)
1 (5.0)
0 (0.0)
Assaults (per 100,000)
0 (0.0)
0 (0.0)
13 (87.1)
6 (40.3)
3 (19.4)
5 (31.5)
1 (6.1)
1 (5.9)
1 (5.8)
2 (11.4)
0 (0.0)
3 (15.6)
0 (0.0)
1 (4.4)
Burglaries (per 100,000)
16 (117.5)
10 (67.3)
24 (160.8)
18 (120.9)
17 (109.9)
26 (163.8)
8 (48.7)
20 (118.9)
21 (122.6)
15 (85.2)
11 (59.5)
5 (25.9)
2 (9.9)
7 (31.1)
Thefts (per 100,000)
125 (918.0)
156 (1,051)
140 (938.0)
116 (779.3)
119 (769.1)
72 (453.7)
78 (474.7)
101 (600.4)
109 (636.4)
89 (505.3)
105 (568.2)
65 (337.0)
35 (173.5)
50 (222.3)
Auto thefts (per 100,000)
12 (88.1)
5 (33.7)
9 (60.3)
5 (33.6)
3 (19.4)
3 (18.9)
1 (6.1)
3 (17.8)
13 (75.9)
7 (39.7)
8 (43.3)
9 (46.7)
3 (14.9)
0 (0.0)
Arson (per 100,000)
0 (0.0)
0 (0.0)
0 (0.0)
0 (0.0)
0 (0.0)
0 (0.0)
0 (0.0)
0 (0.0)
0 (0.0)
0 (0.0)
0 (0.0)
1 (5.2)
0 (0.0)
1 (4.4)
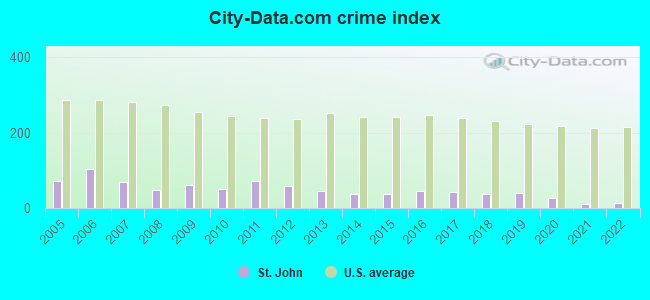
City-Data.com crime index
60.1
51.4
73.0
57.8
43.9
37.4
38.1
46.2
43.0
36.2
39.6
26.3
10.3
12.0
The City-Data.com crime index weighs serious crimes and violent crimes more heavily. Higher means more crime, U.S. average is 246.1. It adjusts for the number of visitors and daily workers commuting into cities.
Latest news from St. John, IN collected exclusively by city-data.com from local newspapers, TV, and radio stations
Ancestries: Polish (18.9%), German (9.4%), Dutch (8.9%), Italian (7.7%), Irish (6.7%), English (5.6%).
Current Local Time: CST time zone
Elevation: 750 feet
Land area: 6.72 square miles.
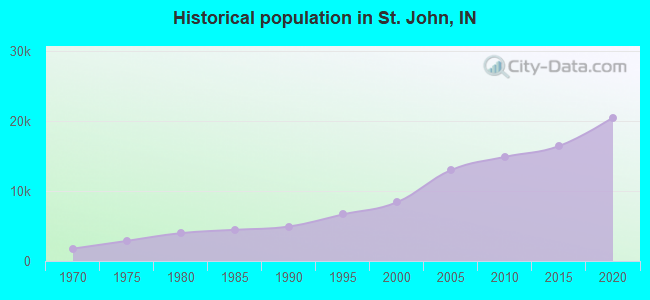
Population density: 3,398 people per square mile (average).
1,282 residents are foreign born (2.4% Europe, 1.5% Asia, 1.5% Latin America).
This town:
6.2%
Indiana:
5.6%
Median real estate property taxes paid for housing units with mortgages in 2022: $3,682 (0.9%) Median real estate property taxes paid for housing units with no mortgage in 2022: $3,392 (0.9%)
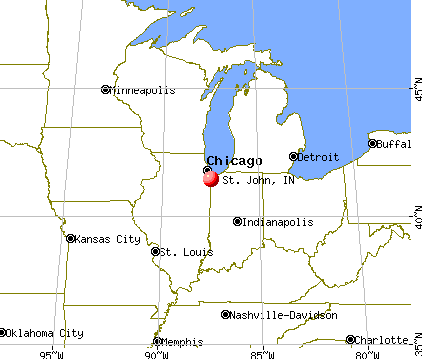
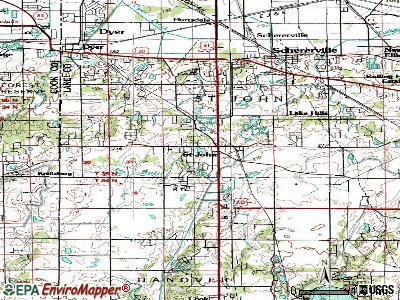
Nearest city with pop. 50,000+: Hammond, IN (11.3 miles , pop. 83,048).
Nearest city with pop. 200,000+: Chicago, IL (29.1 miles , pop. 2,896,016).
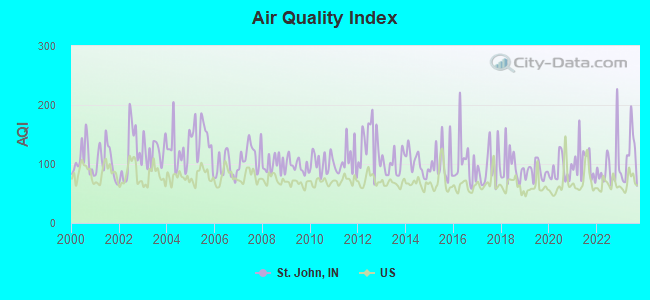
Air Quality Index (AQI) level in 2023 was 110. This is significantly worse than average.
City:
110
U.S.:
73
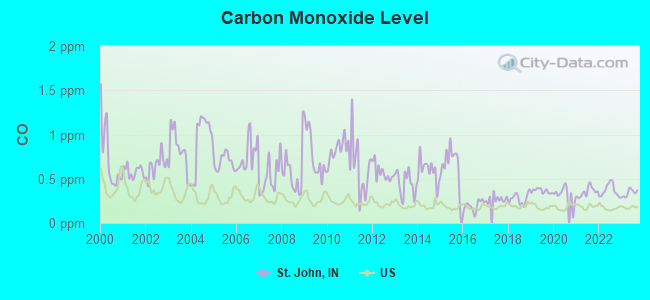
Carbon Monoxide (CO) [ppm] level in 2023 was 0.339. This is worse than average.Closest monitor was 9.9 miles away from the city center.
City:
0.339
U.S.:
0.251
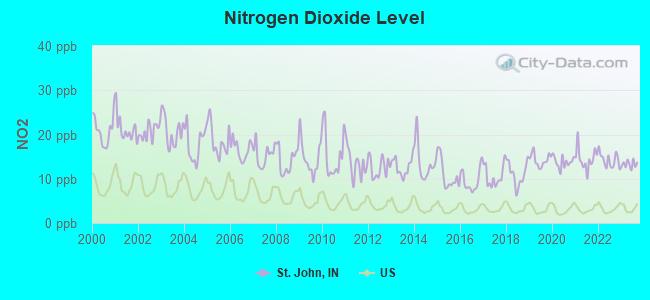
Nitrogen Dioxide (NO2) [ppb] level in 2023 was 13.3. This is significantly worse than average.Closest monitor was 7.5 miles away from the city center.
City:
13.3
U.S.:
5.1
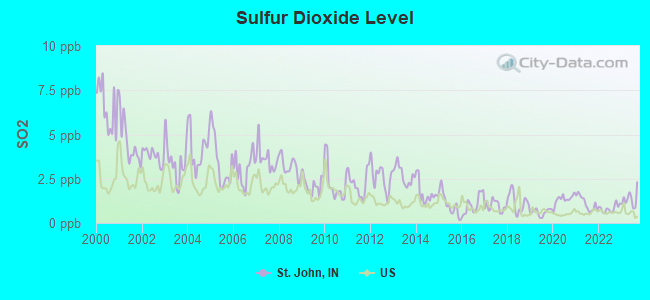
Sulfur Dioxide (SO2) [ppb] level in 2023 was 1.35. This is about average.Closest monitor was 7.5 miles away from the city center.
City:
1.35
U.S.:
1.51
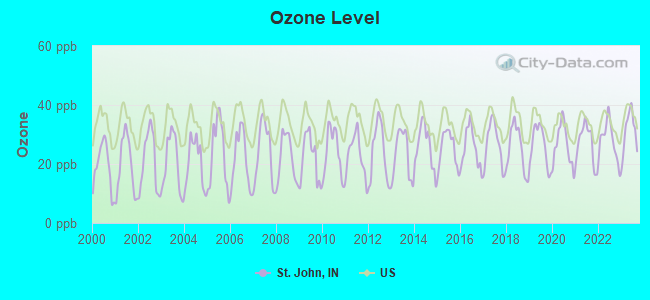
Ozone [ppb] level in 2023 was 31.1. This is about average.Closest monitor was 9.9 miles away from the city center.
City:
31.1
U.S.:
33.3
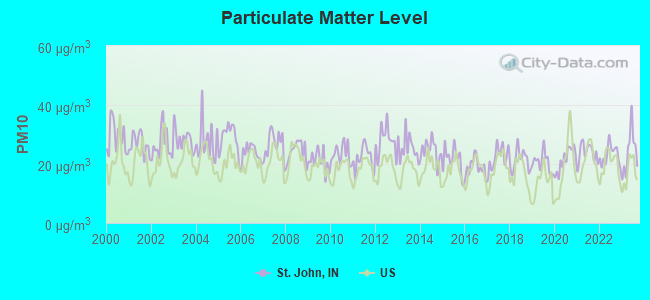
Particulate Matter (PM10) [µg/m3] level in 2023 was 24.0. This is worse than average.Closest monitor was 9.6 miles away from the city center.
City:
24.0
U.S.:
19.2
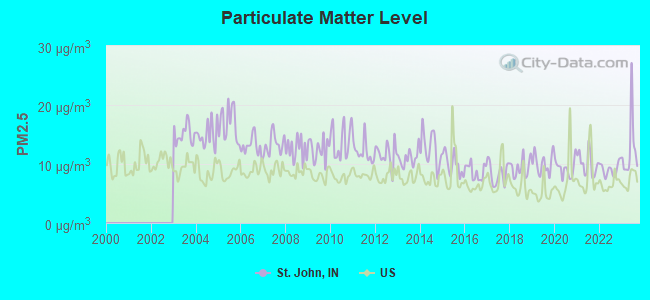
Particulate Matter (PM2.5) [µg/m3] level in 2023 was 12.4. This is significantly worse than average.Closest monitor was 7.3 miles away from the city center.
City:
12.4
U.S.:
8.1
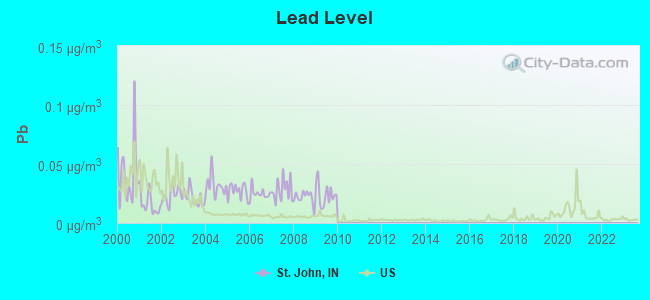
Lead (Pb) [µg/m3] level in 2009 was 0.0241. This is significantly worse than average.Closest monitor was 7.8 miles away from the city center.
City:
0.0241
U.S.:
0.0093
Tornado activity:
St. John-area historical tornado activity is slightly below Indiana state average. It is 65% greater than the overall U.S. average.
On 8/28/1990, a category F5 (max. wind speeds 261-318 mph) tornado 32.7 miles away from the St. John town center killed 29 peopleand injured 350 peopleand causedbetween $50,000 and $500,000 in damages.
On 4/21/1967, a category F4 (max. wind speeds 207-260 mph) tornado 19.9 miles away from the town center killed 33 peopleand injured 500 peopleand causedbetween $5,000,000 and $50,000,000 in damages.
Earthquake activity:
St. John-area historical earthquake activity is significantly above Indiana state average. It is 43% greater than the overall U.S. average.
On 4/18/2008 at 09:36:59, a magnitude 5.4 (5.1 MB, 4.8 MS, 5.4 MW, 5.2 MW, Class: Moderate, Intensity: VI - VII) earthquake occurred 208.4 miles away from St. John center On 6/10/1987 at 23:48:54, a magnitude 5.1 (4.9 MB, 4.4 MS, 4.6 MS, 5.1 LG) earthquake occurred 183.0 miles away from the city center On 4/18/2008 at 09:36:59, a magnitude 5.2 (5.2 MW, Depth: 8.9 mi) earthquake occurred 208.4 miles away from the city center On 6/28/2004 at 06:10:52, a magnitude 4.2 (4.2 MW, Depth: 6.2 mi, Class: Light, Intensity: IV - V) earthquake occurred 73.8 miles away from St. John center On 6/18/2002 at 17:37:15, a magnitude 5.0 (4.3 MB, 4.6 MW, 5.0 LG) earthquake occurred 239.9 miles away from the city center On 4/18/2008 at 15:14:16, a magnitude 4.8 (4.5 MB, 4.8 MW, 4.6 MW) earthquake occurred 206.5 miles away from St. John center Magnitude types: regional Lg-wave magnitude (LG), body-wave magnitude (MB), surface-wave magnitude (MS), moment magnitude (MW)
Natural disasters:
The number of natural disasters in Lake County (19) is greater than the US average (15). Major Disasters (Presidential) Declared: 12 Emergencies Declared: 5
Causes of natural disasters: Floods: 11, Storms: 10, Winter Storms: 5, Tornadoes: 3, Snowstorms: 2, Hurricane: 1, Snow: 1, Other: 1 (Note: some incidents may be assigned to more than one category).
Hospitals and medical centers near St. John:
TRADEWINDS REHAB CENTER INC (Hospital, about 1 miles away; ST JOHN, IN)
TRADEWINDS REHAB CENTER INC (Hospital, about 1 miles away; ST JOHN, IN)
DAVITA - ST. JOHN DIALYSIS (Dialysis Facility, about 2 miles away; ST JOHN, IN)
PROVIDENCE AT HOME INC (Home Health Center, about 2 miles away; SAINT JOHN, IN)
ASSURED HOME HEALTHCARE INC (Home Health Center, about 3 miles away; SCHERERVILLE, IN)
AMERICAN HOME HEALTH SERVICES INC (Home Health Center, about 4 miles away; DYER, IN)
KINDRED TRANSITIONAL CARE AND REHABILITATION-DYER (Nursing Home, about 4 miles away; DYER, IN)
Parks in St. John include: Prairie West Park (1), Lancer Park (2), Civic Memorial Park (3), James E Larimer Park (4), Timber Lane Park (5), Homestead Acres Park Number 1 (6), Homestead Acres Park Number 2 (7). Display/hide their locations on the map
Birthplace of: Jared Tomich - Football player.
Lake County has a predicted average indoor radon screening level between 2 and 4 pCi/L (pico curies per liter) - Moderate Potential
Drinking water stations with addresses in St. John and their reported violations in the past:
PALMIRA GOLF & COUNTRY CLUB (Population served: 129, Groundwater):
Past monitoring violations:
8 routine major monitoring violations
2 regular monitoring violations
Average household size:
This town:
2.9 people
Indiana:
2.5 people
Percentage of family households:
This town:
83.7%
Whole state:
66.9%
Percentage of households with unmarried partners:
This town:
3.2%
Whole state:
6.9%
Likely homosexual households (counted as self-reported same-sex unmarried-partner households)
Lesbian couples: 0.4% of all households
Gay men: 0.2% of all households
8 people in group homes intended for adults in 2010
8 people in homes for the mentally retarded in 2000
Banks with branches in St. John (2011 data):
JPMorgan Chase Bank, National Association: St. John Branch at 9600 Wicker Ave, branch established on 1967/02/15. Info updated 2011/11/10: Bank assets: $1,811,678.0 mil, Deposits: $1,190,738.0 mil, headquarters in Columbus, OH, positive income, International Specialization, 5577 total offices, Holding Company: Jpmorgan Chase & Co.
BMO Harris Bank National Association: St. John Branch at 9770 Wicker Avenue, branch established on 1979/07/25. Info updated 2011/07/14: Bank assets: $97,264.0 mil, Deposits: $75,624.6 mil, headquarters in Chicago, IL, positive income, 717 total offices, Holding Company: Bank Of Montreal
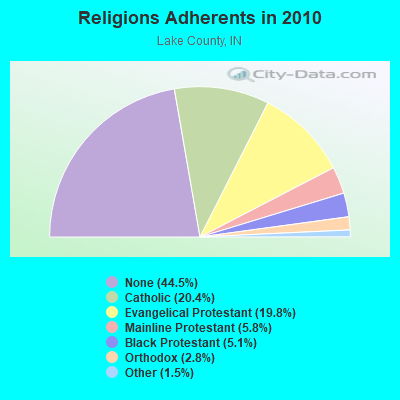
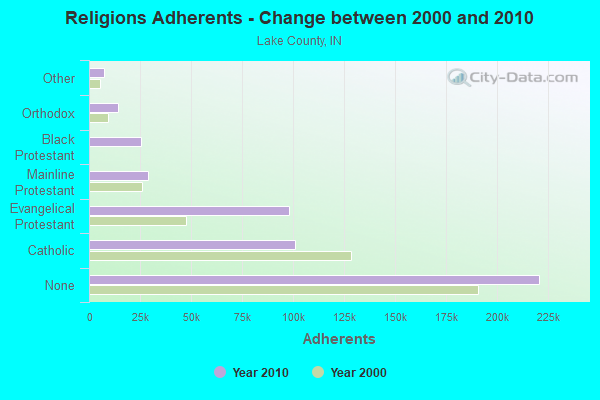
Religion statistics for St. John, IN (based on Lake County data)
Religion
Adherents
Congregations
Catholic
101,096
58
Evangelical Protestant
98,213
266
Mainline Protestant
28,943
78
Black Protestant
25,459
74
Orthodox
13,990
14
Other
7,460
29
None
220,844
-
Source: Clifford Grammich, Kirk Hadaway, Richard Houseal, Dale E.Jones, Alexei Krindatch, Richie Stanley and Richard H.Taylor. 2012. 2010 U.S.Religion Census: Religious Congregations & Membership Study. Association of Statisticians of American Religious Bodies. Jones, Dale E., et al. 2002. Congregations and Membership in the United States 2000. Nashville, TN: Glenmary Research Center. Graphs represent county-level data
Public Safety Building 11033 W. 93rd Ave. (Lat: 41.450000 Lon: -87.467833), Type: Pole, Structure height: 6 m, Overall height: 9 m, Call Sign: WQGT211, Assigned Frequencies: 1.67000 MHz, Grant Date: 01/27/2017, Expiration Date: 04/10/2027, Certifier: Michael S Fryzel, Registrant: Information Station Specialists, Zeeland, MI 49464, Phone: (616) 772-2300
GATES ELEVATED TANK, Gates Elevated Tank Near The Jct. Of Sagebrook & Bridlewood (Gates Subdivision) (Lat: 41.424000 Lon: -87.444167), Type: Tank, Structure height: 48 m, Call Sign: WQIX903, Assigned Frequencies: 451.062 MHz, Grant Date: 05/15/2018, Expiration Date: 06/16/2028, Certifier: Stephen Z Kil, Registrant: Town Of St John, 10955 W 93rd Ave, St John, IN 46373, Phone: (219) 365-6191, Email:
CEDAR CREEK, Cedar Creek Golf Course - Part Of The Se 1/4,Nw 1/4,Section 9, T34n,R9w (Lat: 41.414056 Lon: -87.461806), Type: Ltower, Structure height: 91.4 m, Overall height: 96 m, Call Sign: WQWI210, Assigned Frequencies: 154.175 MHz, Grant Date: 08/27/2015, Expiration Date: 09/27/2015, Cancellation Date: 11/28/2015, Certifier: Brian Hitchcock, Registrant: Mazzitello Professional Services Mps LLC, N7427 330th Street, Spring Valley, WI 54767, Phone: (715) 222-4440, Email:
CEDAR CREEK, Part Of The Se 1/4,Nw 1/4,Section 9, T34n,R9w, Lake County In (Lat: 41.414056 Lon: -87.461806), Type: Ltower, Structure height: 91.4 m, Overall height: 96 m, Call Sign: WQWX397, Assigned Frequencies: 154.815 MHz, Grant Date: 12/16/2015, Expiration Date: 12/16/2025, Certifier: Brian Hitchcock, Registrant: Spectrum And Licensing Services, 141 Lee Street, Hanover, PA 17331, Phone: (717) 630-0816, Fax: (717) 637-8300, Email:
AT304651, 10870 West 93rd Street ( St John In 7# 304651) (Lat: 41.450472 Lon: -87.465583), Type: Ltower, Structure height: 76.2 m, Overall height: 80.5 m, Call Sign: WQQS335, Assigned Frequencies: 6004.50 MHz, 6725.00 MHz, Grant Date: 02/21/2013, Expiration Date: 02/21/2023, Cancellation Date: 05/12/2016, Certifier: Brian Higgins, Registrant: Eg Broadcast Newco Corp, 1209 Orange St, Wilmington, DE 19801, Phone: (212) 464-2568, Email:
CEDAR CREEK, Part Of The Se 1/4,Nw 1/4,Section 9, T34n,R9w, Lake County In (Lat: 41.414083 Lon: -87.461833), Type: Ltower, Structure height: 91.4 m, Overall height: 96 m, Call Sign: WQWH768, Licensee ID: L01961691, Assigned Frequencies: 6063.80 MHz, 6063.80 MHz, 6063.80 MHz, 6063.80 MHz, Grant Date: 08/26/2015, Expiration Date: 08/26/2025, Certifier: Brian Hitchcock, Registrant: Lake County Indiana 911, 2293 N Main Street, Crown Point, IN 46307, Phone: (219) 755-6501, Email:
CEDAR CREEK, Part Of The Se 1/4,Nw 1/4,Section 9, T34n,R9w, Lake County In (Lat: 41.414083 Lon: -87.461833), Type: Ltower, Structure height: 91.4 m, Overall height: 96 m, Call Sign: WQWK989, Licensee ID: L01961691, Assigned Frequencies: 6004.50 MHz, 6004.50 MHz, 6004.50 MHz, 6004.50 MHz, Grant Date: 09/24/2015, Expiration Date: 09/24/2025, Certifier: Brian Hitchcock, Registrant: Lake County Indiana 911, 2293 N Main Street, Crown Point, IN 46307, Phone: (219) 755-6501, Email:
BINGO LAKE, Alexander St And W 85th Ave (Lat: 41.464917 Lon: -87.464806), Type: Mtower, Structure height: 53.3 m, Call Sign: WRYB615, Licensee ID: L00004803, Assigned Frequencies: 11285.0 MHz, 11285.0 MHz, 11285.0 MHz, 11285.0 MHz, 11285.0 MHz, 11285.0 MHz, 11285.0 MHz, 11285.0 MHz, 11285.0 MHz, 11285.0 MHz, 11285.0 MHz, Grant Date: 07/20/2023, Expiration Date: 07/20/2033, Certifier: Clifford Burns, Registrant: Northern Indiana Public Service Company, 801 East 86th Ave, Merrillville, IN 46410, Phone: (219) 781-7261, Fax: (219) 886-5844, Email:
KREIGHTSBURG, 1450 Ft E Of Us 41 And 1000 Ft S Of Us 231 2.0 Mi S Of (Lat: 41.418083 Lon: -87.464750), Type: Mast, Structure height: 53.6 m, Call Sign: WHJ971, Licensee ID: L00004803, Assigned Frequencies: 6735.00 MHz, Grant Date: 09/14/2018, Expiration Date: 09/30/2028, Registrant: Northern Indiana Public Service Company, 801 East 86th Ave, Merrillville, IN 46410, Phone: (219) 781-7261, Fax: (219) 886-5844, Email:
FCC Registered Amateur Radio Licenses:
2
Call Sign: W9GWR, Previous Call Sign: KG9CG, Licensee ID: L00151844, Grant Date: 02/12/2020, Expiration Date: 03/07/2030, Certifier: George W Reichert, Registrant: George W Reichert, 14733 Coral St., St. John, IN 46311
Call Sign: KD9CGX, Licensee ID: L01897922, Grant Date: 10/14/2014, Expiration Date: 10/14/2024, Certifier: Richard W Erman, Registrant: Richard W Erman, 12166 W 95th Place, St. John, IN 46373
Home Mortgage Disclosure Act Aggregated Statistics For Year 2009 (Based on 2 partial tracts)
A) FHA, FSA/RHS & VA Home Purchase Loans
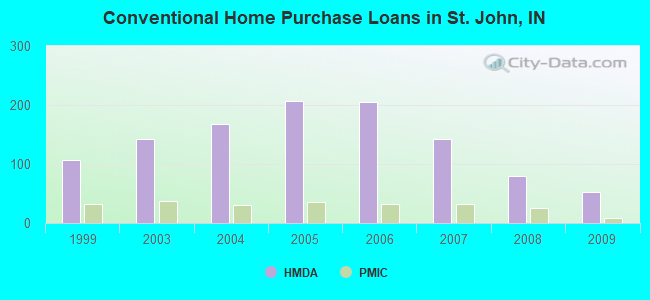
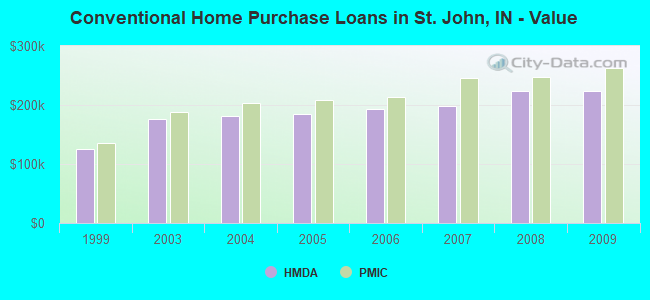
B) Conventional Home Purchase Loans
C) Refinancings
D) Home Improvement Loans
F) Non-occupant Loans on < 5 Family Dwellings (A B C & D)
G) Loans On Manufactured Home Dwelling (A B C & D)
Number
Average Value
Number
Average Value
Number
Average Value
Number
Average Value
Number
Average Value
Number
Average Value
LOANS ORIGINATED
20
$220,604
52
$223,053
363
$199,033
9
$111,053
4
$222,375
1
$155,020
APPLICATIONS APPROVED, NOT ACCEPTED
2
$216,925
3
$243,830
31
$215,761
0
$0
0
$0
0
$0
APPLICATIONS DENIED
2
$187,635
6
$271,672
79
$225,507
4
$127,212
1
$114,820
0
$0
APPLICATIONS WITHDRAWN
1
$360,570
2
$263,310
50
$228,742
2
$198,805
2
$146,865
1
$97,660
FILES CLOSED FOR INCOMPLETENESS
1
$195,640
2
$189,510
15
$223,039
1
$158,580
0
$0
0
$0
Aggregated Statistics For Year 2008 (Based on 2 partial tracts)
A) FHA, FSA/RHS & VA Home Purchase Loans
B) Conventional Home Purchase Loans
C) Refinancings
D) Home Improvement Loans
F) Non-occupant Loans on < 5 Family Dwellings (A B C & D)
G) Loans On Manufactured Home Dwelling (A B C & D)
Number
Average Value
Number
Average Value
Number
Average Value
Number
Average Value
Number
Average Value
Number
Average Value
LOANS ORIGINATED
12
$244,862
79
$223,236
143
$208,727
13
$96,897
5
$177,972
1
$168,950
APPLICATIONS APPROVED, NOT ACCEPTED
1
$311,010
8
$210,764
15
$192,325
2
$29,645
1
$180,710
0
$0
APPLICATIONS DENIED
4
$232,995
8
$282,464
51
$251,400
6
$80,422
2
$231,550
1
$185,770
APPLICATIONS WITHDRAWN
0
$0
6
$208,765
25
$205,731
1
$156,930
0
$0
0
$0
FILES CLOSED FOR INCOMPLETENESS
0
$0
2
$257,585
8
$231,448
0
$0
0
$0
0
$0
Aggregated Statistics For Year 2007 (Based on 2 partial tracts)
A) FHA, FSA/RHS & VA Home Purchase Loans
B) Conventional Home Purchase Loans
C) Refinancings
D) Home Improvement Loans
F) Non-occupant Loans on < 5 Family Dwellings (A B C & D)
Number
Average Value
Number
Average Value
Number
Average Value
Number
Average Value
Number
Average Value
LOANS ORIGINATED
5
$250,862
142
$197,884
141
$195,330
24
$58,505
7
$179,291
APPLICATIONS APPROVED, NOT ACCEPTED
0
$0
11
$241,175
16
$223,111
3
$61,267
2
$156,730
APPLICATIONS DENIED
1
$326,890
18
$277,733
48
$224,097
12
$64,459
4
$212,030
APPLICATIONS WITHDRAWN
0
$0
8
$239,641
22
$226,070
3
$75,237
0
$0
FILES CLOSED FOR INCOMPLETENESS
0
$0
2
$248,535
6
$328,933
1
$109,370
0
$0
Aggregated Statistics For Year 2006 (Based on 2 partial tracts)
A) FHA, FSA/RHS & VA Home Purchase Loans
B) Conventional Home Purchase Loans
C) Refinancings
D) Home Improvement Loans
F) Non-occupant Loans on < 5 Family Dwellings (A B C & D)
Number
Average Value
Number
Average Value
Number
Average Value
Number
Average Value
Number
Average Value
LOANS ORIGINATED
5
$210,966
205
$192,902
124
$174,033
21
$42,551
8
$162,576
APPLICATIONS APPROVED, NOT ACCEPTED
0
$0
15
$220,979
20
$169,278
5
$36,414
1
$343,740
APPLICATIONS DENIED
1
$187,830
26
$211,049
58
$214,176
9
$71,836
2
$276,810
APPLICATIONS WITHDRAWN
0
$0
12
$184,061
41
$192,058
2
$81,065
1
$81,750
FILES CLOSED FOR INCOMPLETENESS
0
$0
5
$221,230
10
$198,408
1
$184,540
0
$0
Aggregated Statistics For Year 2005 (Based on 2 partial tracts)
A) FHA, FSA/RHS & VA Home Purchase Loans
B) Conventional Home Purchase Loans
C) Refinancings
D) Home Improvement Loans
F) Non-occupant Loans on < 5 Family Dwellings (A B C & D)
G) Loans On Manufactured Home Dwelling (A B C & D)
Number
Average Value
Number
Average Value
Number
Average Value
Number
Average Value
Number
Average Value
Number
Average Value
LOANS ORIGINATED
6
$201,952
207
$184,807
123
$186,055
21
$64,285
4
$159,815
1
$44,490
APPLICATIONS APPROVED, NOT ACCEPTED
1
$134,950
15
$178,858
16
$188,885
2
$37,395
0
$0
0
$0
APPLICATIONS DENIED
1
$177,960
17
$182,576
68
$176,915
12
$47,186
1
$230,950
0
$0
APPLICATIONS WITHDRAWN
0
$0
11
$159,921
50
$194,366
6
$76,828
1
$120,830
0
$0
FILES CLOSED FOR INCOMPLETENESS
1
$203,450
3
$225,820
12
$215,532
0
$0
0
$0
0
$0
Aggregated Statistics For Year 2004 (Based on 2 partial tracts)
A) FHA, FSA/RHS & VA Home Purchase Loans
B) Conventional Home Purchase Loans
C) Refinancings
D) Home Improvement Loans
F) Non-occupant Loans on < 5 Family Dwellings (A B C & D)
Number
Average Value
Number
Average Value
Number
Average Value
Number
Average Value
Number
Average Value
LOANS ORIGINATED
3
$152,387
168
$181,161
146
$165,733
23
$61,887
4
$118,398
APPLICATIONS APPROVED, NOT ACCEPTED
0
$0
11
$184,928
17
$171,221
2
$115,080
0
$0
APPLICATIONS DENIED
0
$0
15
$188,137
47
$164,213
10
$39,845
0
$0
APPLICATIONS WITHDRAWN
1
$103,790
8
$179,130
35
$180,755
3
$95,620
0
$0
FILES CLOSED FOR INCOMPLETENESS
0
$0
3
$160,153
13
$172,239
1
$16,850
0
$0
Aggregated Statistics For Year 2003 (Based on 2 partial tracts)
A) FHA, FSA/RHS & VA Home Purchase Loans
B) Conventional Home Purchase Loans
C) Refinancings
D) Home Improvement Loans
F) Non-occupant Loans on < 5 Family Dwellings (A B C & D)
Number
Average Value
Number
Average Value
Number
Average Value
Number
Average Value
Number
Average Value
LOANS ORIGINATED
2
$166,455
142
$175,485
390
$145,354
15
$41,255
3
$134,403
APPLICATIONS APPROVED, NOT ACCEPTED
1
$176,730
7
$174,011
33
$150,003
2
$74,780
1
$161,240
APPLICATIONS DENIED
0
$0
7
$147,341
60
$136,501
7
$34,074
2
$90,495
APPLICATIONS WITHDRAWN
0
$0
9
$149,233
54
$151,869
1
$32,790
0
$0
FILES CLOSED FOR INCOMPLETENESS
0
$0
1
$206,730
10
$183,633
0
$0
0
$0
Aggregated Statistics For Year 1999 (Based on 1 partial tract)
A) FHA, FSA/RHS & VA Home Purchase Loans
B) Conventional Home Purchase Loans
C) Refinancings
D) Home Improvement Loans
E) Loans on Dwellings For 5+ Families
F) Non-occupant Loans on < 5 Family Dwellings (A B C & D)
Detailed PMIC statistics for the following Tracts:0426.03
, 0426.05
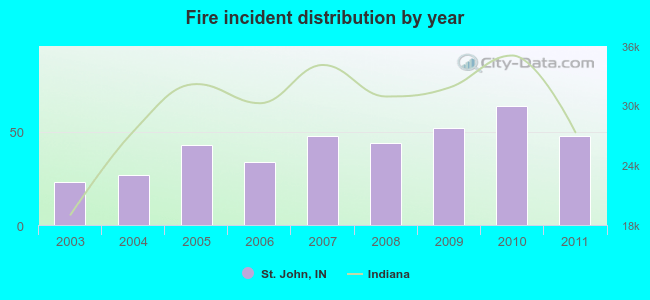
2003 - 2011 National Fire Incident Reporting System (NFIRS) incidents
According to the data from the years 2003 - 2011 the average number of fire incidents per year is 43. The highest number of reported fire incidents - 64 took place in 2010, and the least - 23 in 2003. The data has an increasing trend.
When looking into fire subcategories, the most incidents belonged to: Outside Fires (56.9%), and Structure Fires (20.1%).
Fire incident types reported to NFIRS in St. John, IN


 Recent articles from our blog. Our writers, many of them Ph.D. graduates or candidates, create easy-to-read articles on a wide variety of topics.

 (11.3 miles


 According to the data from the years 2003 - 2011 the average number of fire incidents per year is 43. The highest number of reported fire incidents - 64 took place in 2010, and the least - 23 in 2003. The data has an increasing trend.
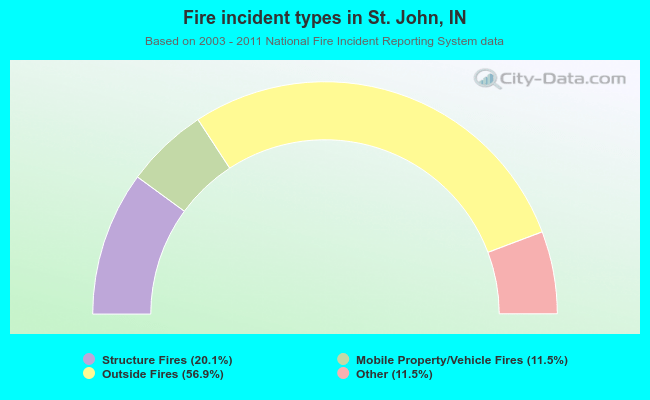 When looking into fire subcategories, the most incidents belonged to: Outside Fires (56.9%), and Structure Fires (20.1%).