Port Deposit, Maryland Submit your own pictures of this town and show them to the world
OSM Map
General Map
Google Map
MSN Map
OSM Map
General Map
Google Map
MSN Map
OSM Map
General Map
Google Map
MSN Map
OSM Map
General Map
Google Map
MSN Map
Please wait while loading the map...
Population in 2022: 621 (86% urban, 14% rural). Population change since 2000: -8.1%Males: 265 Females: 356
March 2022 cost of living index in Port Deposit: 102.0 (near average, U.S. average is 100) Percentage of residents living in poverty in 2022: 24.4%for White Non-Hispanic residents , 38.0% for Black residents , 6.2% for Hispanic or Latino residents , 44.4% for two or more races residents )Business Search - 14 Million verified businesses
Data:
Median household income ($)
Median household income (% change since 2000)
Household income diversity
Ratio of average income to average house value (%)
Ratio of average income to average rent
Median household income ($) - White
Median household income ($) - Black or African American
Median household income ($) - Asian
Median household income ($) - Hispanic or Latino
Median household income ($) - American Indian and Alaska Native
Median household income ($) - Multirace
Median household income ($) - Other Race
Median household income for houses/condos with a mortgage ($)
Median household income for apartments without a mortgage ($)
Races - White alone (%)
Races - White alone (% change since 2000)
Races - Black alone (%)
Races - Black alone (% change since 2000)
Races - American Indian alone (%)
Races - American Indian alone (% change since 2000)
Races - Asian alone (%)
Races - Asian alone (% change since 2000)
Races - Hispanic (%)
Races - Hispanic (% change since 2000)
Races - Native Hawaiian and Other Pacific Islander alone (%)
Races - Native Hawaiian and Other Pacific Islander alone (% change since 2000)
Races - Two or more races (%)
Races - Two or more races (% change since 2000)
Races - Other race alone (%)
Races - Other race alone (% change since 2000)
Racial diversity
Unemployment (%)
Unemployment (% change since 2000)
Unemployment (%) - White
Unemployment (%) - Black or African American
Unemployment (%) - Asian
Unemployment (%) - Hispanic or Latino
Unemployment (%) - American Indian and Alaska Native
Unemployment (%) - Multirace
Unemployment (%) - Other Race
Population density (people per square mile)
Population - Males (%)
Population - Females (%)
Population - Males (%) - White
Population - Males (%) - Black or African American
Population - Males (%) - Asian
Population - Males (%) - Hispanic or Latino
Population - Males (%) - American Indian and Alaska Native
Population - Males (%) - Multirace
Population - Males (%) - Other Race
Population - Females (%) - White
Population - Females (%) - Black or African American
Population - Females (%) - Asian
Population - Females (%) - Hispanic or Latino
Population - Females (%) - American Indian and Alaska Native
Population - Females (%) - Multirace
Population - Females (%) - Other Race
Coronavirus confirmed cases (Jun 10, 2024)
Deaths caused by coronavirus (Jun 10, 2024)
Coronavirus confirmed cases (per 100k population) (Jun 10, 2024)
Deaths caused by coronavirus (per 100k population) (Jun 10, 2024)
Daily increase in number of cases (Jun 10, 2024)
Weekly increase in number of cases (Jun 10, 2024)
Cases doubled (in days) (Jun 10, 2024)
Hospitalized patients (Apr 18, 2022)
Negative test results (Apr 18, 2022)
Total test results (Apr 18, 2022)
COVID Vaccine doses distributed (per 100k population) (Sep 19, 2023)
COVID Vaccine doses administered (per 100k population) (Sep 19, 2023)
COVID Vaccine doses distributed (Sep 19, 2023)
COVID Vaccine doses administered (Sep 19, 2023)
Likely homosexual households (%)
Likely homosexual households (% change since 2000)
Likely homosexual households - Lesbian couples (%)
Likely homosexual households - Lesbian couples (% change since 2000)
Likely homosexual households - Gay men (%)
Likely homosexual households - Gay men (% change since 2000)
Cost of living index
Median gross rent ($)
Median contract rent ($)
Median monthly housing costs ($)
Median house or condo value ($)
Median house or condo value ($ change since 2000)
Mean house or condo value by units in structure - 1, detached ($)
Mean house or condo value by units in structure - 1, attached ($)
Mean house or condo value by units in structure - 2 ($)
Mean house or condo value by units in structure by units in structure - 3 or 4 ($)
Mean house or condo value by units in structure - 5 or more ($)
Mean house or condo value by units in structure - Boat, RV, van, etc. ($)
Mean house or condo value by units in structure - Mobile home ($)
Median house or condo value ($) - White
Median house or condo value ($) - Black or African American
Median house or condo value ($) - Asian
Median house or condo value ($) - Hispanic or Latino
Median house or condo value ($) - American Indian and Alaska Native
Median house or condo value ($) - Multirace
Median house or condo value ($) - Other Race
Median resident age
Resident age diversity
Median resident age - Males
Median resident age - Females
Median resident age - White
Median resident age - Black or African American
Median resident age - Asian
Median resident age - Hispanic or Latino
Median resident age - American Indian and Alaska Native
Median resident age - Multirace
Median resident age - Other Race
Median resident age - Males - White
Median resident age - Males - Black or African American
Median resident age - Males - Asian
Median resident age - Males - Hispanic or Latino
Median resident age - Males - American Indian and Alaska Native
Median resident age - Males - Multirace
Median resident age - Males - Other Race
Median resident age - Females - White
Median resident age - Females - Black or African American
Median resident age - Females - Asian
Median resident age - Females - Hispanic or Latino
Median resident age - Females - American Indian and Alaska Native
Median resident age - Females - Multirace
Median resident age - Females - Other Race
Commute - mean travel time to work (minutes)
Travel time to work - Less than 5 minutes (%)
Travel time to work - Less than 5 minutes (% change since 2000)
Travel time to work - 5 to 9 minutes (%)
Travel time to work - 5 to 9 minutes (% change since 2000)
Travel time to work - 10 to 19 minutes (%)
Travel time to work - 10 to 19 minutes (% change since 2000)
Travel time to work - 20 to 29 minutes (%)
Travel time to work - 20 to 29 minutes (% change since 2000)
Travel time to work - 30 to 39 minutes (%)
Travel time to work - 30 to 39 minutes (% change since 2000)
Travel time to work - 40 to 59 minutes (%)
Travel time to work - 40 to 59 minutes (% change since 2000)
Travel time to work - 60 to 89 minutes (%)
Travel time to work - 60 to 89 minutes (% change since 2000)
Travel time to work - 90 or more minutes (%)
Travel time to work - 90 or more minutes (% change since 2000)
Marital status - Never married (%)
Marital status - Now married (%)
Marital status - Separated (%)
Marital status - Widowed (%)
Marital status - Divorced (%)
Median family income ($)
Median family income (% change since 2000)
Median non-family income ($)
Median non-family income (% change since 2000)
Median per capita income ($)
Median per capita income (% change since 2000)
Median family income ($) - White
Median family income ($) - Black or African American
Median family income ($) - Asian
Median family income ($) - Hispanic or Latino
Median family income ($) - American Indian and Alaska Native
Median family income ($) - Multirace
Median family income ($) - Other Race
Median year house/condo built
Median year apartment built
Year house built - Built 2005 or later (%)
Year house built - Built 2000 to 2004 (%)
Year house built - Built 1990 to 1999 (%)
Year house built - Built 1980 to 1989 (%)
Year house built - Built 1970 to 1979 (%)
Year house built - Built 1960 to 1969 (%)
Year house built - Built 1950 to 1959 (%)
Year house built - Built 1940 to 1949 (%)
Year house built - Built 1939 or earlier (%)
Average household size
Household density (households per square mile)
Average household size - White
Average household size - Black or African American
Average household size - Asian
Average household size - Hispanic or Latino
Average household size - American Indian and Alaska Native
Average household size - Multirace
Average household size - Other Race
Occupied housing units (%)
Vacant housing units (%)
Owner occupied housing units (%)
Renter occupied housing units (%)
Vacancy status - For rent (%)
Vacancy status - For sale only (%)
Vacancy status - Rented or sold, not occupied (%)
Vacancy status - For seasonal, recreational, or occasional use (%)
Vacancy status - For migrant workers (%)
Vacancy status - Other vacant (%)
Residents with income below the poverty level (%)
Residents with income below 50% of the poverty level (%)
Children below poverty level (%)
Poor families by family type - Married-couple family (%)
Poor families by family type - Male, no wife present (%)
Poor families by family type - Female, no husband present (%)
Poverty status for native-born residents (%)
Poverty status for foreign-born residents (%)
Poverty among high school graduates not in families (%)
Poverty among people who did not graduate high school not in families (%)
Residents with income below the poverty level (%) - White
Residents with income below the poverty level (%) - Black or African American
Residents with income below the poverty level (%) - Asian
Residents with income below the poverty level (%) - Hispanic or Latino
Residents with income below the poverty level (%) - American Indian and Alaska Native
Residents with income below the poverty level (%) - Multirace
Residents with income below the poverty level (%) - Other Race
Air pollution - Air Quality Index (AQI)
Air pollution - CO
Air pollution - NO2
Air pollution - SO2
Air pollution - Ozone
Air pollution - PM10
Air pollution - PM25
Air pollution - Pb
Crime - Murders per 100,000 population
Crime - Rapes per 100,000 population
Crime - Robberies per 100,000 population
Crime - Assaults per 100,000 population
Crime - Burglaries per 100,000 population
Crime - Thefts per 100,000 population
Crime - Auto thefts per 100,000 population
Crime - Arson per 100,000 population
Crime - City-data.com crime index
Crime - Violent crime index
Crime - Property crime index
Crime - Murders per 100,000 population (5 year average)
Crime - Rapes per 100,000 population (5 year average)
Crime - Robberies per 100,000 population (5 year average)
Crime - Assaults per 100,000 population (5 year average)
Crime - Burglaries per 100,000 population (5 year average)
Crime - Thefts per 100,000 population (5 year average)
Crime - Auto thefts per 100,000 population (5 year average)
Crime - Arson per 100,000 population (5 year average)
Crime - City-data.com crime index (5 year average)
Crime - Violent crime index (5 year average)
Crime - Property crime index (5 year average)
1996 Presidential Elections Results (%) - Democratic Party (Clinton)
1996 Presidential Elections Results (%) - Republican Party (Dole)
1996 Presidential Elections Results (%) - Other
2000 Presidential Elections Results (%) - Democratic Party (Gore)
2000 Presidential Elections Results (%) - Republican Party (Bush)
2000 Presidential Elections Results (%) - Other
2004 Presidential Elections Results (%) - Democratic Party (Kerry)
2004 Presidential Elections Results (%) - Republican Party (Bush)
2004 Presidential Elections Results (%) - Other
2008 Presidential Elections Results (%) - Democratic Party (Obama)
2008 Presidential Elections Results (%) - Republican Party (McCain)
2008 Presidential Elections Results (%) - Other
2012 Presidential Elections Results (%) - Democratic Party (Obama)
2012 Presidential Elections Results (%) - Republican Party (Romney)
2012 Presidential Elections Results (%) - Other
2016 Presidential Elections Results (%) - Democratic Party (Clinton)
2016 Presidential Elections Results (%) - Republican Party (Trump)
2016 Presidential Elections Results (%) - Other
2020 Presidential Elections Results (%) - Democratic Party (Biden)
2020 Presidential Elections Results (%) - Republican Party (Trump)
2020 Presidential Elections Results (%) - Other
Ancestries Reported - Arab (%)
Ancestries Reported - Czech (%)
Ancestries Reported - Danish (%)
Ancestries Reported - Dutch (%)
Ancestries Reported - English (%)
Ancestries Reported - French (%)
Ancestries Reported - French Canadian (%)
Ancestries Reported - German (%)
Ancestries Reported - Greek (%)
Ancestries Reported - Hungarian (%)
Ancestries Reported - Irish (%)
Ancestries Reported - Italian (%)
Ancestries Reported - Lithuanian (%)
Ancestries Reported - Norwegian (%)
Ancestries Reported - Polish (%)
Ancestries Reported - Portuguese (%)
Ancestries Reported - Russian (%)
Ancestries Reported - Scotch-Irish (%)
Ancestries Reported - Scottish (%)
Ancestries Reported - Slovak (%)
Ancestries Reported - Subsaharan African (%)
Ancestries Reported - Swedish (%)
Ancestries Reported - Swiss (%)
Ancestries Reported - Ukrainian (%)
Ancestries Reported - United States (%)
Ancestries Reported - Welsh (%)
Ancestries Reported - West Indian (%)
Ancestries Reported - Other (%)
Educational Attainment - No schooling completed (%)
Educational Attainment - Less than high school (%)
Educational Attainment - High school or equivalent (%)
Educational Attainment - Less than 1 year of college (%)
Educational Attainment - 1 or more years of college (%)
Educational Attainment - Associate degree (%)
Educational Attainment - Bachelor's degree (%)
Educational Attainment - Master's degree (%)
Educational Attainment - Professional school degree (%)
Educational Attainment - Doctorate degree (%)
School Enrollment - Nursery, preschool (%)
School Enrollment - Kindergarten (%)
School Enrollment - Grade 1 to 4 (%)
School Enrollment - Grade 5 to 8 (%)
School Enrollment - Grade 9 to 12 (%)
School Enrollment - College undergrad (%)
School Enrollment - Graduate or professional (%)
School Enrollment - Not enrolled in school (%)
School enrollment - Public schools (%)
School enrollment - Private schools (%)
School enrollment - Not enrolled (%)
Median number of rooms in houses and condos
Median number of rooms in apartments
Housing units lacking complete plumbing facilities (%)
Housing units lacking complete kitchen facilities (%)
Density of houses
Urban houses (%)
Rural houses (%)
Households with people 60 years and over (%)
Households with people 65 years and over (%)
Households with people 75 years and over (%)
Households with one or more nonrelatives (%)
Households with no nonrelatives (%)
Population in households (%)
Family households (%)
Nonfamily households (%)
Population in families (%)
Family households with own children (%)
Median number of bedrooms in owner occupied houses
Mean number of bedrooms in owner occupied houses
Median number of bedrooms in renter occupied houses
Mean number of bedrooms in renter occupied houses
Median number of vehichles in owner occupied houses
Mean number of vehichles in owner occupied houses
Median number of vehichles in renter occupied houses
Mean number of vehichles in renter occupied houses
Mortgage status - with mortgage (%)
Mortgage status - with second mortgage (%)
Mortgage status - with home equity loan (%)
Mortgage status - with both second mortgage and home equity loan (%)
Mortgage status - without a mortgage (%)
Average family size
Average family size - White
Average family size - Black or African American
Average family size - Asian
Average family size - Hispanic or Latino
Average family size - American Indian and Alaska Native
Average family size - Multirace
Average family size - Other Race
Geographical mobility - Same house 1 year ago (%)
Geographical mobility - Moved within same county (%)
Geographical mobility - Moved from different county within same state (%)
Geographical mobility - Moved from different state (%)
Geographical mobility - Moved from abroad (%)
Place of birth - Born in state of residence (%)
Place of birth - Born in other state (%)
Place of birth - Native, outside of US (%)
Place of birth - Foreign born (%)
Housing units in structures - 1, detached (%)
Housing units in structures - 1, attached (%)
Housing units in structures - 2 (%)
Housing units in structures - 3 or 4 (%)
Housing units in structures - 5 to 9 (%)
Housing units in structures - 10 to 19 (%)
Housing units in structures - 20 to 49 (%)
Housing units in structures - 50 or more (%)
Housing units in structures - Mobile home (%)
Housing units in structures - Boat, RV, van, etc. (%)
House/condo owner moved in on average (years ago)
Renter moved in on average (years ago)
Year householder moved into unit - Moved in 1999 to March 2000 (%)
Year householder moved into unit - Moved in 1995 to 1998 (%)
Year householder moved into unit - Moved in 1990 to 1994 (%)
Year householder moved into unit - Moved in 1980 to 1989 (%)
Year householder moved into unit - Moved in 1970 to 1979 (%)
Year householder moved into unit - Moved in 1969 or earlier (%)
Means of transportation to work - Drove car alone (%)
Means of transportation to work - Carpooled (%)
Means of transportation to work - Public transportation (%)
Means of transportation to work - Bus or trolley bus (%)
Means of transportation to work - Streetcar or trolley car (%)
Means of transportation to work - Subway or elevated (%)
Means of transportation to work - Railroad (%)
Means of transportation to work - Ferryboat (%)
Means of transportation to work - Taxicab (%)
Means of transportation to work - Motorcycle (%)
Means of transportation to work - Bicycle (%)
Means of transportation to work - Walked (%)
Means of transportation to work - Other means (%)
Working at home (%)
Industry diversity
Most Common Industries - Agriculture, forestry, fishing and hunting, and mining (%)
Most Common Industries - Agriculture, forestry, fishing and hunting (%)
Most Common Industries - Mining, quarrying, and oil and gas extraction (%)
Most Common Industries - Construction (%)
Most Common Industries - Manufacturing (%)
Most Common Industries - Wholesale trade (%)
Most Common Industries - Retail trade (%)
Most Common Industries - Transportation and warehousing, and utilities (%)
Most Common Industries - Transportation and warehousing (%)
Most Common Industries - Utilities (%)
Most Common Industries - Information (%)
Most Common Industries - Finance and insurance, and real estate and rental and leasing (%)
Most Common Industries - Finance and insurance (%)
Most Common Industries - Real estate and rental and leasing (%)
Most Common Industries - Professional, scientific, and management, and administrative and waste management services (%)
Most Common Industries - Professional, scientific, and technical services (%)
Most Common Industries - Management of companies and enterprises (%)
Most Common Industries - Administrative and support and waste management services (%)
Most Common Industries - Educational services, and health care and social assistance (%)
Most Common Industries - Educational services (%)
Most Common Industries - Health care and social assistance (%)
Most Common Industries - Arts, entertainment, and recreation, and accommodation and food services (%)
Most Common Industries - Arts, entertainment, and recreation (%)
Most Common Industries - Accommodation and food services (%)
Most Common Industries - Other services, except public administration (%)
Most Common Industries - Public administration (%)
Occupation diversity
Most Common Occupations - Management, business, science, and arts occupations (%)
Most Common Occupations - Management, business, and financial occupations (%)
Most Common Occupations - Management occupations (%)
Most Common Occupations - Business and financial operations occupations (%)
Most Common Occupations - Computer, engineering, and science occupations (%)
Most Common Occupations - Computer and mathematical occupations (%)
Most Common Occupations - Architecture and engineering occupations (%)
Most Common Occupations - Life, physical, and social science occupations (%)
Most Common Occupations - Education, legal, community service, arts, and media occupations (%)
Most Common Occupations - Community and social service occupations (%)
Most Common Occupations - Legal occupations (%)
Most Common Occupations - Education, training, and library occupations (%)
Most Common Occupations - Arts, design, entertainment, sports, and media occupations (%)
Most Common Occupations - Healthcare practitioners and technical occupations (%)
Most Common Occupations - Health diagnosing and treating practitioners and other technical occupations (%)
Most Common Occupations - Health technologists and technicians (%)
Most Common Occupations - Service occupations (%)
Most Common Occupations - Healthcare support occupations (%)
Most Common Occupations - Protective service occupations (%)
Most Common Occupations - Fire fighting and prevention, and other protective service workers including supervisors (%)
Most Common Occupations - Law enforcement workers including supervisors (%)
Most Common Occupations - Food preparation and serving related occupations (%)
Most Common Occupations - Building and grounds cleaning and maintenance occupations (%)
Most Common Occupations - Personal care and service occupations (%)
Most Common Occupations - Sales and office occupations (%)
Most Common Occupations - Sales and related occupations (%)
Most Common Occupations - Office and administrative support occupations (%)
Most Common Occupations - Natural resources, construction, and maintenance occupations (%)
Most Common Occupations - Farming, fishing, and forestry occupations (%)
Most Common Occupations - Construction and extraction occupations (%)
Most Common Occupations - Installation, maintenance, and repair occupations (%)
Most Common Occupations - Production, transportation, and material moving occupations (%)
Most Common Occupations - Production occupations (%)
Most Common Occupations - Transportation occupations (%)
Most Common Occupations - Material moving occupations (%)
People in Group quarters - Institutionalized population (%)
People in Group quarters - Correctional institutions (%)
People in Group quarters - Federal prisons and detention centers (%)
People in Group quarters - Halfway houses (%)
People in Group quarters - Local jails and other confinement facilities (including police lockups) (%)
People in Group quarters - Military disciplinary barracks (%)
People in Group quarters - State prisons (%)
People in Group quarters - Other types of correctional institutions (%)
People in Group quarters - Nursing homes (%)
People in Group quarters - Hospitals/wards, hospices, and schools for the handicapped (%)
People in Group quarters - Hospitals/wards and hospices for chronically ill (%)
People in Group quarters - Hospices or homes for chronically ill (%)
People in Group quarters - Military hospitals or wards for chronically ill (%)
People in Group quarters - Other hospitals or wards for chronically ill (%)
People in Group quarters - Hospitals or wards for drug/alcohol abuse (%)
People in Group quarters - Mental (Psychiatric) hospitals or wards (%)
People in Group quarters - Schools, hospitals, or wards for the mentally retarded (%)
People in Group quarters - Schools, hospitals, or wards for the physically handicapped (%)
People in Group quarters - Institutions for the deaf (%)
People in Group quarters - Institutions for the blind (%)
People in Group quarters - Orthopedic wards and institutions for the physically handicapped (%)
People in Group quarters - Wards in general hospitals for patients who have no usual home elsewhere (%)
People in Group quarters - Wards in military hospitals for patients who have no usual home elsewhere (%)
People in Group quarters - Juvenile institutions (%)
People in Group quarters - Long-term care (%)
People in Group quarters - Homes for abused, dependent, and neglected children (%)
People in Group quarters - Residential treatment centers for emotionally disturbed children (%)
People in Group quarters - Training schools for juvenile delinquents (%)
People in Group quarters - Short-term care, detention or diagnostic centers for delinquent children (%)
People in Group quarters - Type of juvenile institution unknown (%)
People in Group quarters - Noninstitutionalized population (%)
People in Group quarters - College dormitories (includes college quarters off campus) (%)
People in Group quarters - Military quarters (%)
People in Group quarters - On base (%)
People in Group quarters - Barracks, unaccompanied personnel housing (UPH), (Enlisted/Officer), ;and similar group living quarters for military personnel (%)
People in Group quarters - Transient quarters for temporary residents (%)
People in Group quarters - Military ships (%)
People in Group quarters - Group homes (%)
People in Group quarters - Homes or halfway houses for drug/alcohol abuse (%)
People in Group quarters - Homes for the mentally ill (%)
People in Group quarters - Homes for the mentally retarded (%)
People in Group quarters - Homes for the physically handicapped (%)
People in Group quarters - Other group homes (%)
People in Group quarters - Religious group quarters (%)
People in Group quarters - Dormitories (%)
People in Group quarters - Agriculture workers' dormitories on farms (%)
People in Group quarters - Job Corps and vocational training facilities (%)
People in Group quarters - Other workers' dormitories (%)
People in Group quarters - Crews of maritime vessels (%)
People in Group quarters - Other nonhousehold living situations (%)
People in Group quarters - Other noninstitutional group quarters (%)
Residents speaking English at home (%)
Residents speaking English at home - Born in the United States (%)
Residents speaking English at home - Native, born elsewhere (%)
Residents speaking English at home - Foreign born (%)
Residents speaking Spanish at home (%)
Residents speaking Spanish at home - Born in the United States (%)
Residents speaking Spanish at home - Native, born elsewhere (%)
Residents speaking Spanish at home - Foreign born (%)
Residents speaking other language at home (%)
Residents speaking other language at home - Born in the United States (%)
Residents speaking other language at home - Native, born elsewhere (%)
Residents speaking other language at home - Foreign born (%)
Class of Workers - Employee of private company (%)
Class of Workers - Self-employed in own incorporated business (%)
Class of Workers - Private not-for-profit wage and salary workers (%)
Class of Workers - Local government workers (%)
Class of Workers - State government workers (%)
Class of Workers - Federal government workers (%)
Class of Workers - Self-employed workers in own not incorporated business and Unpaid family workers (%)
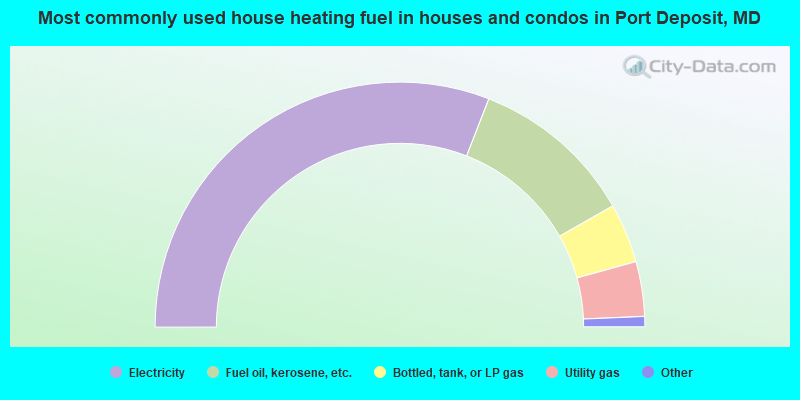
House heating fuel used in houses and condos - Utility gas (%)
House heating fuel used in houses and condos - Bottled, tank, or LP gas (%)
House heating fuel used in houses and condos - Electricity (%)
House heating fuel used in houses and condos - Fuel oil, kerosene, etc. (%)
House heating fuel used in houses and condos - Coal or coke (%)
House heating fuel used in houses and condos - Wood (%)
House heating fuel used in houses and condos - Solar energy (%)
House heating fuel used in houses and condos - Other fuel (%)
House heating fuel used in houses and condos - No fuel used (%)
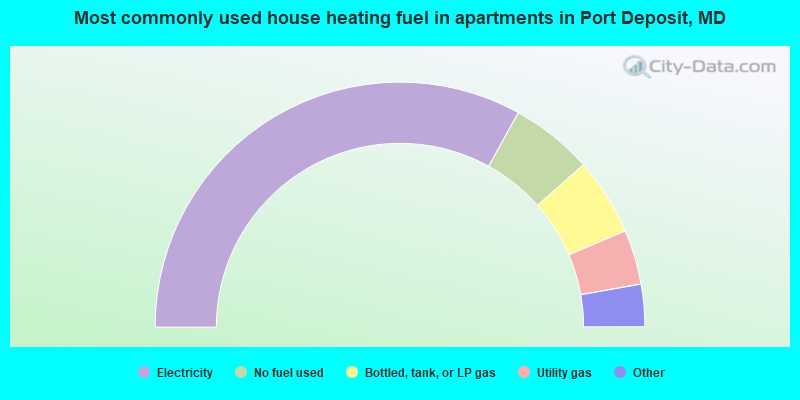
House heating fuel used in apartments - Utility gas (%)
House heating fuel used in apartments - Bottled, tank, or LP gas (%)
House heating fuel used in apartments - Electricity (%)
House heating fuel used in apartments - Fuel oil, kerosene, etc. (%)
House heating fuel used in apartments - Coal or coke (%)
House heating fuel used in apartments - Wood (%)
House heating fuel used in apartments - Solar energy (%)
House heating fuel used in apartments - Other fuel (%)
House heating fuel used in apartments - No fuel used (%)
Armed forces status - In Armed Forces (%)
Armed forces status - Civilian (%)
Armed forces status - Civilian - Veteran (%)
Armed forces status - Civilian - Nonveteran (%)
Fatal accidents locations in years 2005-2021
Fatal accidents locations in 2005
Fatal accidents locations in 2006
Fatal accidents locations in 2007
Fatal accidents locations in 2008
Fatal accidents locations in 2009
Fatal accidents locations in 2010
Fatal accidents locations in 2011
Fatal accidents locations in 2012
Fatal accidents locations in 2013
Fatal accidents locations in 2014
Fatal accidents locations in 2015
Fatal accidents locations in 2016
Fatal accidents locations in 2017
Fatal accidents locations in 2018
Fatal accidents locations in 2019
Fatal accidents locations in 2020
Fatal accidents locations in 2021
Alcohol use - People drinking some alcohol every month (%)
Alcohol use - People not drinking at all (%)
Alcohol use - Average days/month drinking alcohol
Alcohol use - Average drinks/week
Alcohol use - Average days/year people drink much
Audiometry - Average condition of hearing (%)
Audiometry - People that can hear a whisper from across a quiet room (%)
Audiometry - People that can hear normal voice from across a quiet room (%)
Audiometry - Ears ringing, roaring, buzzing (%)
Audiometry - Had a job exposure to loud noise (%)
Audiometry - Had off-work exposure to loud noise (%)
Blood Pressure & Cholesterol - Has high blood pressure (%)
Blood Pressure & Cholesterol - Checking blood pressure at home (%)
Blood Pressure & Cholesterol - Frequently checking blood cholesterol (%)
Blood Pressure & Cholesterol - Has high cholesterol level (%)
Consumer Behavior - Money monthly spent on food at supermarket/grocery store
Consumer Behavior - Money monthly spent on food at other stores
Consumer Behavior - Money monthly spent on eating out
Consumer Behavior - Money monthly spent on carryout/delivered foods
Consumer Behavior - Income spent on food at supermarket/grocery store (%)
Consumer Behavior - Income spent on food at other stores (%)
Consumer Behavior - Income spent on eating out (%)
Consumer Behavior - Income spent on carryout/delivered foods (%)
Current Health Status - General health condition (%)
Current Health Status - Blood donors (%)
Current Health Status - Has blood ever tested for HIV virus (%)
Current Health Status - Left-handed people (%)
Dermatology - People using sunscreen (%)
Diabetes - Diabetics (%)
Diabetes - Had a blood test for high blood sugar (%)
Diabetes - People taking insulin (%)
Diet Behavior & Nutrition - Diet health (%)
Diet Behavior & Nutrition - Milk product consumption (# of products/month)
Diet Behavior & Nutrition - Meals not home prepared (#/week)
Diet Behavior & Nutrition - Meals from fast food or pizza place (#/week)
Diet Behavior & Nutrition - Ready-to-eat foods (#/month)
Diet Behavior & Nutrition - Frozen meals/pizza (#/month)
Drug Use - People that ever used marijuana or hashish (%)
Drug Use - Ever used hard drugs (%)
Drug Use - Ever used any form of cocaine (%)
Drug Use - Ever used heroin (%)
Drug Use - Ever used methamphetamine (%)
Health Insurance - People covered by health insurance (%)
Kidney Conditions-Urology - Avg. # of times urinating at night
Medical Conditions - People with asthma (%)
Medical Conditions - People with anemia (%)
Medical Conditions - People with psoriasis (%)
Medical Conditions - People with overweight (%)
Medical Conditions - Elderly people having difficulties in thinking or remembering (%)
Medical Conditions - People who ever received blood transfusion (%)
Medical Conditions - People having trouble seeing even with glass/contacts (%)
Medical Conditions - People with arthritis (%)
Medical Conditions - People with gout (%)
Medical Conditions - People with congestive heart failure (%)
Medical Conditions - People with coronary heart disease (%)
Medical Conditions - People with angina pectoris (%)
Medical Conditions - People who ever had heart attack (%)
Medical Conditions - People who ever had stroke (%)
Medical Conditions - People with emphysema (%)
Medical Conditions - People with thyroid problem (%)
Medical Conditions - People with chronic bronchitis (%)
Medical Conditions - People with any liver condition (%)
Medical Conditions - People who ever had cancer or malignancy (%)
Mental Health - People who have little interest in doing things (%)
Mental Health - People feeling down, depressed, or hopeless (%)
Mental Health - People who have trouble sleeping or sleeping too much (%)
Mental Health - People feeling tired or having little energy (%)
Mental Health - People with poor appetite or overeating (%)
Mental Health - People feeling bad about themself (%)
Mental Health - People who have trouble concentrating on things (%)
Mental Health - People moving or speaking slowly or too fast (%)
Mental Health - People having thoughts they would be better off dead (%)
Oral Health - Average years since last visit a dentist
Oral Health - People embarrassed because of mouth (%)
Oral Health - People with gum disease (%)
Oral Health - General health of teeth and gums (%)
Oral Health - Average days a week using dental floss/device
Oral Health - Average days a week using mouthwash for dental problem
Oral Health - Average number of teeth
Pesticide Use - Households using pesticides to control insects (%)
Pesticide Use - Households using pesticides to kill weeds (%)
Physical Activity - People doing vigorous-intensity work activities (%)
Physical Activity - People doing moderate-intensity work activities (%)
Physical Activity - People walking or bicycling (%)
Physical Activity - People doing vigorous-intensity recreational activities (%)
Physical Activity - People doing moderate-intensity recreational activities (%)
Physical Activity - Average hours a day doing sedentary activities
Physical Activity - Average hours a day watching TV or videos
Physical Activity - Average hours a day using computer
Physical Functioning - People having limitations keeping them from working (%)
Physical Functioning - People limited in amount of work they can do (%)
Physical Functioning - People that need special equipment to walk (%)
Physical Functioning - People experiencing confusion/memory problems (%)
Physical Functioning - People requiring special healthcare equipment (%)
Prescription Medications - Average number of prescription medicines taking
Preventive Aspirin Use - Adults 40+ taking low-dose aspirin (%)
Reproductive Health - Vaginal deliveries (%)
Reproductive Health - Cesarean deliveries (%)
Reproductive Health - Deliveries resulted in a live birth (%)
Reproductive Health - Pregnancies resulted in a delivery (%)
Reproductive Health - Women breastfeeding newborns (%)
Reproductive Health - Women that had a hysterectomy (%)
Reproductive Health - Women that had both ovaries removed (%)
Reproductive Health - Women that have ever taken birth control pills (%)
Reproductive Health - Women taking birth control pills (%)
Reproductive Health - Women that have ever used Depo-Provera or injectables (%)
Reproductive Health - Women that have ever used female hormones (%)
Sexual Behavior - People 18+ that ever had sex (vaginal, anal, or oral) (%)
Sexual Behavior - Males 18+ that ever had vaginal sex with a woman (%)
Sexual Behavior - Males 18+ that ever performed oral sex on a woman (%)
Sexual Behavior - Males 18+ that ever had anal sex with a woman (%)
Sexual Behavior - Males 18+ that ever had any sex with a man (%)
Sexual Behavior - Females 18+ that ever had vaginal sex with a man (%)
Sexual Behavior - Females 18+ that ever performed oral sex on a man (%)
Sexual Behavior - Females 18+ that ever had anal sex with a man (%)
Sexual Behavior - Females 18+ that ever had any kind of sex with a woman (%)
Sexual Behavior - Average age people first had sex
Sexual Behavior - Average number of female sex partners in lifetime (males 18+)
Sexual Behavior - Average number of female vaginal sex partners in lifetime (males 18+)
Sexual Behavior - Average age people first performed oral sex on a woman (18+)
Sexual Behavior - Average number of woman performed oral sex on in lifetime (18+)
Sexual Behavior - Average number of male sex partners in lifetime (males 18+)
Sexual Behavior - Average number of male anal sex partners in lifetime (males 18+)
Sexual Behavior - Average age people first performed oral sex on a man (18+)
Sexual Behavior - Average number of male oral sex partners in lifetime (18+)
Sexual Behavior - People using protection when performing oral sex (%)
Sexual Behavior - Average number of times people have vaginal or anal sex a year
Sexual Behavior - People having sex without condom (%)
Sexual Behavior - Average number of male sex partners in lifetime (females 18+)
Sexual Behavior - Average number of male vaginal sex partners in lifetime (females 18+)
Sexual Behavior - Average number of female sex partners in lifetime (females 18+)
Sexual Behavior - Circumcised males 18+ (%)
Sleep Disorders - Average hours sleeping at night
Sleep Disorders - People that has trouble sleeping (%)
Smoking-Cigarette Use - People smoking cigarettes (%)
Taste & Smell - People 40+ having problems with smell (%)
Taste & Smell - People 40+ having problems with taste (%)
Taste & Smell - People 40+ that ever had wisdom teeth removed (%)
Taste & Smell - People 40+ that ever had tonsils teeth removed (%)
Taste & Smell - People 40+ that ever had a loss of consciousness because of a head injury (%)
Taste & Smell - People 40+ that ever had a broken nose or other serious injury to face or skull (%)
Taste & Smell - People 40+ that ever had two or more sinus infections (%)
Weight - Average height (inches)
Weight - Average weight (pounds)
Weight - Average BMI
Weight - People that are obese (%)
Weight - People that ever were obese (%)
Weight - People trying to lose weight (%)
Latest news from Port Deposit, MD collected exclusively by city-data.com from local newspapers, TV, and radio stations
Ancestries: American (9.5%), English (8.3%), German (6.7%), Polish (4.4%), European (3.6%), Irish (3.2%).
Current Local Time:
Land area: 1.67 square miles.
Population density: 372 people per square mile (very low).
11 residents are foreign born
This town:
1.9%Maryland:
15.7%
Median real estate property taxes paid for housing units with mortgages in 2022: $2,634 (1.0%)Median real estate property taxes paid for housing units with no mortgage in 2022: $2,702 (1.4%)
Nearest city with pop. 50,000+: Greater Newark, DE (19.6 miles
Nearest city with pop. 200,000+: Baltimore, MD
Nearest city with pop. 1,000,000+: Philadelphia, PA
Nearest cities:
Latitude: 39.61 N, Longitude: 76.10 W
Unemployment in December 2023:
Most common occupations in Port Deposit, MD (%)
Both Males Females
Building and grounds cleaning and maintenance occupations (6.0%)
Other office and administrative support workers, including supervisors (5.7%)
Construction laborers (5.3%)
Registered nurses (4.3%)
Other material moving workers, except laborers (4.3%)
Nursing, psychiatric, and home health aides (3.9%)
Vehicle and mobile equipment mechanics, installers, and repairers (3.9%)
Construction laborers (10.6%)
Other material moving workers, except laborers (8.5%)
Vehicle and mobile equipment mechanics, installers, and repairers (7.8%)
Driver/sales workers and truck drivers (7.1%)
Electrical equipment mechanics and other installation, maintenance, and repair workers, including supervisors (5.7%)
Building and grounds cleaning and maintenance occupations (5.0%)
Metal workers and plastic workers (5.0%)
Registered nurses (8.6%)
Other office and administrative support workers, including supervisors (8.6%)
Nursing, psychiatric, and home health aides (7.9%)
Building and grounds cleaning and maintenance occupations (7.1%)
Other sales and related occupations, including supervisors (5.7%)
Other management occupations, except farmers and farm managers (5.0%)
Other teachers, instructors, education, training, and library occupations (4.3%)
Tornado activity:
Port Deposit-area historical tornado activity is slightly above Maryland state average. It is 18% greater than the overall U.S. average.
On 7/27/1994, a category F3 (max. wind speeds 158-206 mph) tornado 18.9 miles away from the Port Deposit town center injured 11 people and caused between $500,000 and $5,000,000 in damages.
On 4/28/1961, a category F3 tornado 28.5 miles away from the town center caused between $5000 and $50,000 in damages.
Earthquake activity:
Port Deposit-area historical earthquake activity is significantly above Maryland state average. It is 62% smaller than the overall U.S. average. On 8/23/2011 at 17:51:04, a magnitude 5.8 (5.8 MW, Depth: 3.7 mi, Class: Moderate, Intensity: VI - VII) earthquake occurred 153.8 miles away from the city center On 1/16/1994 at 01:49:16, a magnitude 4.6 (4.6 MB, 4.6 LG, Depth: 3.1 mi, Class: Light, Intensity: IV - V) earthquake occurred 49.8 miles away from the city center On 1/16/1994 at 00:42:43, a magnitude 4.2 (4.2 MB, 4.0 LG, Depth: 3.1 mi) earthquake occurred 49.8 miles away from Port Deposit center On 9/25/1998 at 19:52:52, a magnitude 5.2 (4.8 MB, 4.3 MS, 5.2 LG, 4.5 MW, Depth: 3.1 mi) earthquake occurred 260.5 miles away from Port Deposit center On 11/30/2017 at 21:47:31, a magnitude 4.1 (4.1 MW, Depth: 6.1 mi) earthquake occurred 45.7 miles away from Port Deposit center On 8/25/2011 at 05:07:52, a magnitude 4.5 (4.5 ML, Depth: 4.2 mi) earthquake occurred 152.9 miles away from the city center Magnitude types: regional Lg-wave magnitude (LG), body-wave magnitude (MB), local magnitude (ML), surface-wave magnitude (MS), moment magnitude (MW) Natural disasters: The number of natural disasters in Cecil County (18) is near the US average (15).Major Disasters (Presidential) Declared: 13Emergencies Declared: 5Hurricanes: 7, Snowstorms: 4, Winter Storms: 4, Floods: 2, Tropical Storms: 2, Blizzard: 1, Heavy Rain: 1, Snowfall: 1, Other: 1 (Note: some incidents may be assigned to more than one category). Hospitals and medical centers near Port Deposit: BREVIN NURSING HOME (Nursing Home, about 5 miles away; HAVRE DE GRACE, MD)
CITIZENS CARE CENTER (Nursing Home, about 5 miles away; HAVRE DE GRACE, MD)
TRANSITIONAL CARE UNIT AT HARTFORD MEMORIAL HOSPIT (Nursing Home, about 5 miles away; HAVRE DE GRACE, MD)
ABERDEEN DIALYSIS (Dialysis Facility, about 8 miles away; ABERDEEN, MD)
CALVERT MANOR HEALTH CARE CENT (Nursing Home, about 10 miles away; RISING SUN, MD)
CALVERT MANOR NRS HOME (Nursing Home, about 10 miles away; RISING SUN, MD)
LORIEN HEALTH SYSTEMS - RIVERSIDE (Nursing Home, about 13 miles away; BELCAMP, MD)
Amtrak stations near Port Deposit: 8 miles: ABERDEEN (S. PHILADELPHIA & BELAIR AVE.) Services: free short-term parking, intercity bus service.
19 miles: NEWARK (429 S. COLLEGE AVE.) Services: public payphones, free short-term parking, call for car rental service, call for taxi service, public transit connection.
Operable nuclear power plants near Port Deposit:
15 miles: Peach Bottom 2 and 3 in Delta, PA.
Colleges/universities with over 2000 students nearest to Port Deposit:
Harford Community College (about 11 miles; Bel Air, MD ; Full-time enrollment: 4,530)
Lincoln University of Pennsylvania (about 17 miles; Lincoln University, PA ; FT enrollment: 2,042)
University of Delaware (about 20 miles; Newark, DE ; FT enrollment: 20,078)
The Community College of Baltimore County (about 28 miles; Baltimore, MD ; FT enrollment: 15,217)
Wilmington University (about 28 miles; New Castle, DE ; FT enrollment: 10,072)
Millersville University of Pennsylvania (about 31 miles; Millersville, PA ; FT enrollment: 7,743)
Delaware Technical Community College-Stanton/Wilmington (about 31 miles; Wilmington, DE ; FT enrollment: 4,972)
Private high school in Port Deposit: LIGHTHOUSE CHRISTIAN ACADEMY Students: 212, Location: 7 PLEASANTVIEW CHURCH RD, Grades: PK-12)
Public elementary/middle school in Port Deposit:
See full list of schools located in Port Deposit
Notable locations in Port Deposit: (A) , Water Witch Fire Company Station 7 (B) , Port Deposit Police Department (C) . Display/hide their locations on the map
Churches in Port Deposit include: (A) , First Baptist Church (B) , Port Deposit Presbyterian Church (C) , Saint Teresa Catholic Church (D) , Tome United Methodist Church (E) , Pleasant View Baptist Church (F) , Port Deposit First Baptist Church (G) , Port Deposit Presbyterian Church (H) . Display/hide their locations on the map
Streams, rivers, and creeks: (A) . Display/hide its location on the map
Park in Port Deposit: (1) . Display/hide its location on the map
Tourist attraction:
Birthplace of: John Creswell - Politician, Walter M. Baker - Politician.
Cecil County has a predicted average indoor radon screening level between 2 and 4 pCi/L (pico curies per liter) - Moderate Potential Drinking water stations with addresses in Port Deposit and their reported violations in the past:
BENJAMINS VILLAGE/HOMESTEAD M.H.P. (Population served: 300, Groundwater):
Past health violations:
MCL, Monthly (TCR) - In OCT-2010, Contaminant: Coliform. Follow-up actions: St Public Notif requested (NOV-01-2010), St Violation/Reminder Notice (NOV-01-2010), St Public Notif received (NOV-19-2010), St Compliance achieved (DEC-08-2010)
MCL, Monthly (TCR) - In AUG-2006, Contaminant: Coliform. Follow-up actions: St Public Notif requested (AUG-10-2006), St Public Notif received (AUG-30-2006), St Compliance achieved (OCT-01-2006)
Past monitoring violations:
Lead Consumer Notice - In JAN-01-2014, Contaminant: Lead and Copper Rule. Follow-up actions: St Violation/Reminder Notice (JUL-13-2012)
Follow-up Or Routine LCR Tap M/R - In OCT-01-2012, Contaminant: Lead and Copper Rule. Follow-up actions: St Violation/Reminder Notice (MAR-19-2013), St Compliance achieved (OCT-08-2013)
Monitoring, Source Water (GWR) - In AUG-2010, Contaminant: E. COLI
Follow-up Or Routine LCR Tap M/R - In OCT-01-2004, Contaminant: Lead and Copper Rule. Follow-up actions: St Violation/Reminder Notice (3 times from JUN-15-2005 to SEP-07-2006), St Compliance achieved (OCT-18-2006)
One routine major monitoring violation
One minor monitoring violation
Population served: 200, Groundwater):
Past health violations:
MCL, Monthly (TCR) - In JUN-2014, Contaminant: Coliform. Follow-up actions: St Violation/Reminder Notice (JUN-10-2014), St Public Notif received (JUN-12-2014), St Public Notif requested (JUN-12-2014)
MCL, Monthly (TCR) - In JAN-2011, Contaminant: Coliform. Follow-up actions: St Public Notif requested (FEB-25-2011), St Violation/Reminder Notice (FEB-25-2011), St Compliance achieved (MAY-05-2011)
MCL, Monthly (TCR) - In NOV-2010, Contaminant: Coliform. Follow-up actions: St Violation/Reminder Notice (DEC-07-2010), St Public Notif requested (DEC-07-2010), St Compliance achieved (FEB-25-2011), St Public Notif requested (MAY-10-2011), St Violation/Reminder Notice (MAY-10-2011)
MCL, Monthly (TCR) - In NOV-2009, Contaminant: Coliform. Follow-up actions: St Violation/Reminder Notice (NOV-17-2009), St Public Notif requested (DEC-08-2009), St Compliance achieved (JUN-07-2010)
MCL, Monthly (TCR) - In JUL-2009, Contaminant: Coliform. Follow-up actions: St Violation/Reminder Notice (JUL-30-2009), St Public Notif requested (AUG-18-2009), St Compliance achieved (SEP-03-2009)
MCL, Monthly (TCR) - In SEP-2008, Contaminant: Coliform. Follow-up actions: St Violation/Reminder Notice (OCT-01-2008), St Public Notif requested (OCT-28-2008), St Violation/Reminder Notice (NOV-10-2008), St Compliance achieved (FEB-03-2009)
MCL, Monthly (TCR) - In JUL-2007, Contaminant: Coliform. Follow-up actions: St Violation/Reminder Notice (JUL-17-2007), St Public Notif received (JUL-24-2007), St Compliance achieved (SEP-30-2007)
Past monitoring violations:
Follow-up Or Routine LCR Tap M/R - In OCT-01-2011, Contaminant: Lead and Copper Rule. Follow-up actions: St Compliance achieved (OCT-21-2011)
Follow-up Or Routine LCR Tap M/R - In OCT-01-2010, Contaminant: Lead and Copper Rule. Follow-up actions: St Violation/Reminder Notice (MAR-15-2011)
One minor monitoring violation
12 regular monitoring violations
Population served: 180, Groundwater):
Past health violations:
MCL, Monthly (TCR) - In OCT-2012, Contaminant: Coliform. Follow-up actions: St Violation/Reminder Notice (OCT-31-2012), St Public Notif requested (OCT-31-2012), St Compliance achieved (JAN-23-2013), St Public Notif received (JAN-28-2013)
Past monitoring violations:
Lead Consumer Notice - In JAN-01-2014, Contaminant: Lead and Copper Rule. Follow-up actions: St Violation/Reminder Notice (SEP-10-2013)
Population served: 180, Groundwater):
Past monitoring violations:
Lead Consumer Notice - In JAN-01-2014, Contaminant: Lead and Copper Rule. Follow-up actions: St Violation/Reminder Notice (SEP-10-2013)
Follow-up Or Routine LCR Tap M/R - In OCT-01-2008, Contaminant: Lead and Copper Rule. Follow-up actions: St Public Notif received (JUN-30-2008), St Compliance achieved (OCT-16-2008)
Follow-up Or Routine LCR Tap M/R - In JAN-01-2007, Contaminant: Lead and Copper Rule. Follow-up actions: St Compliance achieved (JUN-06-2007), St Violation/Reminder Notice (JUN-11-2007)
One routine major monitoring violation
One minor monitoring violation
Population served: 150, Groundwater):
Past health violations:
OCCT/SOWT Study/Recommendation - In APR-01-2012, Contaminant: Lead and Copper Rule. Follow-up actions: St Violation/Reminder Notice (3 times from MAR-19-2013 to JUL-07-2014)
MCL, Monthly (TCR) - In FEB-2009, Contaminant: Coliform. Follow-up actions: St Violation/Reminder Notice (FEB-11-2009), St Public Notif requested (MAR-10-2009), St Public Notif received (SEP-22-2009), St Compliance achieved (SEP-22-2009)
MCL, Monthly (TCR) - In SEP-2008, Contaminant: Coliform. Follow-up actions: St Violation/Reminder Notice (SEP-20-2008), St Public Notif requested (OCT-28-2008), St Violation/Reminder Notice (NOV-10-2008), St Public Notif received (SEP-22-2009), St Compliance achieved (SEP-22-2009)
MCL, Monthly (TCR) - In FEB-2005, Contaminant: Coliform. Follow-up actions: St Public Notif received (MAR-02-2005), St Public Notif requested (MAR-02-2005), St Compliance achieved (APR-10-2005)
Past monitoring violations:
Follow-up Or Routine LCR Tap M/R - In JAN-01-2013, Contaminant: Lead and Copper Rule. Follow-up actions: St Compliance achieved (JAN-23-2013)
Initial, Follow-up, or Routine Source Water M/R - In APR-01-2012, Contaminant: Lead and Copper Rule. Follow-up actions: St Violation/Reminder Notice (3 times from MAR-19-2013 to JUL-07-2014)
Water Quality Parameter M/R - Between JUN-2011 and NOV-2011, Contaminant: Lead and Copper Rule. Follow-up actions: St Violation/Reminder Notice (4 times from MAR-20-2012 to JUL-07-2014)
Follow-up Or Routine LCR Tap M/R - In OCT-01-2010, Contaminant: Lead and Copper Rule. Follow-up actions: St Violation/Reminder Notice (MAR-15-2011), St Compliance achieved (OCT-21-2011)
Follow-up Or Routine LCR Tap M/R - In JUL-01-2003, Contaminant: Lead and Copper Rule. Follow-up actions: St Violation/Reminder Notice (3 times from DEC-10-2003 to NOV-24-2004), St Compliance achieved (JUL-19-2005)
15 regular monitoring violations
Population served: 55, Groundwater):
Past monitoring violations:
Follow-up Or Routine LCR Tap M/R - In OCT-01-2003, Contaminant: Lead and Copper Rule. Follow-up actions: St Violation/Reminder Notice (3 times from SEP-08-2004 to SEP-09-2005), St Compliance achieved (SEP-07-2006)
Address: 1282 SUSQUEHANNA RD Population served: 50, Groundwater):
Past health violations:
MCL, Monthly (TCR) - In JUL-2010, Contaminant: Coliform. Follow-up actions: St Violation/Reminder Notice (AUG-04-2010), St Compliance achieved (NOV-17-2011)
Population served: 25, Groundwater):
Past health violations:
MCL, Monthly (TCR) - In AUG-2013, Contaminant: Coliform. Follow-up actions: St Violation/Reminder Notice (SEP-13-2013)
MCL, Monthly (TCR) - In APR-2013, Contaminant: Coliform. Follow-up actions: St Violation/Reminder Notice (APR-24-2013), St Compliance achieved (JUN-03-2013)
MCL, Monthly (TCR) - In JUL-2010, Contaminant: Coliform. Follow-up actions: St Violation/Reminder Notice (AUG-02-2010), St Compliance achieved (AUG-16-2010)
MCL, Monthly (TCR) - In OCT-2008, Contaminant: Coliform. Follow-up actions: St Violation/Reminder Notice (NOV-18-2008), St Compliance achieved (JAN-21-2009)
MCL, Monthly (TCR) - In NOV-2007, Contaminant: Coliform. Follow-up actions: St Violation/Reminder Notice (JAN-30-2008), St Public Notif received (FEB-11-2008), St Compliance achieved (FEB-20-2008)
Average household size: This town:
2.4 peopleMaryland:
2.6 people
Percentage of family households: This town:
57.7%Whole state:
67.1%
Percentage of households with unmarried partners: This town:
12.5%Whole state:
6.4%
Likely homosexual households (counted as self-reported same-sex unmarried-partner households)
Lesbian couples: 0.4% of all households Gay men: 0.4% of all households
19 people in nursing facilities/skilled-nursing facilities in 2010people in homes or halfway houses for drug/alcohol abuse in 2000people in other group homes in 2000
For population 15 years and over in Port Deposit:
Never married: 36.0%Now married: 34.9%Separated: 3.6%Widowed: 8.3%Divorced: 17.2% For population 25 years and over in Port Deposit:
High school or higher: 93.3%Bachelor's degree or higher: 35.5%Graduate or professional degree: 18.2%Unemployed: 9.9%Mean travel time to work (commute): 29.3 minutes
Education Gini index (Inequality in education) Here:
13.1Maryland average:
12.7
Religion statistics for Port Deposit, MD (based on Cecil County data)
Religion Adherents Congregations Evangelical Protestant 11,922 47 Catholic 9,440 8 Mainline Protestant 8,873 41 Black Protestant 784 6 Other 465 2 None 69,624 -
Source: Clifford Grammich, Kirk Hadaway, Richard Houseal, Dale E.Jones, Alexei Krindatch, Richie Stanley and Richard H.Taylor. 2012. 2010 U.S.Religion Census: Religious Congregations & Membership Study. Association of Statisticians of American Religious Bodies. Jones, Dale E., et al. 2002. Congregations and Membership in the United States 2000. Nashville, TN: Glenmary Research Center. Graphs represent county-level data
Food Environment Statistics: Number of grocery stores : 20Cecil County :
2.01 / 10,000 pop.Maryland :
1.96 / 10,000 pop.
Number of convenience stores (no gas) : 11Cecil County :
1.11 / 10,000 pop.Maryland :
1.22 / 10,000 pop.
Number of convenience stores (with gas) : 33Cecil County :
3.32 / 10,000 pop.Maryland :
2.05 / 10,000 pop.
Number of full-service restaurants : 47This county :
4.73 / 10,000 pop.Maryland :
5.40 / 10,000 pop.
Adult diabetes rate : Cecil County :
8.2%State :
9.1%
Adult obesity rate : This county :
27.8%Maryland :
26.7%
Low-income preschool obesity rate : This county :
18.0%Maryland :
15.5%
Health and Nutrition: Healthy diet rate : This city:
54.1%Maryland:
50.1%
Average overall health of teeth and gums : Port Deposit:
54.4%Maryland:
47.6%
Average BMI : This city:
28.4Maryland:
28.8
People feeling badly about themselves : Port Deposit:
19.6%Maryland:
20.0%
People not drinking alcohol at all : Port Deposit:
8.2%Maryland:
11.3%
Average hours sleeping at night : Port Deposit:
6.9Maryland:
6.8
Overweight people : This city:
34.5%State:
34.1%
General health condition : This city:
61.2%State:
56.5%
Average condition of hearing : Port Deposit:
81.8%State:
80.5%
More about Health and Nutrition of Port Deposit, MD Residents
Local government employment and payroll (March 2022)
Function
Full-time employees
Monthly full-time payroll
Average yearly full-time wage
Part-time employees
Monthly part-time payroll
Parks and Recreation
2 $4,986 $29,916 0 $0 Other Government Administration
2 $9,303 $55,818 1 $2,432 Financial Administration
1 $4,579 $54,948 0 $0
Totals for Government
5 $18,867 $45,281 1 $2,432
Port Deposit government finances - Expenditure in 2017 (per resident):
Current Operations - Parks and Recreation: $969,000 ($1560.39)
Central Staff Services: $139,000 ($223.83)Financial Administration: $113,000 ($181.96)Regular Highways: $105,000 ($169.08)Police Protection: $81,000 ($130.43)Solid Waste Management: $68,000 ($109.50)Local Fire Protection: $16,000 ($25.76)Protective Inspection and Regulation - Other: $13,000 ($20.93)General Public Buildings: $13,000 ($20.93)Judicial and Legal Services: $10,000 ($16.10)Other Capital Outlay - General Public Building: $11,000 ($17.71)
Total Salaries and Wages: $236,000 ($380.03)
Port Deposit government finances - Revenue in 2017 (per resident):
Charges - Solid Waste Management: $58,000 ($93.40)
Parks and Recreation: $2,000 ($3.22)Other: $1,000 ($1.61)Local Intergovernmental - Other: $2,000 ($3.22)
Miscellaneous - Rents: $13,000 ($20.93)
State Intergovernmental - Other: $938,000 ($1510.47)
Highways: $11,000 ($17.71)Tax - Property: $400,000 ($644.12)
Individual Income: $76,000 ($122.38)Other License: $26,000 ($41.87)Public Utility License: $7,000 ($11.27)Amusements Sales: $2,000 ($3.22)Other Selective Sales: $1,000 ($1.61)
Port Deposit government finances - Cash and Securities in 2017 (per resident):
Bond Funds - Cash and Securities: $101,000 ($162.64)
Other Funds - Cash and Securities: $568,000 ($914.65)
Strongest AM radio stations in Port Deposit:
WJSS (1330 AM; 5 kW; HAVRE DE GRACE, MD; Owner: PEOPLES BROADCAST NETWORK, LLC)
WWLG (1370 AM; 50 kW; BALTIMORE, MD; Owner: M-10 BROADCASTING, INC.)
WVCH (740 AM; 50 kW; CHESTER, PA; Owner: WVCH COMMUNICATIONS, INC.)
WCBM (680 AM; 50 kW; BALTIMORE, MD; Owner: WCBM MARYLAND, INC.)
WBAL (1090 AM; 50 kW; BALTIMORE, MD; Owner: HEARST RADIO, INC.)
WPEN (950 AM; 50 kW; PHILADELPHIA, PA; Owner: GREATER PHILADELPHIA RADIO, INC.)
WGOP (700 AM; daytime; 25 kW; WALKERSVILLE, MD; Owner: BIRACH BROADCASTING CORPORATION)
WBIS (1190 AM; 50 kW; ANNAPOLIS, MD; Owner: NATIONS RADIO, LLC)
WZZD (990 AM; 50 kW; PHILADELPHIA, PA; Owner: PENNSYLVANIA MEDIA ASSOCIATES, INC.)
KYW (1060 AM; 50 kW; PHILADELPHIA, PA; Owner: INFINITY BROADCASTING OPERATIONS, INC.)
WWJZ (640 AM; 50 kW; MOUNT HOLLY, NJ; Owner: ABC, INC.)
WTEM (980 AM; 50 kW; WASHINGTON, DC; Owner: AMFM RADIO LICENSES, L.L.C.)
WNWR (1540 AM; 50 kW; PHILADELPHIA, PA)
Strongest FM radio stations in Port Deposit:
WXCY (103.7 FM; HAVRE DE GRACE, MD; Owner: DELMARVA BROADCASTING COMPANY)
WDAC (94.5 FM; LANCASTER, PA; Owner: WDAC RADIO COMPANY)
WLIF (101.9 FM; BALTIMORE, MD; Owner: INFINITY WLIF, INC.)
WWMX (106.5 FM; BALTIMORE, MD; Owner: INFINITY RADIO OPERATIONS INC.)
WHFC (91.1 FM; BEL AIR, MD; Owner: HARFORD COMMUNITY COLLEGE)
WARM-FM (103.3 FM; YORK, PA; Owner: WSBA LICO, INC.)
WROZ (101.3 FM; LANCASTER, PA; Owner: HALL COMMUNICATIONS, INC.)
WSOX (96.1 FM; RED LION, PA; Owner: LANCASTER-YORK BROADCASTING, LLC)
WOEL-FM (89.9 FM; ELKTON, MD; Owner: MARANATHA BIBLE INSTITUTE, INC.)
WIYY (97.9 FM; BALTIMORE, MD; Owner: HEARST RADIO, INC.)
WIOV-FM (105.1 FM; EPHRATA, PA; Owner: REGENT BROADCASTING OF LANCASTER, INC.)
WSMJ (104.3 FM; BALTIMORE, MD; Owner: CITICASTERS LICENSES, L.P.)
WPLY (100.3 FM; MEDIA, PA; Owner: RADIO ONE LICENSES, LLC)
WZBA (100.7 FM; WESTMINSTER, MD; Owner: SHAMROCK COMMUNICATIONS, INC.)
WPOC (93.1 FM; BALTIMORE, MD; Owner: CITICASTERS LICENSES, L.P.)
WXYV (105.7 FM; CATONSVILLE, MD; Owner: INFINITY RADIO OPERATIONS INC.)
TV broadcast stations around Port Deposit:
WTSD-CA (Channel 14; WILMINGTON, DE; Owner: PRIORITY COMMUNICATIONS MINISTRIES, INC.)
WBAL-TV (Channel 11; BALTIMORE, MD; Owner: WBAL HEARST-ARGYLE TV, INC. (CA CORP.))
WMAR-TV (Channel 2; BALTIMORE, MD; Owner: SCRIPPS HOWARD BROADCASTING COMPANY)
WBFF (Channel 45; BALTIMORE, MD; Owner: CHESAPEAKE TELEVISION LICENSEE, LLC)
WNUV (Channel 54; BALTIMORE, MD; Owner: BALTIMORE (WNUV-TV) LICENSEE, INC.)
WMPB (Channel 67; BALTIMORE, MD; Owner: MARYLAND PUBLIC BROADCASTING COMMISSION)
WJZ-TV (Channel 13; BALTIMORE, MD; Owner: VIACOM INC.)
WPMT (Channel 43; YORK, PA; Owner: TRIBUNE TELEVISION COMPANY)
WUTB (Channel 24; BALTIMORE, MD; Owner: FOX TELEVISION STATIONS, INC.)
Port Deposit, Maryland
Fatal accident count 22 Vehicles involved in fatal accidents 34 Fatal accidents involving drunk persons: 5 Fatalities 23 Persons involved in fatal accidents 52 Pedestrians involved in fatal accidents 1
Maryland average
Fatal accident count 10025 Vehicles involved in fatal accidents 15057 Fatal accidents involving drunk persons 3496 Fatalities 11067 Persons involved in fatal accidents 25218 Pedestrians involved in fatal accidents 1017
See more detailed statistics of Port Deposit fatal car crashes and road traffic accidents for 1975 - 2021 here
National Bridge Inventory (NBI) Statistics 23 Number of bridges121ft / 36.9m Total length $833,000 Total costs97,882 Total average daily traffic10,398 Total average daily truck traffic137,997 Total future (year 2026) average daily traffic
New bridges - historical statistics
1 Before 1900 1 1900-1909 1 1920-1929 4 1930-1939 2 1940-1949 1 1950-1959 2 1960-1969 1 1970-1979 2 1980-1989 2 1990-1999 2 2000-2009 4 2010-2019
See full National Bridge Inventory statistics for Port Deposit, MD
FCC Registered Cell Phone Towers: 1 (
See the full list of FCC Registered Cell Phone Towers in Port Deposit )
FCC Registered Antenna Towers: 31 (
See the full list of FCC Registered Antenna Towers )
FCC Registered Private Land Mobile Towers: 1
Perryville Aei At Port Deposit Near Rr Mp Pd 4.05 (Lat: 39.598889 Lon: -76.109389), Type: Pole, Structure height: 3 m, Call Sign: WPIG899, Assigned Frequencies: 911.500 MHz, Grant Date: 06/25/2015, Expiration Date: 09/13/2025, Certifier: Jerry R Celio, Registrant: Norfolk Southern Railway Company, 1200 Peachtree Street, Ne, Box 123, Atlanta, GA 30309, Phone: (404) 582-6224, Fax: (404) 582-6209, Email:
FCC Registered Broadcast Land Mobile Towers: 2
MOBILES L2, Lat: 39.599250 Lon: -76.109639, Call Sign: WPLW759, Assigned Frequencies: 160.417 MHz, 160.672 MHz, 161.227 MHz, 161.482 MHz, 161.205 MHz, 161.565 MHz, 160.560 MHz, 161.070 MHz, Grant Date: 01/11/2023, Expiration Date: 03/25/2033, Certifier: Jerry R Celio, Registrant: Norfolk Southern Railway Company, 650 West Peachtree St, Nw, Box 41, Atlanta, GA 30308, Phone: (404) 660-4050, Email:
MOBILES L1, Lat: 39.599472 Lon: -76.109639, Call Sign: WQKX706, Licensee ID: L00008014, Assigned Frequencies: 161.055 MHz, Grant Date: 08/17/2019, Expiration Date: 10/20/2029, Certifier: Jerry R Celio, Registrant: Norfolk Southern Railway Company, 650 West Peachtree St, Nw, Box 41, Atlanta, GA 30308, Phone: (404) 660-4050, Fax: (404) 582-6209, Email:
FCC Registered Microwave Towers: 3
ATC CHES HOUSE, Approx 0.2 Miles Ne From John F Kennedy Memorial Hwy (Lat: 39.610889 Lon: -76.010611), Type: Ltower, Structure height: 42.6 m, Overall height: 45.4 m, Call Sign: WQQV731, Assigned Frequencies: 19315.0 MHz, 19525.0 MHz, Grant Date: 03/12/2013, Expiration Date: 03/12/2023, Cancellation Date: 09/01/2020, Certifier: Sean Mirsky, Registrant: World Class Wireless, LLC, 600 W. Chicago, Suite 610, Chicago, IL 60654, Phone: (312) 244-3402, Email:
1CE6348D, 1479 Tome Highway (Lat: 39.639000 Lon: -76.076639), Type: Ltower, Structure height: 59.7 m, Call Sign: WQVN504, Assigned Frequencies: 11465.0 MHz, 11465.0 MHz, 11465.0 MHz, 11465.0 MHz, 11465.0 MHz, 11465.0 MHz, 11465.0 MHz, 11465.0 MHz, Grant Date: 04/07/2015, Expiration Date: 04/07/2025, Cancellation Date: 07/03/2023, Certifier: David Werblow, Registrant: T-Mobile Usa, Inc., 12920 Se 38th Street, Bellevue, WA 98006, Phone: (425) 383-8401, Email:
THEODORE, 1375 Theodore Road (Lat: 39.639639 Lon: -76.016028), Type: Ltower, Structure height: 54.9 m, Overall height: 56.1 m, Call Sign: WLK631, Assigned Frequencies: 17960.0 MHz, 18000.0 MHz, 18040.0 MHz, 18080.0 MHz, Grant Date: 01/05/2021, Expiration Date: 02/01/2031, Certifier: Carol L Tacker, Registrant: At&t Services, Inc., 208 S Akard St, 20f, Dallas, TX 75202, Phone: (855) 699-7073, Email:
FCC Registered Amateur Radio Licenses: 40 (
See the full list of FCC Registered Amateur Radio Licenses in Port Deposit )
FAA Registered Aircraft: 2
Aircraft: BELLANCA 7GCBC (Category: Land, Seats: 2, Weight: Up to 12,499 Pounds, Speed: 90 mph), Engine: LYCOMING O-320-A2D (150 HP) (Reciprocating)N-Number: 1138E, N1138E, N-1138E, Serial Number: 985-77, Year manufactured: 1977, Airworthiness Date: 05/08/2014, Certificate Issue Date: 07/21/2020Registrant (Individual): Jerry W David, 2198 Jacob Tome Memorial Hwy, Port Deposit, MD 21904Aircraft: BURKHART GROB GROB G115C (Category: Land, Weight: Up to 12,499 Pounds), Engine: LYCOMING 0-320 SERIES (180 HP) (Reciprocating)N-Number: 115MW, N115MW, N-115MW, Serial Number: 82037/C, Year manufactured: 1994, Airworthiness Date: 03/17/1995, Certificate Issue Date: 09/15/2008Registrant (Individual): Peter A Iii Barretta, 447 Bainbridge Rd, Port Deposit, MD 21904
Home Mortgage Disclosure Act Aggregated Statistics For Year 2009(Based on 1 partial tract) A) FHA, FSA/RHS & VA B) Conventional C) Refinancings D) Home Improvement Loans F) Non-occupant Loans on G) Loans On Manufactured Number Average Value Number Average Value Number Average Value Number Average Value Number Average Value Number Average Value
LOANS ORIGINATED 2 $290,445 2 $187,970 12 $227,225 2 $78,165 1 $220,250 0 $0 APPLICATIONS APPROVED, NOT ACCEPTED 0 $0 0 $0 2 $171,825 0 $0 0 $0 0 $0 APPLICATIONS DENIED 0 $0 0 $0 5 $245,010 1 $24,630 0 $0 1 $51,040 APPLICATIONS WITHDRAWN 0 $0 0 $0 4 $263,798 0 $0 0 $0 0 $0 FILES CLOSED FOR INCOMPLETENESS 0 $0 0 $0 1 $281,990 0 $0 0 $0 0 $0
Aggregated Statistics For Year 2008(Based on 1 partial tract) A) FHA, FSA/RHS & VA B) Conventional C) Refinancings D) Home Improvement Loans F) Non-occupant Loans on G) Loans On Manufactured Number Average Value Number Average Value Number Average Value Number Average Value Number Average Value Number Average Value
LOANS ORIGINATED 1 $261,220 3 $231,733 9 $201,858 1 $100,950 1 $225,320 1 $40,490 APPLICATIONS APPROVED, NOT ACCEPTED 0 $0 0 $0 2 $222,500 1 $30,910 0 $0 0 $0 APPLICATIONS DENIED 0 $0 1 $62,950 5 $185,198 1 $25,600 0 $0 1 $25,200 APPLICATIONS WITHDRAWN 0 $0 1 $171,220 3 $231,840 0 $0 0 $0 0 $0 FILES CLOSED FOR INCOMPLETENESS 0 $0 0 $0 1 $247,140 0 $0 0 $0 0 $0
Aggregated Statistics For Year 2007(Based on 1 partial tract) A) FHA, FSA/RHS & VA B) Conventional C) Refinancings D) Home Improvement Loans F) Non-occupant Loans on G) Loans On Manufactured Number Average Value Number Average Value Number Average Value Number Average Value Number Average Value Number Average Value
LOANS ORIGINATED 1 $153,760 6 $194,890 14 $193,171 3 $74,220 2 $139,625 1 $54,660 APPLICATIONS APPROVED, NOT ACCEPTED 0 $0 1 $195,450 2 $202,940 0 $0 0 $0 0 $0 APPLICATIONS DENIED 0 $0 3 $111,520 8 $247,498 2 $109,120 0 $0 2 $43,310 APPLICATIONS WITHDRAWN 0 $0 2 $162,650 4 $218,438 1 $173,480 0 $0 0 $0 FILES CLOSED FOR INCOMPLETENESS 0 $0 0 $0 1 $287,870 0 $0 0 $0 0 $0
Aggregated Statistics For Year 2006(Based on 1 partial tract) B) Conventional C) Refinancings D) Home Improvement Loans F) Non-occupant Loans on G) Loans On Manufactured Number Average Value Number Average Value Number Average Value Number Average Value Number Average Value
LOANS ORIGINATED 7 $237,349 17 $192,281 4 $82,995 1 $244,640 1 $72,450 APPLICATIONS APPROVED, NOT ACCEPTED 1 $283,120 2 $224,555 1 $16,500 0 $0 0 $0 APPLICATIONS DENIED 2 $98,410 8 $219,402 2 $62,065 1 $71,400 1 $46,690 APPLICATIONS WITHDRAWN 1 $145,380 7 $183,137 0 $0 0 $0 0 $0 FILES CLOSED FOR INCOMPLETENESS 0 $0 2 $186,235 0 $0 0 $0 0 $0
Aggregated Statistics For Year 2005(Based on 1 partial tract) B) Conventional C) Refinancings D) Home Improvement Loans F) Non-occupant Loans on G) Loans On Manufactured Number Average Value Number Average Value Number Average Value Number Average Value Number Average Value
LOANS ORIGINATED 11 $186,804 18 $174,162 4 $68,525 2 $113,305 2 $31,075 APPLICATIONS APPROVED, NOT ACCEPTED 1 $427,290 3 $170,283 1 $27,210 1 $77,600 1 $25,360 APPLICATIONS DENIED 3 $107,870 7 $188,450 2 $87,625 0 $0 2 $33,650 APPLICATIONS WITHDRAWN 1 $213,730 8 $196,842 1 $100,140 0 $0 0 $0 FILES CLOSED FOR INCOMPLETENESS 0 $0 2 $238,640 0 $0 0 $0 0 $0
Aggregated Statistics For Year 2004(Based on 1 partial tract) B) Conventional C) Refinancings D) Home Improvement Loans F) Non-occupant Loans on G) Loans On Manufactured Number Average Value Number Average Value Number Average Value Number Average Value Number Average Value
LOANS ORIGINATED 18 $204,492 17 $152,026 3 $67,110 3 $128,397 2 $39,685 APPLICATIONS APPROVED, NOT ACCEPTED 2 $162,410 4 $151,360 0 $0 0 $0 0 $0 APPLICATIONS DENIED 3 $136,583 7 $149,431 2 $68,990 0 $0 1 $63,510 APPLICATIONS WITHDRAWN 2 $201,370 8 $170,740 0 $0 0 $0 0 $0 FILES CLOSED FOR INCOMPLETENESS 1 $83,480 1 $254,860 0 $0 0 $0 0 $0
Aggregated Statistics For Year 2003(Based on 1 partial tract) A) FHA, FSA/RHS & VA B) Conventional C) Refinancings D) Home Improvement Loans F) Non-occupant Loans on Number Average Value Number Average Value Number Average Value Number Average Value Number Average Value
LOANS ORIGINATED 1 $100,140 10 $155,864 29 $131,343 2 $43,955 2 $97,445 APPLICATIONS APPROVED, NOT ACCEPTED 0 $0 1 $113,420 4 $130,370 1 $28,010 0 $0 APPLICATIONS DENIED 0 $0 1 $56,750 7 $120,071 1 $39,450 0 $0 APPLICATIONS WITHDRAWN 0 $0 1 $141,360 8 $126,516 0 $0 0 $0 FILES CLOSED FOR INCOMPLETENESS 0 $0 0 $0 1 $115,120 0 $0 0 $0
Aggregated Statistics For Year 2002(Based on 1 partial tract) A) FHA, FSA/RHS & VA B) Conventional C) Refinancings D) Home Improvement Loans F) Non-occupant Loans on Number Average Value Number Average Value Number Average Value Number Average Value Number Average Value
LOANS ORIGINATED 1 $185,230 8 $107,155 16 $112,393 2 $36,585 2 $79,615 APPLICATIONS APPROVED, NOT ACCEPTED 0 $0 1 $74,700 3 $122,923 0 $0 0 $0 APPLICATIONS DENIED 0 $0 1 $55,950 6 $110,003 1 $11,350 0 $0 APPLICATIONS WITHDRAWN 0 $0 0 $0 4 $131,980 0 $0 0 $0 FILES CLOSED FOR INCOMPLETENESS 0 $0 0 $0 1 $81,790 0 $0 0 $0
Aggregated Statistics For Year 2001(Based on 1 partial tract) A) FHA, FSA/RHS & VA B) Conventional C) Refinancings D) Home Improvement Loans F) Non-occupant Loans on Number Average Value Number Average Value Number Average Value Number Average Value Number Average Value
LOANS ORIGINATED 2 $122,520 5 $79,356 11 $97,361 2 $16,585 1 $80,420 APPLICATIONS APPROVED, NOT ACCEPTED 0 $0 1 $111,810 2 $89,760 0 $0 0 $0 APPLICATIONS DENIED 0 $0 4 $53,070 4 $99,780 1 $7,410 0 $0 APPLICATIONS WITHDRAWN 0 $0 0 $0 3 $89,383 0 $0 0 $0 FILES CLOSED FOR INCOMPLETENESS 0 $0 0 $0 1 $94,350 0 $0 0 $0
Aggregated Statistics For Year 2000(Based on 1 partial tract) A) FHA, FSA/RHS & VA B) Conventional C) Refinancings D) Home Improvement Loans F) Non-occupant Loans on Number Average Value Number Average Value Number Average Value Number Average Value Number Average Value
LOANS ORIGINATED 1 $165,430 8 $85,732 4 $82,332 3 $19,937 2 $70,315 APPLICATIONS APPROVED, NOT ACCEPTED 0 $0 1 $62,950 1 $63,510 0 $0 0 $0 APPLICATIONS DENIED 0 $0 5 $37,690 3 $60,267 1 $22,060 0 $0 APPLICATIONS WITHDRAWN 0 $0 1 $38,960 2 $83,720 1 $20,450 0 $0 FILES CLOSED FOR INCOMPLETENESS 0 $0 0 $0 0 $0 0 $0 0 $0
Aggregated Statistics For Year 1999(Based on 1 partial tract) A) FHA, FSA/RHS & VA B) Conventional C) Refinancings D) Home Improvement Loans F) Non-occupant Loans on Number Average Value Number Average Value Number Average Value Number Average Value Number Average Value
LOANS ORIGINATED 1 $147,780 8 $64,206 11 $87,940 2 $17,695 1 $46,940 APPLICATIONS APPROVED, NOT ACCEPTED 0 $0 1 $69,250 1 $123,700 0 $0 0 $0 APPLICATIONS DENIED 0 $0 5 $37,362 4 $107,342 1 $16,000 0 $0 APPLICATIONS WITHDRAWN 0 $0 1 $29,730 2 $90,215 1 $19,070 0 $0 FILES CLOSED FOR INCOMPLETENESS 0 $0 0 $0 1 $51,470 0 $0 0 $0
Detailed HMDA statistics for the following Tracts:
0312.01
Private Mortgage Insurance Companies Aggregated Statistics For Year 2008(Based on 1 partial tract) B) Refinancings Number Average Value
LOANS ORIGINATED 0 $0 APPLICATIONS APPROVED, NOT ACCEPTED 1 $185,870 APPLICATIONS DENIED 0 $0 APPLICATIONS WITHDRAWN 0 $0 FILES CLOSED FOR INCOMPLETENESS 0 $0
Aggregated Statistics For Year 2007(Based on 1 partial tract) A) Conventional B) Refinancings Number Average Value Number Average Value
LOANS ORIGINATED 1 $159,310 1 $355,650 APPLICATIONS APPROVED, NOT ACCEPTED 0 $0 0 $0 APPLICATIONS DENIED 0 $0 0 $0 APPLICATIONS WITHDRAWN 0 $0 0 $0 FILES CLOSED FOR INCOMPLETENESS 0 $0 0 $0
Aggregated Statistics For Year 2006(Based on 1 partial tract) B) Refinancings Number Average Value
LOANS ORIGINATED 1 $147,400 APPLICATIONS APPROVED, NOT ACCEPTED 0 $0 APPLICATIONS DENIED 0 $0 APPLICATIONS WITHDRAWN 0 $0 FILES CLOSED FOR INCOMPLETENESS 0 $0
Aggregated Statistics For Year 2005(Based on 1 partial tract) A) Conventional B) Refinancings Number Average Value Number Average Value
LOANS ORIGINATED 1 $203,660 1 $139,750 APPLICATIONS APPROVED, NOT ACCEPTED 0 $0 0 $0 APPLICATIONS DENIED 0 $0 0 $0 APPLICATIONS WITHDRAWN 0 $0 0 $0 FILES CLOSED FOR INCOMPLETENESS 0 $0 0 $0
Aggregated Statistics For Year 2004(Based on 1 partial tract) A) Conventional B) Refinancings Number Average Value Number Average Value
LOANS ORIGINATED 2 $191,630 1 $176,130 APPLICATIONS APPROVED, NOT ACCEPTED 0 $0 0 $0 APPLICATIONS DENIED 0 $0 0 $0 APPLICATIONS WITHDRAWN 0 $0 0 $0 FILES CLOSED FOR INCOMPLETENESS 0 $0 0 $0
Aggregated Statistics For Year 2003(Based on 1 partial tract) A) Conventional B) Refinancings Number Average Value Number Average Value
LOANS ORIGINATED 2 $175,250 2 $156,935 APPLICATIONS APPROVED, NOT ACCEPTED 0 $0 0 $0 APPLICATIONS DENIED 0 $0 0 $0 APPLICATIONS WITHDRAWN 0 $0 0 $0 FILES CLOSED FOR INCOMPLETENESS 0 $0 0 $0
Aggregated Statistics For Year 2002(Based on 1 partial tract) A) Conventional B) Refinancings Number Average Value Number Average Value
LOANS ORIGINATED 2 $114,510 2 $162,730 APPLICATIONS APPROVED, NOT ACCEPTED 0 $0 0 $0 APPLICATIONS DENIED 0 $0 0 $0 APPLICATIONS WITHDRAWN 0 $0 0 $0 FILES CLOSED FOR INCOMPLETENESS 0 $0 0 $0
Aggregated Statistics For Year 2001(Based on 1 partial tract) A) Conventional B) Refinancings Number Average Value Number Average Value
LOANS ORIGINATED 1 $101,830 1 $123,000 APPLICATIONS APPROVED, NOT ACCEPTED 0 $0 0 $0 APPLICATIONS DENIED 0 $0 0 $0 APPLICATIONS WITHDRAWN 0 $0 0 $0 FILES CLOSED FOR INCOMPLETENESS 0 $0 0 $0
Aggregated Statistics For Year 2000(Based on 1 partial tract) A) Conventional B) Refinancings Number Average Value Number Average Value
LOANS ORIGINATED 1 $107,390 1 $75,110 APPLICATIONS APPROVED, NOT ACCEPTED 0 $0 0 $0 APPLICATIONS DENIED 0 $0 0 $0 APPLICATIONS WITHDRAWN 0 $0 0 $0 FILES CLOSED FOR INCOMPLETENESS 0 $0 0 $0
Aggregated Statistics For Year 1999(Based on 1 partial tract) A) Conventional B) Refinancings Number Average Value Number Average Value
LOANS ORIGINATED 1 $97,610 1 $85,240 APPLICATIONS APPROVED, NOT ACCEPTED 0 $0 0 $0 APPLICATIONS DENIED 0 $0 0 $0 APPLICATIONS WITHDRAWN 0 $0 0 $0 FILES CLOSED FOR INCOMPLETENESS 0 $0 0 $0
Detailed PMIC statistics for the following Tracts:
0312.01
Most common first names in Port Deposit, MD among deceased individuals Name Count Lived (average)
John 42 69.0 years Mary 39 77.0 years Robert 31 68.5 years William 29 73.9 years James 27 69.3 years Charles 22 74.1 years Margaret 18 81.7 years Elizabeth 16 75.1 years Ruth 15 80.7 years Helen 15 74.4 years
Most common last names in Port Deposit, MD among deceased individuals Last name Count Lived (average)
Jackson 18 78.1 years Jones 15 68.8 years Brown 12 64.7 years Smith 11 75.3 years Burlin 11 69.0 years Clark 10 79.4 years Bennett 9 70.1 years Griffin 9 73.2 years Williams 8 74.2 years Boddy 8 74.4 years
Port Deposit compared to Maryland state average:
Median household income below state average. Median house value below state average. Median age above state average. Foreign-born population percentage significantly below state average. Renting percentage above state average. Length of stay since moving in below state average. Institutionalized population percentage above state average.
Top Patent Applicants
David W. Nesbitt (16)
Eric Schepers (10)
Christine B. Hazel (10)
Joseph L. Lenhart (6)
Edward K. Eldreth (6)
Randy A. Mrozek (4)
Anthony Cruz (3)
Brian T. Cantrell (3)
David William Nesbitt (3)
Eric J. Schepers (2)
Total of 73 patent applications in 2008-2024.

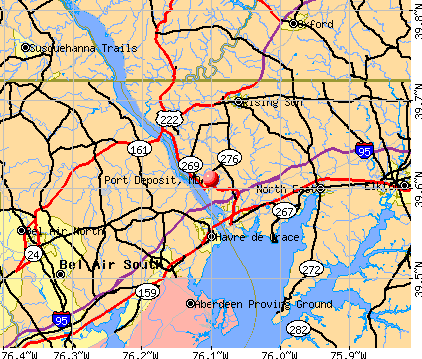


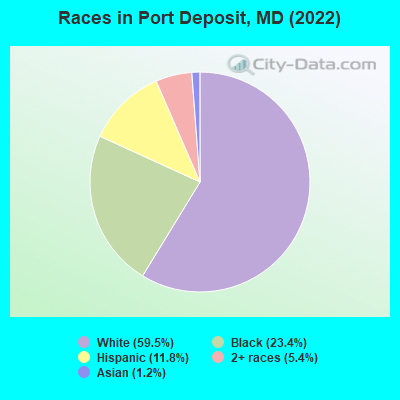
 Recent articles from our blog. Our writers, many of them Ph.D. graduates or candidates, create easy-to-read articles on a wide variety of topics.

 , pop. 67,114).
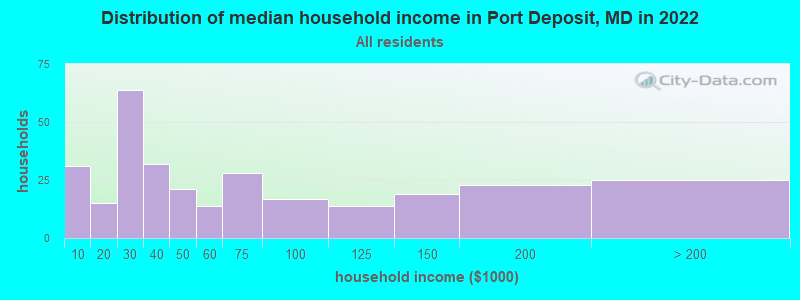
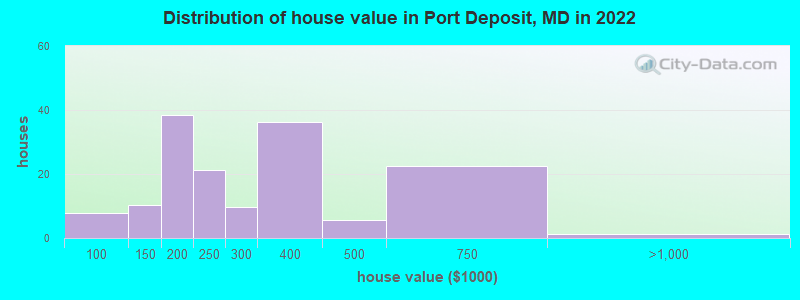

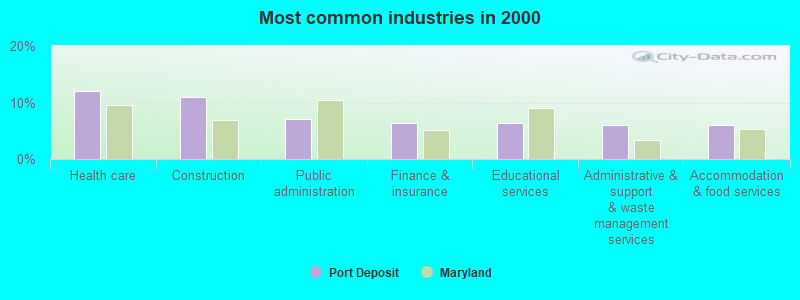
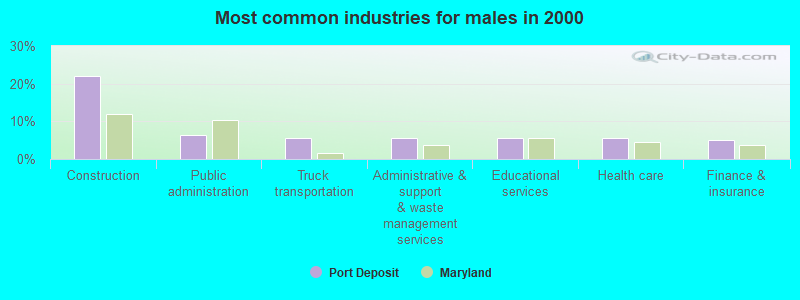
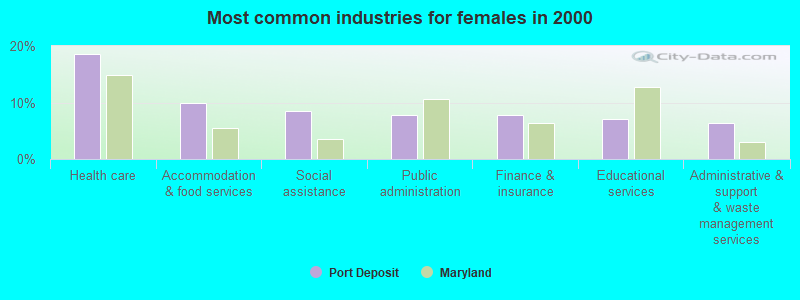
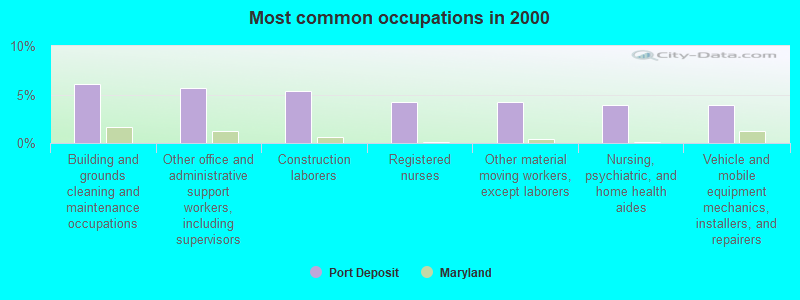
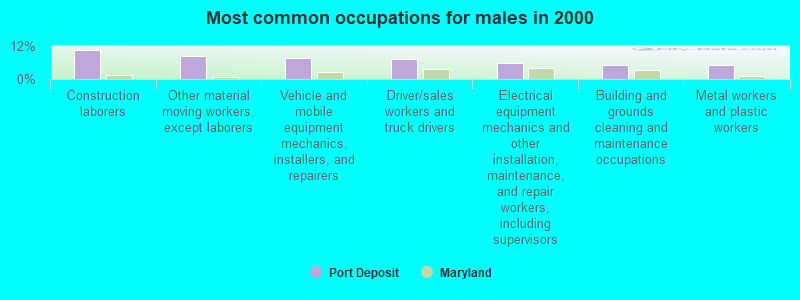
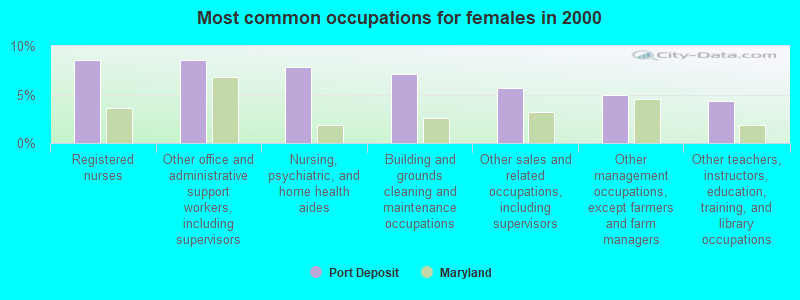


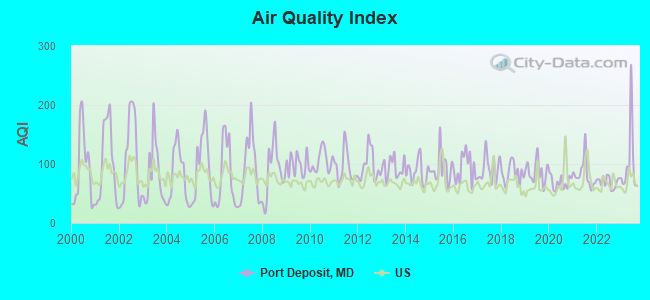
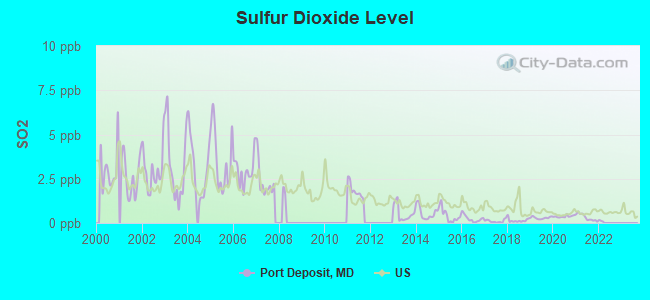
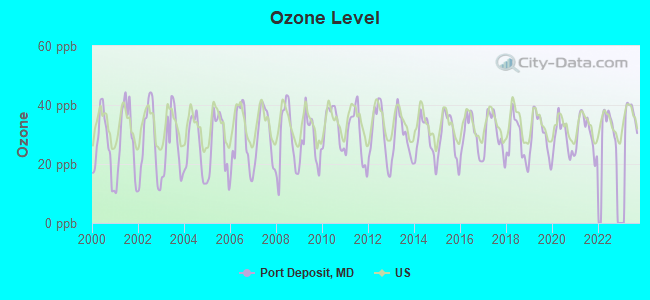
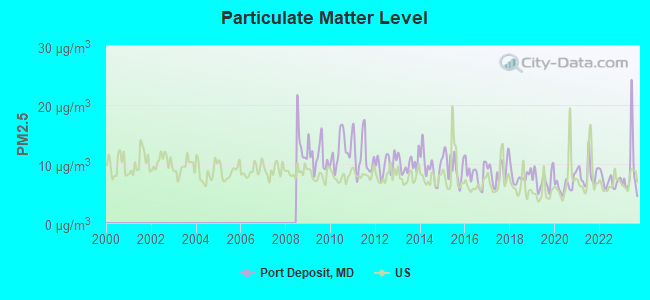
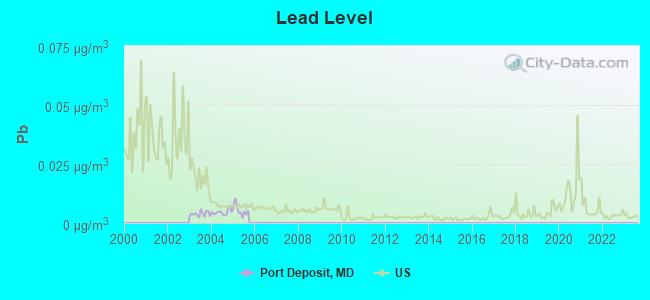

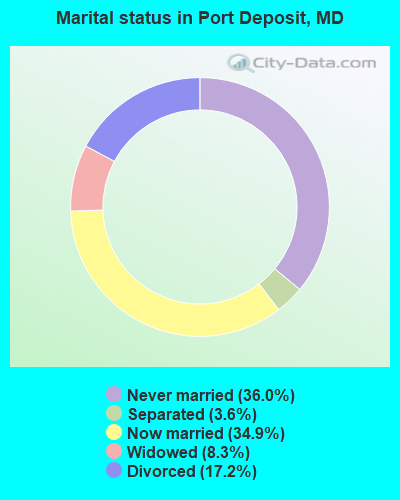
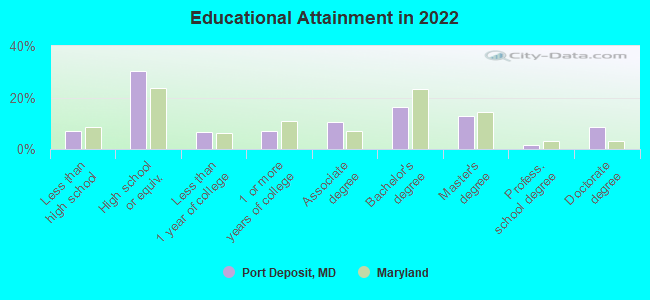
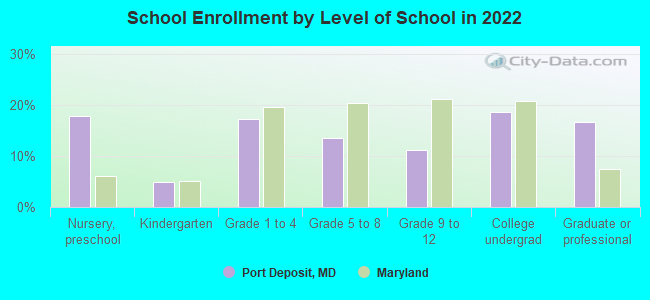
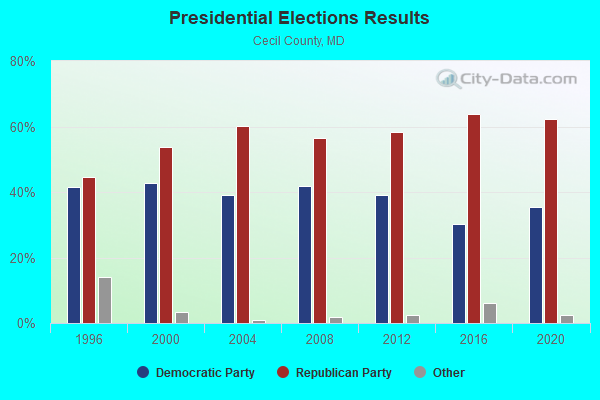
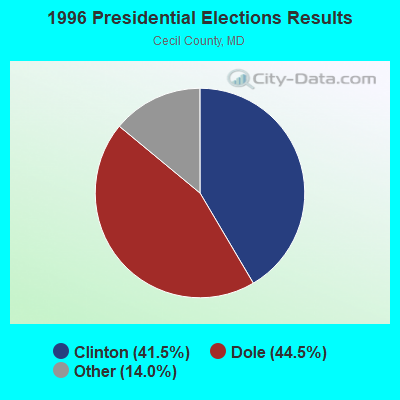
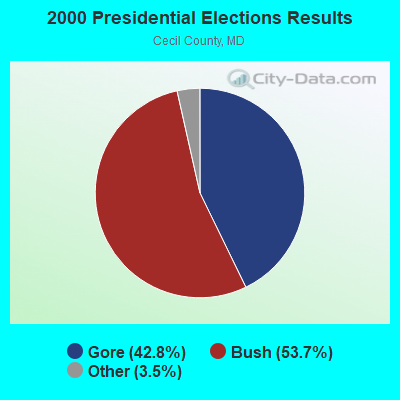
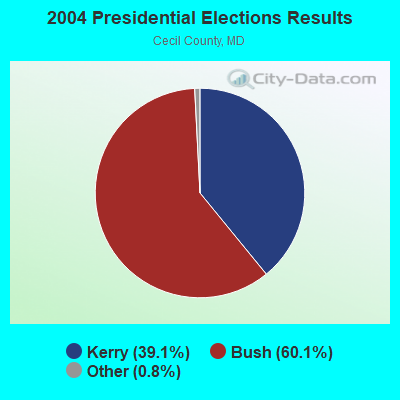
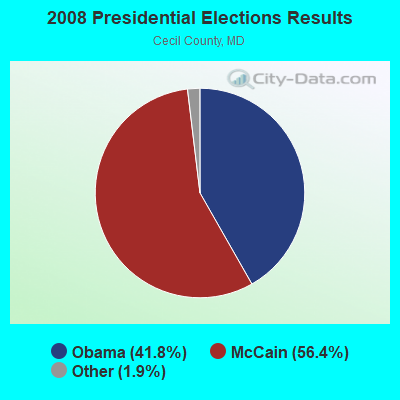
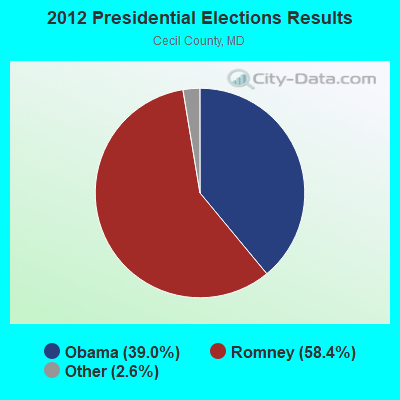
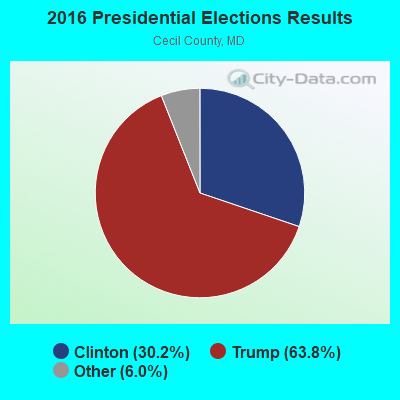
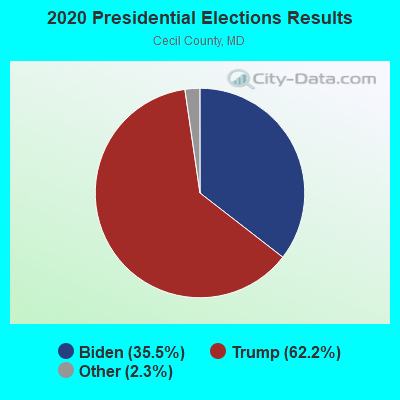
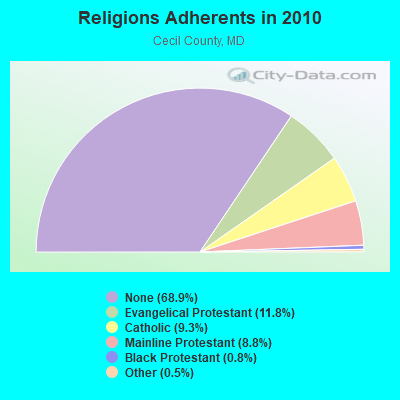
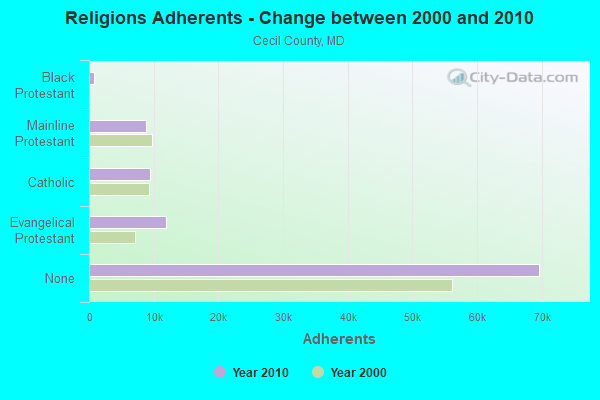
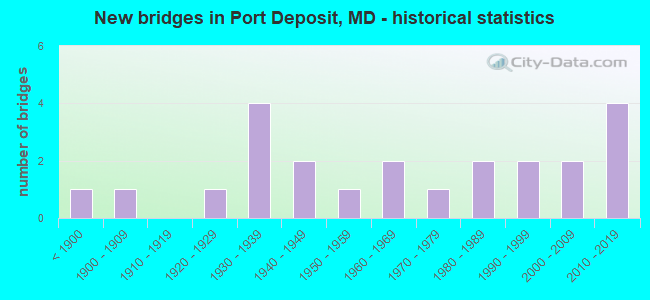
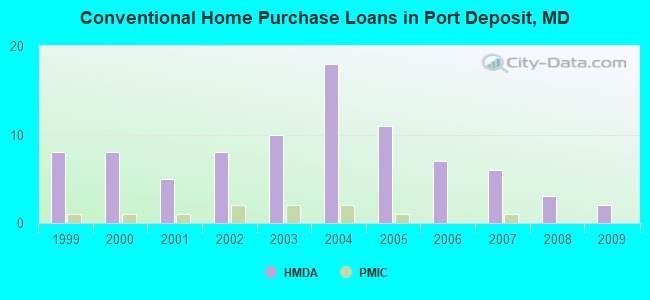
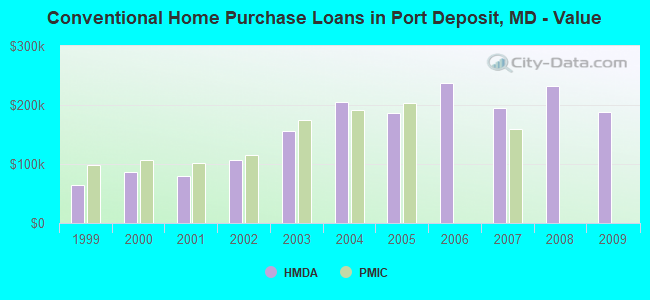
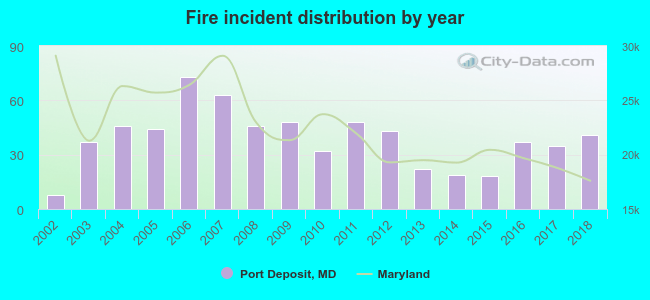 Based on the data from the years 2002 - 2018 the average number of fires per year is 39. The highest number of reported fires - 73 took place in 2006, and the least - 8 in 2002. The data has a rising trend.
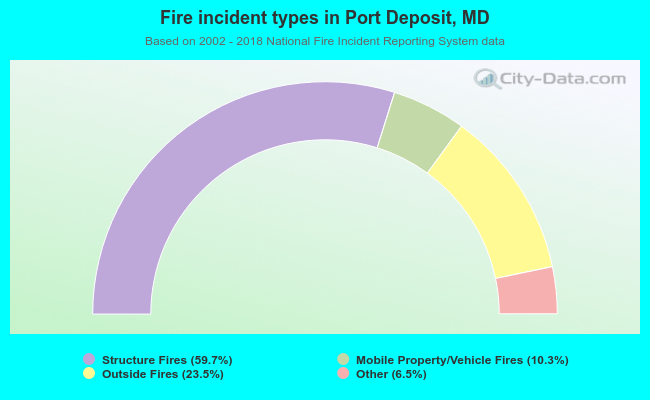 When looking into fire subcategories, the most reports belonged to: Structure Fires (59.7%), and Outside Fires (23.5%).