Niles, Michigan

Niles: Niles, MIchigan Railroad Depot
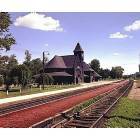
Niles: Niles Depot taken in 1976 by Roger Rieman in Niles, Michigan
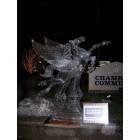
Niles: Hunter Ice Festival 2007
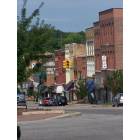
Niles: Downtown Niles 07
Niles: Niles MI June 2007
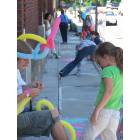
Niles: Arts in Motion - Chalk the Walk contest
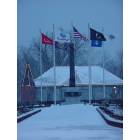
Niles: Veteran's Memorial
Niles: Niles City Hall
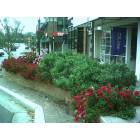
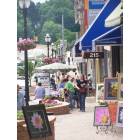
Niles: Downtown Niles
Niles: Welcome to the Niles DDA Main Street District
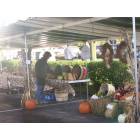
Niles: Niles Bensidoun French Market
- see
17
more - add
your
Submit your own pictures of this city and show them to the world
- OSM Map
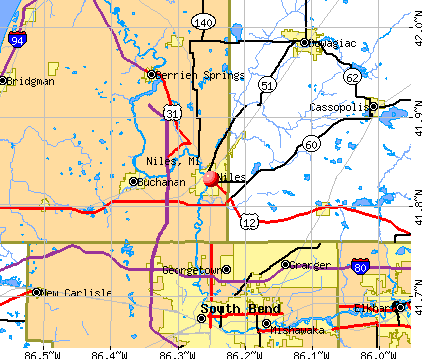
- General Map
- Google Map
- MSN Map
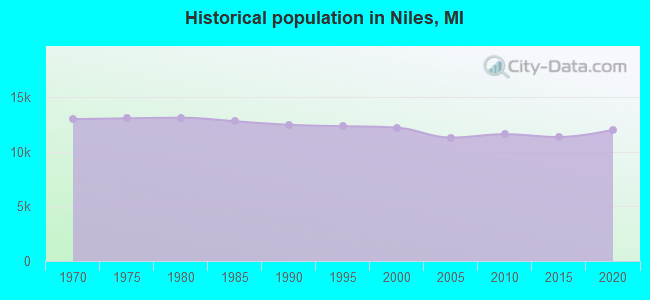
Population change since 2000: -3.6%
 |
| Males: 5,569 | |
| Females: 6,192 |
| Median resident age: | 38.2 years |
| Michigan median age: | 40.3 years |
Zip codes: 49120.
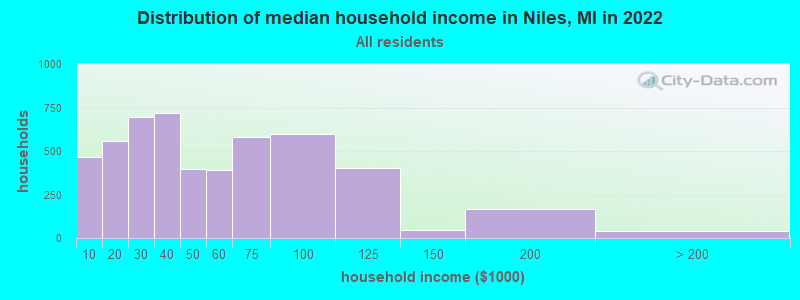
| Niles: | $42,847 |
| MI: | $66,986 |
Estimated per capita income in 2022: $23,627 (it was $16,584 in 2000)
Niles city income, earnings, and wages data
Estimated median house or condo value in 2022: $117,377 (it was $70,300 in 2000)
| Niles: | $117,377 |
| MI: | $224,400 |
Mean prices in 2022: all housing units: $262,582; detached houses: $272,682; townhouses or other attached units: $257,281; in 2-unit structures: $260,402; in 3-to-4-unit structures: $314,873; in 5-or-more-unit structures: $390,605; mobile homes: $53,360; occupied boats, rvs, vans, etc.: $664,370
Median gross rent in 2022: $800.
(18.1% for White Non-Hispanic residents, 33.0% for Black residents, 49.2% for Hispanic or Latino residents, 82.2% for other race residents, 18.4% for two or more races residents)
Detailed information about poverty and poor residents in Niles, MI


Compare current foreclosures in Niles, MI:
| Photo | Address | Area | Beds / Baths | Price | Details |
|---|---|---|---|---|---|

|
#1
Pine St
Niles, MI 49120
|
1,800 sq. feet
|
3 baths 3 beds |
show details | |

|
#2
Fair Oaks St E
Niles, MI 49120
|
900 sq. feet
|
1 baths 1 beds |
show details | |

|
#3
Grant St
Niles, MI 49120
|
2,200 sq. feet
|
3 baths 5 beds |
show details | |

|
#4
Jeffrey Ln
Niles, MI 49120
|
1,623 sq. feet
|
2 baths 2 beds |
show details | |

|
#5
S 3rd St
Niles, MI 49120
|
1,762 sq. feet
|
2 baths 3 beds |
show details | |

|
#6
Herbert St
Niles, MI 49120
|
- sq. feet
|
1 baths 4 beds |
show details | |

|
#7
Lake St
Niles, MI 49120
|
- sq. feet
|
- baths - beds |
show details | |

|
#8
Bond St Apt 1
Niles, MI 49120
|
- sq. feet
|
- baths - beds |
show details | |

|
#9
Carberry Rd
Niles, MI 49120
|
- sq. feet
|
- baths - beds |
show details | |

|
#10
Ontario Rd
Niles, MI 49120
|
- sq. feet
|
- baths - beds |
show details |
| Photo | Address | Area | Beds / Baths | Price | Details |
|---|---|---|---|---|---|

|
#11
Mannix St
Niles, MI 49120
|
- sq. feet
|
- baths - beds |
show details | |

|
#12
Mobile Blvd # 7
Niles, MI 49120
|
- sq. feet
|
- baths - beds |
show details | |

|
#13
Chippewa St
Niles, MI 49120
|
- sq. feet
|
- baths - beds |
show details | |

|
#14
N 5th St Apt 129
Niles, MI 49120
|
- sq. feet
|
- baths - beds |
show details | |

|
#15
S 15th St
Niles, MI 49120
|
- sq. feet
|
- baths - beds |
show details | |

|
#16
Mobile Blvd Lot 56
Niles, MI 49120
|
- sq. feet
|
- baths - beds |
show details | |

|
#17
N 6th St # B
Niles, MI 49120
|
- sq. feet
|
- baths - beds |
show details | |

|
#18
Hickory St
Niles, MI 49120
|
- sq. feet
|
- baths - beds |
show details | |

|
#19
East St
Niles, MI 49120
|
- sq. feet
|
- baths - beds |
show details | |

|
#20
Woods Edge Dr
Niles, MI 49120
|
- sq. feet
|
- baths - beds |
show details |
| Photo | Address | Area | Beds / Baths | Price | Details |
|---|---|---|---|---|---|

|
#21
Totomee Ln
Niles, MI 49120
|
- sq. feet
|
- baths - beds |
show details | |

|
#22
Redbud Trl
Niles, MI 49120
|
- sq. feet
|
- baths - beds |
show details | |

|
#23
N Old Us 31
Niles, MI 49120
|
- sq. feet
|
- baths - beds |
show details | |

|
#24
N Philip Rd
Niles, MI 49120
|
- sq. feet
|
- baths - beds |
show details | |

|
#25
Arbor Dr
Niles, MI 49120
|
- sq. feet
|
- baths - beds |
show details | |

|
#26
Invicta Dr
Niles, MI 49120
|
- sq. feet
|
- baths - beds |
show details | |

|
#27
S 13th St Lot 8
Niles, MI 49120
|
- sq. feet
|
- baths - beds |
show details | |

|
#28
S 15th St
Niles, MI 49120
|
- sq. feet
|
- baths - beds |
show details | |

|
#29
S 17th St
Niles, MI 49120
|
- sq. feet
|
- baths - beds |
show details | |

|
#30
Shady Shores Dr
Niles, MI 49120
|
- sq. feet
|
- baths - beds |
show details |
| Photo | Address | Area | Beds / Baths | Price | Details |
|---|---|---|---|---|---|

|
#31
Rebecca Ln
Niles, MI 49120
|
- sq. feet
|
- baths - beds |
show details | |

|
#32
W Park Dr
Niles, MI 49120
|
- sq. feet
|
- baths - beds |
show details | |

|
#33
Silverbrook Ave
Niles, MI 49120
|
- sq. feet
|
- baths - beds |
show details | |

|
#34
S Saint Joseph Ave
Niles, MI 49120
|
- sq. feet
|
- baths - beds |
show details | |

|
#35
Hickory St
Niles, MI 49120
|
- sq. feet
|
- baths - beds |
show details | |

|
#36
Ferry St
Niles, MI 49120
|
- sq. feet
|
- baths - beds |
show details | |

|
#37
Sycamore St
Niles, MI 49120
|
- sq. feet
|
- baths - beds |
show details | |

|
#38
Creek Rd
Niles, MI 49120
|
- sq. feet
|
- baths - beds |
show details | |

|
Check over 1 million property listings on Foreclosure.com!
|
browse all offers | |||


- 8,89575.4%White alone
- 1,50212.7%Black alone
- 5794.9%Two or more races
- 5604.7%Hispanic
- 430.4%American Indian alone
- 340.3%Asian alone
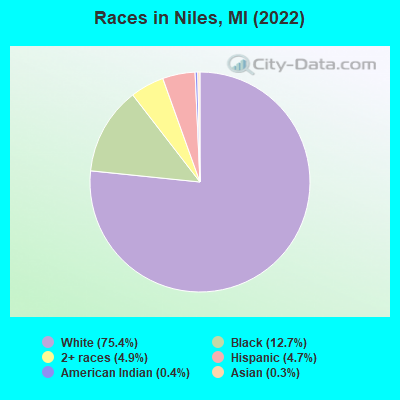
Races in Niles detailed stats: ancestries, foreign born residents, place of birth
According to our research of Michigan and other state lists, there were 165 registered sex offenders living in Niles, Michigan as of May 28, 2024.
The ratio of all residents to sex offenders in Niles is 68 to 1.
Type |
2009 |
2010 |
2011 |
2012 |
2013 |
2014 |
2015 |
2016 |
2017 |
2018 |
2019 |
2020 |
2021 |
2022 |
|---|---|---|---|---|---|---|---|---|---|---|---|---|---|---|
| Murders (per 100,000) | 1 (9.0) | 0 (0.0) | 0 (0.0) | 0 (0.0) | 0 (0.0) | 0 (0.0) | 0 (0.0) | 0 (0.0) | 1 (8.9) | 0 (0.0) | 0 (0.0) | 0 (0.0) | 0 (0.0) | 1 (8.5) |
| Rapes (per 100,000) | 12 (107.5) | 17 (146.6) | 12 (103.5) | 12 (103.3) | 14 (122.0) | 14 (122.9) | 13 (114.5) | 21 (186.1) | 16 (142.8) | 21 (188.3) | 22 (198.1) | 16 (144.1) | 18 (163.0) | 10 (85.1) |
| Robberies (per 100,000) | 15 (134.4) | 5 (43.1) | 4 (34.5) | 9 (77.5) | 6 (52.3) | 13 (114.1) | 7 (61.7) | 12 (106.4) | 9 (80.3) | 14 (125.5) | 18 (162.1) | 11 (99.1) | 8 (72.4) | 7 (59.5) |
| Assaults (per 100,000) | 37 (331.6) | 30 (258.6) | 17 (146.7) | 32 (275.5) | 34 (296.4) | 37 (324.9) | 31 (273.1) | 32 (283.6) | 42 (374.9) | 38 (340.7) | 49 (441.2) | 47 (423.3) | 44 (398.4) | 51 (433.8) |
| Burglaries (per 100,000) | 66 (591.5) | 72 (620.7) | 92 (793.7) | 62 (533.7) | 45 (392.3) | 57 (500.5) | 50 (440.5) | 65 (576.1) | 57 (508.8) | 49 (439.3) | 46 (414.2) | 43 (387.3) | 23 (208.2) | 25 (212.7) |
| Thefts (per 100,000) | 303 (2,715) | 281 (2,422) | 309 (2,666) | 308 (2,651) | 241 (2,101) | 258 (2,265) | 222 (1,956) | 191 (1,693) | 171 (1,527) | 200 (1,793) | 268 (2,413) | 225 (2,027) | 226 (2,046) | 209 (1,778) |
| Auto thefts (per 100,000) | 18 (161.3) | 17 (146.6) | 18 (155.3) | 20 (172.2) | 18 (156.9) | 17 (149.3) | 17 (149.8) | 32 (283.6) | 39 (348.2) | 28 (251.0) | 38 (342.2) | 61 (549.5) | 43 (389.3) | 43 (365.8) |
| Arson (per 100,000) | 3 (26.9) | 2 (17.2) | 6 (51.8) | 4 (34.4) | 2 (17.4) | 0 (0.0) | 5 (44.0) | 4 (35.5) | 6 (53.6) | 2 (17.9) | 1 (9.0) | 2 (18.0) | 6 (54.3) | 2 (17.0) |
| City-Data.com crime index | 373.5 | 334.0 | 297.1 | 318.2 | 296.7 | 335.1 | 285.8 | 368.3 | 355.7 | 379.0 | 448.2 | 381.8 | 359.3 | 305.0 |
The City-Data.com crime index weighs serious crimes and violent crimes more heavily. Higher means more crime, U.S. average is 246.1. It adjusts for the number of visitors and daily workers commuting into cities.
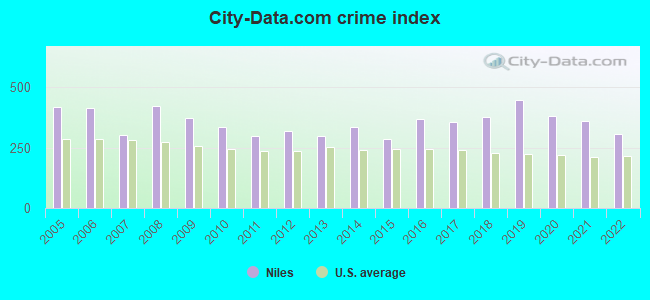
Crime rate in Niles detailed stats: murders, rapes, robberies, assaults, burglaries, thefts, arson
Full-time law enforcement employees in 2021, including police officers: 28 (18 officers - 16 male; 2 female).
| Officers per 1,000 residents here: | 1.63 |
| Michigan average: | 1.86 |
 Recent articles from our blog. Our writers, many of them Ph.D. graduates or candidates, create easy-to-read articles on a wide variety of topics.

 | Magical Small Towns in Michigan (27 replies) |
| Michigan winter thread (120 replies) |
| Retiring outside of Kalamazoo with Bees! (9 replies) |
| Good Walking Towns in Michigan? (12 replies) |
| Next Michigan metro to reach the 1 million population mark? (14 replies) |
| Can Detroit have high speed rail to Chicago and Toronto? (81 replies) |
Latest news from Niles, MI collected exclusively by city-data.com from local newspapers, TV, and radio stations
Ancestries: German (16.6%), Norwegian (7.5%), Irish (6.5%), American (5.7%), European (5.3%), English (5.2%).
Current Local Time: EST time zone
Elevation: 658 feet
Land area: 5.79 square miles.
Population density: 2,033 people per square mile (low).
360 residents are foreign born (1.2% Latin America, 0.9% Africa, 0.5% Asia, 0.4% Europe).
| This city: | 3.1% |
| Michigan: | 6.9% |
Median real estate property taxes paid for housing units with mortgages in 2022: $1,529 (1.2%)
Median real estate property taxes paid for housing units with no mortgage in 2022: $1,499 (1.4%)
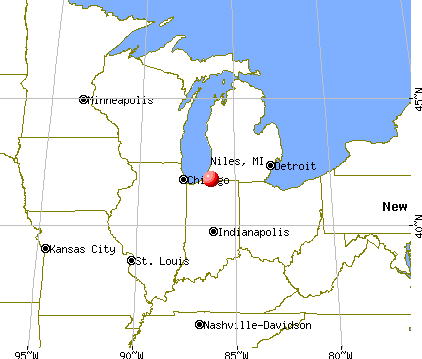
Nearest city with pop. 50,000+: South Bend, IN  (10.9 miles , pop. 107,789).
Nearest city with pop. 200,000+: Chicago, IL (73.6 miles , pop. 2,896,016).
Nearest cities:
), ), ), Latitude: 41.83 N, Longitude: 86.25 W
Daytime population change due to commuting: -1,404 (-11.9%)
Workers who live and work in this city: 995 (18.9%)
Area code: 269


Niles, Michigan accommodation & food services, waste management - Economy and Business Data
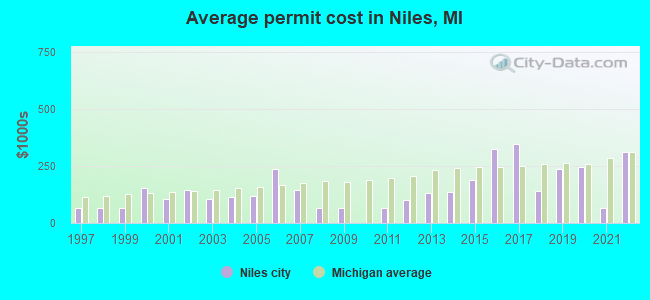
Single-family new house construction building permits:
- 2022: 2 buildings, average cost: $312,700
- 2021: 1 building, cost: $65,000
- 2020: 2 buildings, average cost: $245,000
- 2019: 2 buildings, average cost: $237,500
- 2018: 2 buildings, average cost: $138,500
- 2017: 3 buildings, average cost: $345,600
- 2016: 2 buildings, average cost: $324,000
- 2015: 2 buildings, average cost: $187,500
- 2014: 2 buildings, average cost: $138,000
- 2013: 2 buildings, average cost: $133,200
- 2012: 2 buildings, average cost: $102,500
- 2011: 1 building, cost: $65,000
- 2009: 1 building, cost: $65,000
- 2008: 1 building, cost: $65,000
- 2007: 2 buildings, average cost: $145,000
- 2006: 1 building, cost: $238,000
- 2005: 6 buildings, average cost: $118,500
- 2004: 5 buildings, average cost: $114,400
- 2003: 6 buildings, average cost: $107,000
- 2002: 9 buildings, average cost: $146,200
- 2001: 5 buildings, average cost: $106,300
- 2000: 9 buildings, average cost: $154,800
- 1999: 6 buildings, average cost: $66,300
- 1998: 5 buildings, average cost: $66,300
- 1997: 4 buildings, average cost: $66,300

| Here: | 3.8% |
| Michigan: | 3.5% |
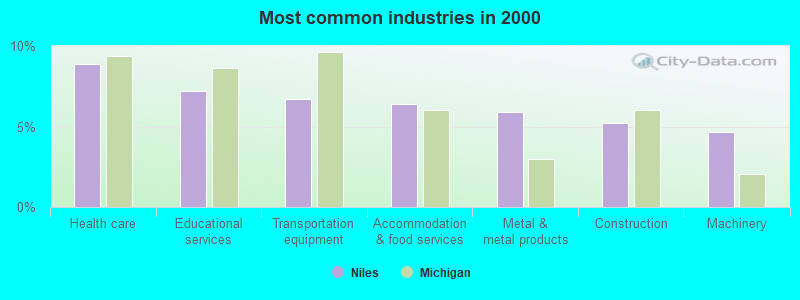
- Health care (8.9%)
- Educational services (7.2%)
- Transportation equipment (6.7%)
- Accommodation & food services (6.4%)
- Metal & metal products (5.9%)
- Construction (5.2%)
- Machinery (4.7%)
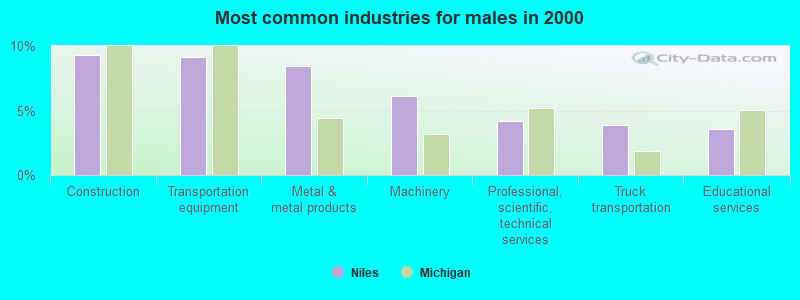
- Construction (9.3%)
- Transportation equipment (9.1%)
- Metal & metal products (8.5%)
- Machinery (6.1%)
- Professional, scientific, technical services (4.2%)
- Truck transportation (3.9%)
- Educational services (3.6%)
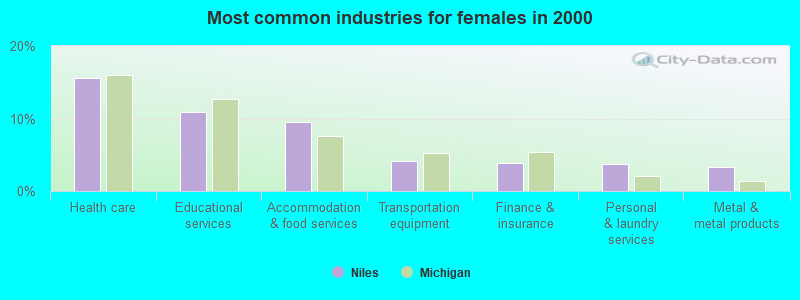
- Health care (15.6%)
- Educational services (11.0%)
- Accommodation & food services (9.5%)
- Transportation equipment (4.2%)
- Finance & insurance (3.9%)
- Personal & laundry services (3.8%)
- Metal & metal products (3.3%)
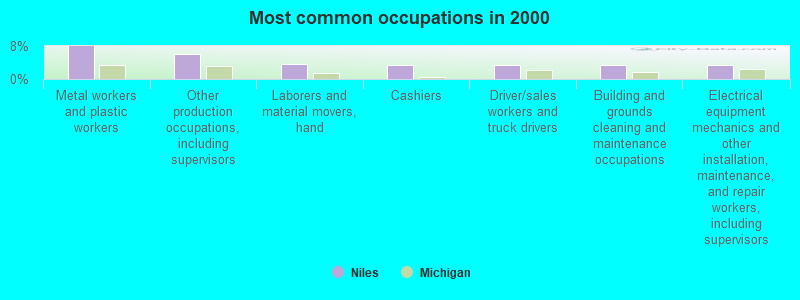
- Metal workers and plastic workers (7.9%)
- Other production occupations, including supervisors (6.1%)
- Laborers and material movers, hand (3.7%)
- Cashiers (3.5%)
- Driver/sales workers and truck drivers (3.4%)
- Building and grounds cleaning and maintenance occupations (3.3%)
- Electrical equipment mechanics and other installation, maintenance, and repair workers, including supervisors (3.3%)
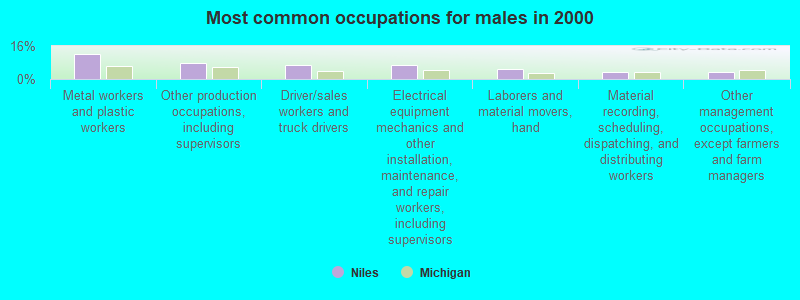
- Metal workers and plastic workers (12.2%)
- Other production occupations, including supervisors (7.7%)
- Driver/sales workers and truck drivers (6.7%)
- Electrical equipment mechanics and other installation, maintenance, and repair workers, including supervisors (6.6%)
- Laborers and material movers, hand (4.6%)
- Material recording, scheduling, dispatching, and distributing workers (3.6%)
- Other management occupations, except farmers and farm managers (3.4%)
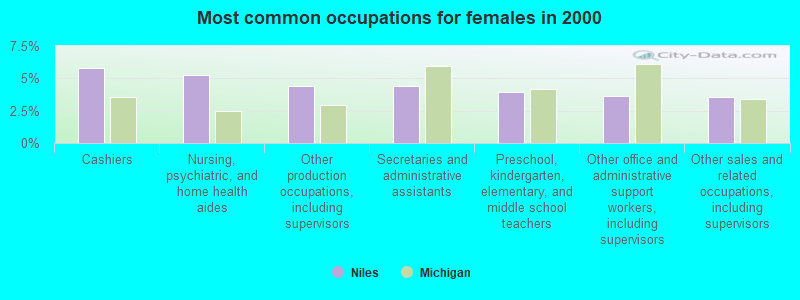
- Cashiers (5.8%)
- Nursing, psychiatric, and home health aides (5.2%)
- Other production occupations, including supervisors (4.4%)
- Secretaries and administrative assistants (4.4%)
- Preschool, kindergarten, elementary, and middle school teachers (3.9%)
- Other office and administrative support workers, including supervisors (3.7%)
- Other sales and related occupations, including supervisors (3.6%)
Average climate in Niles, Michigan
Based on data reported by over 4,000 weather stations


|
|

(lower is better)
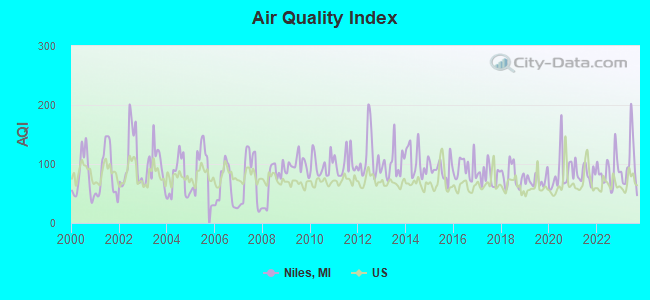
Air Quality Index (AQI) level in 2023 was 99.1. This is worse than average.
| City: | 99.1 |
| U.S.: | 72.6 |
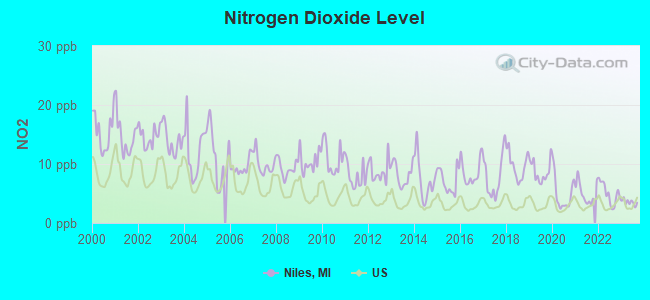
Nitrogen Dioxide (NO2) [ppb] level in 2023 was 3.52. This is significantly better than average. Closest monitor was 9.4 miles away from the city center.
| City: | 3.52 |
| U.S.: | 5.11 |
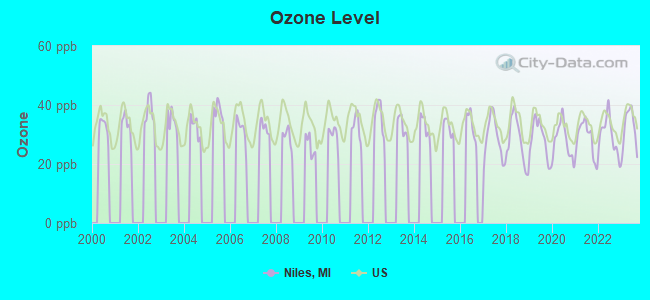
Ozone [ppb] level in 2023 was 32.1. This is about average. Closest monitor was 8.9 miles away from the city center.
| City: | 32.1 |
| U.S.: | 33.3 |
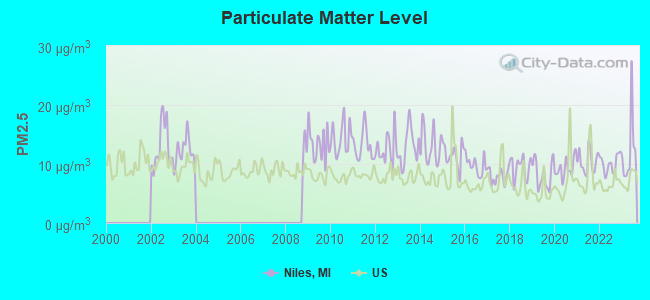
Particulate Matter (PM2.5) [µg/m3] level in 2023 was 12.3. This is significantly worse than average. Closest monitor was 9.4 miles away from the city center.
| City: | 12.3 |
| U.S.: | 8.1 |
Tornado activity:
Niles-area historical tornado activity is above Michigan state average. It is 47% greater than the overall U.S. average.
On 4/11/1965, a category F4 (max. wind speeds 207-260 mph) tornado 17.5 miles away from the Niles city center killed 36 people and injured 321 people.
On 4/11/1965, a category F4 tornado 23.4 miles away from the city center killed 31 people and injured 252 people.
Earthquake activity:
Niles-area historical earthquake activity is significantly above Michigan state average. It is 6% greater than the overall U.S. average.On 4/18/2008 at 09:36:59, a magnitude 5.4 (5.1 MB, 4.8 MS, 5.4 MW, 5.2 MW, Class: Moderate, Intensity: VI - VII) earthquake occurred 249.1 miles away from the city center
On 6/10/1987 at 23:48:54, a magnitude 5.1 (4.9 MB, 4.4 MS, 4.6 MS, 5.1 LG) earthquake occurred 225.3 miles away from Niles center
On 4/18/2008 at 09:36:59, a magnitude 5.2 (5.2 MW, Depth: 8.9 mi) earthquake occurred 249.2 miles away from Niles center
On 5/2/2015 at 16:23:07, a magnitude 4.2 (4.2 MW, Depth: 2.8 mi, Class: Light, Intensity: IV - V) earthquake occurred 50.7 miles away from Niles center
On 7/12/1986 at 08:19:37, a magnitude 4.5 (4.5 MB) earthquake occurred 132.6 miles away from the city center
On 7/27/1980 at 18:52:21, a magnitude 5.2 (5.1 MB, 4.7 MS, 5.0 UK, 5.2 UK) earthquake occurred 278.9 miles away from Niles center
Magnitude types: regional Lg-wave magnitude (LG), body-wave magnitude (MB), surface-wave magnitude (MS), moment magnitude (MW)
Natural disasters:
The number of natural disasters in Berrien County (11) is smaller than the US average (15).Major Disasters (Presidential) Declared: 6
Emergencies Declared: 4
Causes of natural disasters: Floods: 6, Storms: 5, Winter Storms: 2, Blizzard: 1, Hurricane: 1, Snowstorm: 1, Tornado: 1, Wind: 1, Other: 1 (Note: some incidents may be assigned to more than one category).

Hospitals and medical centers in Niles:
Airports and other landing facilities located in Niles:
- Jerry Tyler Memorial Airport (3TR) (Runways: 2, Itinerant Ops: 1,500, Local Ops: 1,500)
- Crump Airport (MI22) (Runways: 1)
- Rentz Ultralight (31MI)
Operable nuclear power plants near Niles:
- 18 miles: Donald C. Cook 1 and 2 in Bridgman, MI.
Colleges/universities with over 2000 students nearest to Niles:
- University of Notre Dame (about 9 miles; Notre Dame, IN; Full-time enrollment: 12,214)
- Andrews University (about 11 miles; Berrien Springs, MI; FT enrollment: 3,103)
- Indiana University-South Bend (about 12 miles; South Bend, IN; FT enrollment: 5,563)
- Lake Michigan College (about 20 miles; Benton Harbor, MI; FT enrollment: 2,341)
- Purdue University-North Central Campus (about 38 miles; Westville, IN; FT enrollment: 3,682)
- Kalamazoo Valley Community College (about 41 miles; Kalamazoo, MI; FT enrollment: 7,369)
- Western Michigan University (about 46 miles; Kalamazoo, MI; FT enrollment: 20,840)
Public high schools in Niles:
- NILES SENIOR HIGH SCHOOL (Students: 1,121, Location: 1441 EAGLE ST, Grades: 9-12)
- BRANDYWINE SENIOR HIGH SCHOOL (Students: 457, Location: 1700 BELL RD, Grades: 9-12)
- CEDAR LANE SCHOOL (Students: 86, Location: 2301 NILES BUCHANAN RD, Grades: 9-12)
- SOUTHSIDE SPECIAL EDUC SCHOOL (Students: 82, Location: 1450 SILVERBROOK AVE, Grades: 4-12)
- BELL EDUCATION CENTER (Students: 69, Location: 1830 S. 3RD ST., Grades: 9-12)
- NILES COMM. SCHOOLS ADULT EDUCATION (Location: 111 SPRUCE ST, Grades: 9-12)
- W-A-Y NILES (Location: 111 SPRUCE STREET, Grades: 6-12)
- NILES EXTENDED SCHOOL COMMUNITY (Location: 111 SPRUCE STREET, Grades: KG-12)
Public elementary/middle schools in Niles:
- BALLARD ELEMENTARY SCHOOL (Students: 631, Location: 1601 WEST CHICAGO RD, Grades: KG-5)
- RING LARDNER MIDDLE SCHOOL (Students: 563, Location: 801 NORTH 17TH ST, Grades: 7-8)
- HOWARD COMMUNITY SCHOOL (Students: 466, Location: 2788 MANNIX ST, Grades: KG-5)
- BRANDYWINE ELEMENTARY SCHOOL (Students: 406, Location: 2428 SOUTH 13TH ST, Grades: 3-6)
- MERRITT ELEMENTARY SCHOOL (Students: 334, Location: 1620 LASALLE AVE, Grades: PK-2)
- OAK MANOR SIXTH GRADE CENTER (Students: 267, Location: 1 TYLER ST, Grades: 6)
- JAMES ELLIS SCHOOL (Students: 227, Location: 2740 MANNIX ST, Grades: KG-1)
- BRANDYWINE MIDDLE SCHOOL (Students: 196, Location: 1700 BELL RD, Grades: 7-8)
- EASTSIDE CONNECTIONS SCHOOL (Location: 315 N 14TH STREET, Grades: KG-8)
Private elementary/middle schools in Niles:
User-submitted facts and corrections:
- We are now the Niles District library
- The Niles High School Men's Basetkabll team are the Southwestern Michigan Athletic Conference West Division Champions for the first time since 2002!
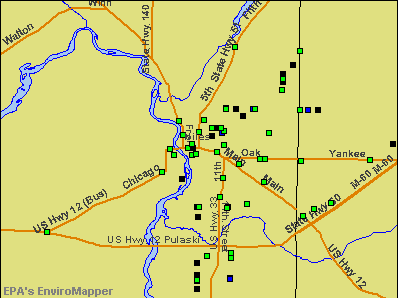
Points of interest:
Notable locations in Niles: Niles Station (A), Plym Park Golf Course (B), Carnegie Library (C), Niles City Fire Department (D), Niles Railroad Depot (E), Fort Saint Joseph Museum (F), Niles City Hall (G), Niles Community Library (H). Display/hide their locations on the map
Churches in Niles include: Trinity Episcopal Church (A), Bethel Baptist Church (B), Church of Jesus Christ (C), Grace United Methodist Church (D), Saint Mary's Catholic Church (E), Mount Calvary Baptist Church (F), Holy Trinity Lutheran Church (G), Church of Christ (H), First Presbyterian Church (I). Display/hide their locations on the map
Cemeteries: Father Allouez Grave Site (1), Calvary Cemetery (2), Springbrook Cemetery (3). Display/hide their locations on the map
Parks in Niles include: Ring Lardner Historical Marker (1), Second Baptist Church Historical Marker (2), Ferry Street Historical Marker (3), Henry Austin Chapin Historical Marker (4), The Chapin House Historical Marker (5), Four Flags Hotel Historical Marker (6), Wesley United Methodist Church Historical Marker (7), Trinity Church Historical Marker (8), Saint Mary's Historical Marker (9). Display/hide their locations on the map
Tourist attractions: Fort St Joseph Museum (508 East Main Street), Fernwood Botanic Garden and Nature Center (Cultural Attractions- Events- & Facilities; 13988 Range Line Road), Amusement Specialist Inc Limited (Amusement & Theme Parks; 766 Hance Street), Howard Township Conservation Club (Amusement & Theme Parks; 2601 Terminal Street), Four Flags Area Council On Tourism (321 East Main Street).
Hotels: Golden Eagle Motel (1243 South 11th Street), Bowman's Motel (2138 S 11th St), Forler's Motel (2483 Yankee Street).
Birthplace of: Fred Bonine - Sprinter and optometrist, Horace Elgin Dodge - Businessman, John Francis Dodge - Businessman, Ring Lardner - Sportswriter, William M. Morrow - General.
Drinking water stations with addresses in Niles and their reported violations in the past:
SUMNERVILLE BIBLE BAPTIST CHUR (Population served: 200, Groundwater):Past health violations:JOEY'S ARMADILLO'S, INC (Population served: 150, Groundwater):
- MCL, Monthly (TCR) - In AUG-2006, Contaminant: Coliform. Follow-up actions: St Violation/Reminder Notice (SEP-07-2006), St Tech Assistance Visit (AUG-11-2008), St Compliance achieved (DEC-09-2008)
- MCL, Monthly (TCR) - In NOV-2005, Contaminant: Coliform. Follow-up actions: St Violation/Reminder Notice (NOV-14-2005), St Compliance achieved (DEC-08-2005)
Past monitoring violations:JAYS LOUNGE (Population served: 150, Groundwater):
- One regular monitoring violation
Past health violations:OLD TAVERN INN (Population served: 75, Groundwater):Past monitoring violations:
- MCL, Monthly (TCR) - In JAN-2008, Contaminant: Coliform. Follow-up actions: St Public Notif received (JAN-04-2008), St Public Notif issued (JAN-04-2008), St Compliance achieved (JAN-31-2008)
- 2 routine major monitoring violations
- One regular monitoring violation
Past monitoring violations:RISE-N-SHINE CAFE - (BLUEBIRD II) (Population served: 25, Groundwater):
- One routine major monitoring violation
- One regular monitoring violation
Past monitoring violations:
- 4 regular monitoring violations
Drinking water stations with addresses in Niles that have no violations reported:
- STATELINE DAIRY QUEEN (Population served: 500, Primary Water Source Type: Groundwater)
- MICHIANA CHRISTIAN EMBASSY (Population served: 200, Primary Water Source Type: Groundwater)
- THE DINER (Population served: 150, Primary Water Source Type: Groundwater)
- HOPPER'S FAMILY RESTAURANT (Population served: 150, Primary Water Source Type: Groundwater)
- MICHIANA CHRISTIAN SERV CAMP (Population served: 100, Primary Water Source Type: Groundwater)
- HOPE COMMUNITY CHURCH (Population served: 100, Primary Water Source Type: Groundwater)
- SPAULDING LK CAMPGROUND WELL 1 (Population served: 95, Primary Water Source Type: Groundwater)
- HIDE-A-WAY (Population served: 90, Primary Water Source Type: Groundwater)
- ROUNDTABLE BAR & GRILL (Population served: 80, Primary Water Source Type: Groundwater)
- KUBIAK'S TAVERN (Population served: 75, Primary Water Source Type: Groundwater)
| This city: | 2.4 people |
| Michigan: | 2.5 people |
| This city: | 59.0% |
| Whole state: | 66.0% |
| This city: | 8.7% |
| Whole state: | 6.4% |
Likely homosexual households (counted as self-reported same-sex unmarried-partner households)
- Lesbian couples: 0.2% of all households
- Gay men: 0.3% of all households
68 people in group homes intended for adults in 2010
People in group quarters in Niles in 2000:
- 173 people in nursing homes
- 26 people in homes for the mentally retarded
- 21 people in other group homes
- 12 people in other noninstitutional group quarters
- 2 people in religious group quarters
Banks with branches in Niles (2011 data):
- The Huntington National Bank: Stadium Branch, Niles Branch, Niles Branch, Niles Branch. Info updated 2012/04/02: Bank assets: $54,183.4 mil, Deposits: $44,300.3 mil, headquarters in Columbus, OH, positive income, Commercial Lending Specialization, 878 total offices, Holding Company: Huntington Bancshares Incorporated
- 1st Source Bank: Niles Branch at 306 East Main Street Suite 100, branch established on 1996/07/18; Niles-Martins Branch at 720 South 11th Street, branch established on 1999/05/05. Info updated 2008/06/16: Bank assets: $4,361.6 mil, Deposits: $3,520.6 mil, headquarters in South Bend, IN, positive income, Commercial Lending Specialization, 79 total offices, Holding Company: 1st Source Corporation
- Fifth Third Bank: Broadway Branch at 322 Broadway, branch established on 1970/08/31; Bertrand Banking Center at 2753 South 11th Street, branch established on 1956/10/01. Info updated 2009/10/05: Bank assets: $114,540.4 mil, Deposits: $89,689.1 mil, headquarters in Cincinnati, OH, positive income, Commercial Lending Specialization, 1378 total offices, Holding Company: Fifth Third Bancorp
- Chemical Bank: Niles Main Office Branch at 407 E. Main Street, branch established on 2007/01/08; Niles South Branch at 1835 South 11th, branch established on 1997/01/13. Info updated 2010/07/30: Bank assets: $5,331.9 mil, Deposits: $4,367.1 mil, headquarters in Midland, MI, positive income, Commercial Lending Specialization, 146 total offices, Holding Company: Chemical Financial Corporation
- Bank of America, National Association: Niles Branch at 1903 South 11th Street, branch established on 1970/09/21. Info updated 2009/11/18: Bank assets: $1,451,969.3 mil, Deposits: $1,077,176.8 mil, headquarters in Charlotte, NC, positive income, 5782 total offices, Holding Company: Bank Of America Corporation
For population 15 years and over in Niles:
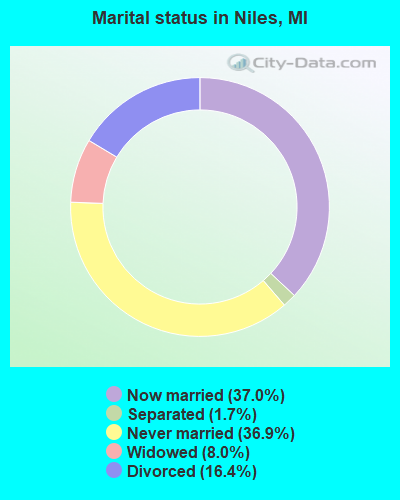
- Never married: 36.9%
- Now married: 37.0%
- Separated: 1.7%
- Widowed: 8.0%
- Divorced: 16.4%
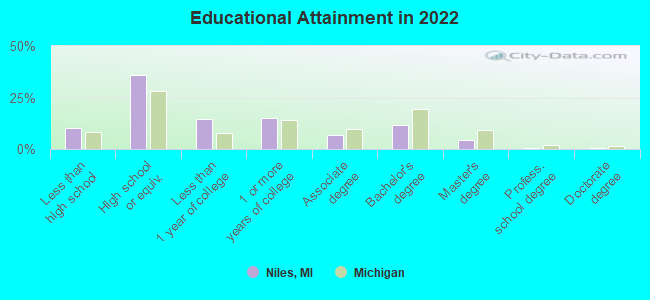
For population 25 years and over in Niles:
- High school or higher: 89.8%
- Bachelor's degree or higher: 17.0%
- Graduate or professional degree: 5.4%
- Unemployed: 8.3%
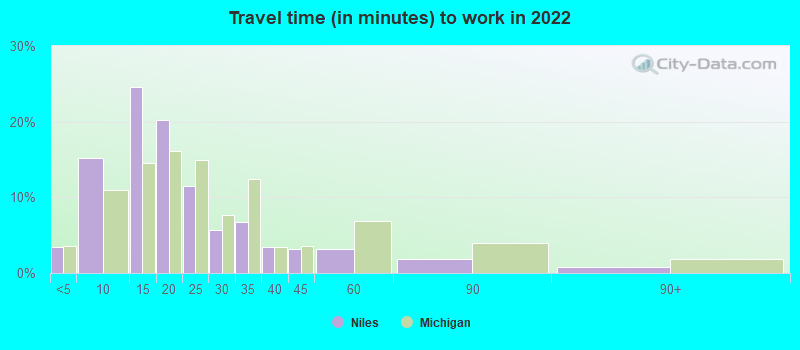
- Mean travel time to work (commute): 23.6 minutes
| Here: | 9.8 |
| Michigan average: | 11.0 |
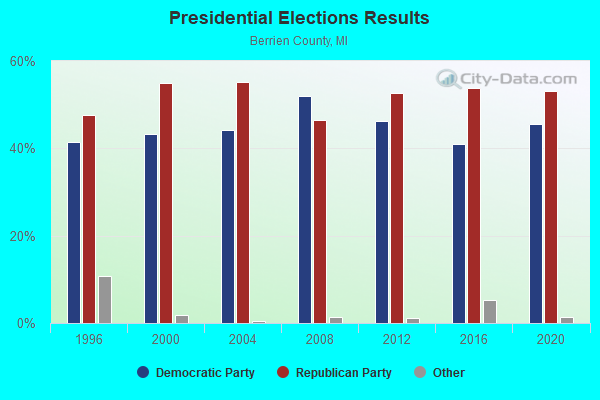
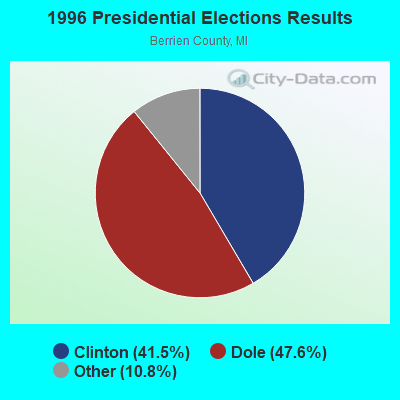
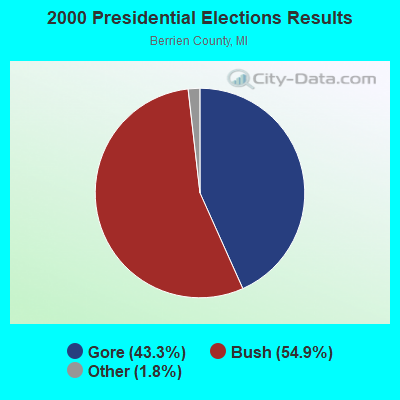
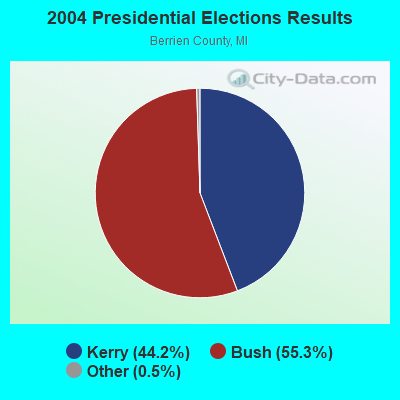
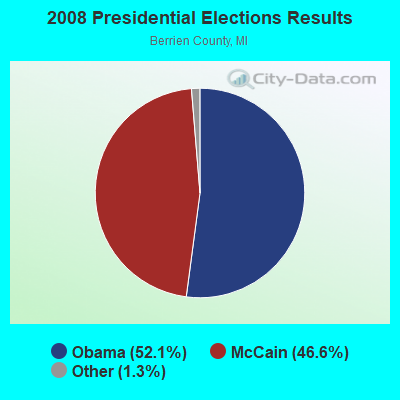
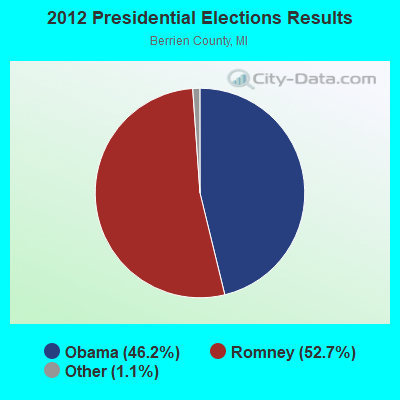
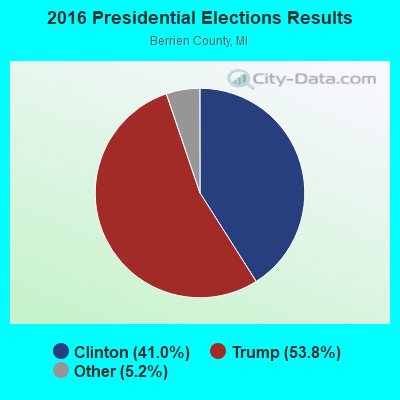
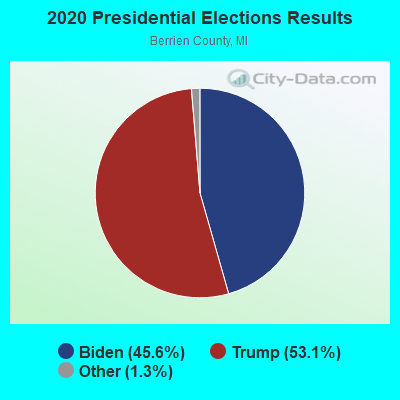
Graphs represent county-level data. Detailed 2008 Election Results
Religion statistics for Niles, MI (based on Berrien County data)
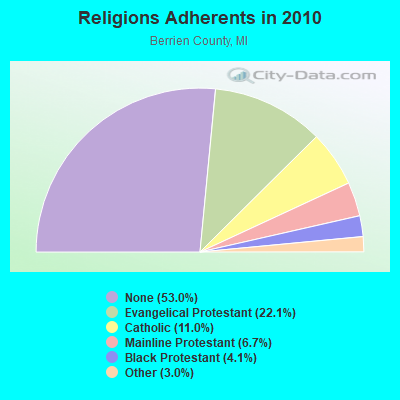
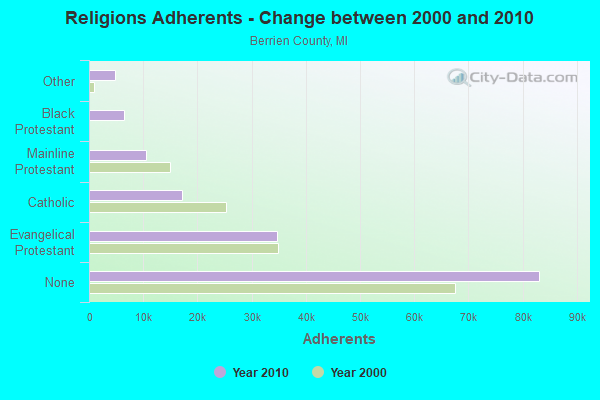
| Religion | Adherents | Congregations |
|---|---|---|
| Evangelical Protestant | 34,679 | 141 |
| Catholic | 17,231 | 11 |
| Mainline Protestant | 10,538 | 52 |
| Black Protestant | 6,437 | 21 |
| Other | 4,727 | 20 |
| Orthodox | 100 | 1 |
| None | 83,101 | - |
Food Environment Statistics:
| Berrien County: | 2.57 / 10,000 pop. |
| Michigan: | 2.34 / 10,000 pop. |
| Here: | 0.06 / 10,000 pop. |
| State: | 0.18 / 10,000 pop. |
| This county: | 1.38 / 10,000 pop. |
| State: | 1.52 / 10,000 pop. |
| This county: | 3.01 / 10,000 pop. |
| Michigan: | 2.99 / 10,000 pop. |
| Berrien County: | 9.73 / 10,000 pop. |
| Michigan: | 6.80 / 10,000 pop. |
| Berrien County: | 10.6% |
| Michigan: | 9.7% |
| Berrien County: | 29.1% |
| Michigan: | 29.7% |
| Here: | 11.9% |
| Michigan: | 13.4% |
Health and Nutrition:
| Here: | 49.8% |
| State: | 50.3% |
| This city: | 47.1% |
| State: | 47.9% |
| Niles: | 28.8 |
| State: | 28.7 |
| Niles: | 21.6% |
| Michigan: | 20.6% |
| This city: | 11.3% |
| Michigan: | 10.4% |
| Here: | 6.9 |
| Michigan: | 6.8 |
| Niles: | 34.4% |
| State: | 34.1% |
| Here: | 56.3% |
| Michigan: | 57.0% |
| This city: | 78.7% |
| State: | 79.6% |
More about Health and Nutrition of Niles, MI Residents
| Local government employment and payroll (March 2022) | |||||
| Function | Full-time employees | Monthly full-time payroll | Average yearly full-time wage | Part-time employees | Monthly part-time payroll |
|---|---|---|---|---|---|
| Police Protection - Officers | 18 | $121,241 | $80,827 | 2 | $3,186 |
| Streets and Highways | 15 | $72,926 | $58,341 | 0 | $0 |
| Financial Administration | 14 | $58,650 | $50,271 | 2 | $5,522 |
| Firefighters | 14 | $83,067 | $71,200 | 0 | $0 |
| Electric Power | 13 | $77,549 | $71,584 | 0 | $0 |
| Other Government Administration | 13 | $97,210 | $89,732 | 0 | $0 |
| Sewerage | 13 | $68,759 | $63,470 | 0 | $0 |
| Water Supply | 9 | $38,873 | $51,831 | 0 | $0 |
| Police - Other | 9 | $33,111 | $44,148 | 9 | $9,726 |
| Housing and Community Development (Local) | 8 | $39,622 | $59,433 | 1 | $1,325 |
| Other and Unallocable | 2 | $8,905 | $53,430 | 3 | $5,247 |
| Totals for Government | 128 | $699,913 | $65,617 | 17 | $25,006 |
Niles government finances - Expenditure in 2021 (per resident):
- Current Operations - General - Other: $17,769,000 ($1510.84)
Sewerage: $4,327,000 ($367.91)
Police Protection: $2,927,000 ($248.87)
Regular Highways: $2,644,000 ($224.81)
Local Fire Protection: $1,251,000 ($106.37)
Housing and Community Development: $865,000 ($73.55)
Central Staff Services: $730,000 ($62.07)
Transit Utilities: $537,000 ($45.66)
Financial Administration: $457,000 ($38.86)
Parks and Recreation: $367,000 ($31.20)
General Public Buildings: $345,000 ($29.33)
Libraries: $243,000 ($20.66)
Air Transportation: $95,000 ($8.08)
Judicial and Legal Services: $77,000 ($6.55)
Solid Waste Management: $46,000 ($3.91)
- Electric Utilities - Interest on Debt: $103,000 ($8.76)
- General - Interest on Debt: $63,000 ($5.36)
- Intergovernmental to Local - Other - Housing and Community Development: $30,000 ($2.55)
- Other Capital Outlay - Transit Utilities: $14,000 ($1.19)
- Total Salaries and Wages: $6,497,000 ($552.42)
- Water Utilities - Interest on Debt: $36,000 ($3.06)
Niles government finances - Revenue in 2021 (per resident):
- Charges - Sewerage: $3,180,000 ($270.39)
Other: $1,342,000 ($114.11)
Housing and Community Development: $530,000 ($45.06)
Parks and Recreation: $23,000 ($1.96)
- Federal Intergovernmental - Other: $1,618,000 ($137.57)
Housing and Community Development: $1,205,000 ($102.46)
- Local Intergovernmental - Housing and Community Development: $293,000 ($24.91)
- Miscellaneous - Interest Earnings: $583,000 ($49.57)
Donations From Private Sources: $420,000 ($35.71)
General Revenue - Other: $384,000 ($32.65)
Fines and Forfeits: $180,000 ($15.30)
Rents: $166,000 ($14.11)
Sale of Property: $47,000 ($4.00)
Special Assessments: $5,000 ($0.43)
- Revenue - Electric Utilities: $15,266,000 ($1298.02)
Water Utilities: $2,669,000 ($226.94)
- State Intergovernmental - Highways: $1,589,000 ($135.11)
Other: $1,392,000 ($118.36)
General Local Government Support: $1,355,000 ($115.21)
- Tax - Property: $3,139,000 ($266.90)
Occupation and Business License - Other: $529,000 ($44.98)
Niles government finances - Debt in 2021 (per resident):
- Long Term Debt - Beginning Outstanding - Unspecified Public Purpose: $8,317,000 ($707.17)
Outstanding Unspecified Public Purpose: $7,542,000 ($641.27)
Retired Unspecified Public Purpose: $775,000 ($65.90)
- Short Term Debt Outstanding - End of Fiscal Year: $28,000 ($2.38)
Niles government finances - Cash and Securities in 2021 (per resident):
- Other Funds - Cash and Securities: $28,386,000 ($2413.57)
| Businesses in Niles, MI | ||||
| Name | Count | Name | Count | |
|---|---|---|---|---|
| AT&T | 1 | McDonald's | 1 | |
| Advance Auto Parts | 1 | Papa John's Pizza | 1 | |
| Arby's | 1 | Payless | 1 | |
| AutoZone | 1 | Pizza Hut | 1 | |
| Burger King | 2 | Quiznos | 1 | |
| Chevrolet | 1 | RadioShack | 1 | |
| Comfort Inn | 1 | Rite Aid | 1 | |
| DHL | 1 | Sprint Nextel | 1 | |
| Dairy Queen | 3 | Starbucks | 1 | |
| FedEx | 1 | Subway | 2 | |
| GNC | 1 | T-Mobile | 2 | |
| H&R Block | 2 | Taco Bell | 1 | |
| Hardee's | 1 | U-Haul | 1 | |
| Holiday Inn | 1 | UPS | 6 | |
| KFC | 1 | Walgreens | 1 | |
| Little Caesars Pizza | 1 | Walmart | 1 | |
| Long John Silver's | 1 | Wendy's | 1 | |
| Lowe's | 1 | YMCA | 1 | |
| MasterBrand Cabinets | 2 | |||
Strongest AM radio stations in Niles:
- WNIL (1290 AM; 0 kW; NILES, MI; Owner: PATHFINDER COMMUNICATIONS CORPORATION)
- WHLY (1580 AM; 10 kW; SOUTH BEND, IN; Owner: TIMES COMMUNICATIONS INC.)
- WDND (1620 AM; 10 kW; SOUTH BEND, IN; Owner: ARTISTIC MEDIA PARTNERS, INC.)
- WSBT (960 AM; 5 kW; SOUTH BEND, IN; Owner: WSBT, INC.)
- WHFB (1060 AM; 5 kW; BENTON HARBOR-ST. JO, MI; Owner: WHFB B/CST ASSOCIATES LTD PARTNERSHP)
- WFRN (1270 AM; 5 kW; ELKHART, IN)
- WSCR (670 AM; 50 kW; CHICAGO, IL; Owner: INFINITY BROADCASTING OPERATIONS, INC.)
- WGN (720 AM; 50 kW; CHICAGO, IL; Owner: WGN CONTINENTAL BROADCASTING CO.)
- WLS (890 AM; 50 kW; CHICAGO, IL; Owner: WLS, INC.)
- WOWO (1190 AM; 50 kW; FORT WAYNE, IN; Owner: PATHFINDER COMMUNICATIONS CORPORATION)
- WNDV (1490 AM; 1 kW; SOUTH BEND, IN; Owner: ARTISTIC MEDIA PARTNERS, INC.)
- WBBM (780 AM; 50 kW; CHICAGO, IL; Owner: INFINITY BROADCASTING OPERATIONS, INC.)
- WMVP (1000 AM; 50 kW; CHICAGO, IL; Owner: ABC, INC.)
Strongest FM radio stations in Niles:
- WSMK (99.1 FM; BUCHANAN, MI; Owner: MARION R. WILLIAMS)
- WNSN (101.5 FM; SOUTH BEND, IN; Owner: WSBT, INC.)
- WAOR (95.3 FM; NILES, MI; Owner: PATHFINDER COMMUNICATIONS CORPORATION)
- WBYT (100.7 FM; ELKHART, IN; Owner: PATHFINDER COMMUNICATIONS CORPORATION)
- WUBU (106.3 FM; SOUTH BEND, IN; Owner: PARTNERSHIP RADIO, LLC)
- WNDV-FM (92.9 FM; SOUTH BEND, IN; Owner: ARTISTIC MEDIA PARTNERS, INC.)
- WAUS (90.7 FM; BERRIEN SPRINGS, MI; Owner: ANDREWS BROADCASTING CORP.)
- W300AL (107.9 FM; MISHAWAKA, IN; Owner: CSN INTERNATIONAL)
- WWLV (102.3 FM; NEW CARLISLE, IN; Owner: ARTISTIC MEDIA PARTNERS, INC.)
- WVPE (88.1 FM; ELKHART, IN; Owner: ELKHART COMMUNITY SCHOOLS CORP.)
- WRBR-FM (103.9 FM; SOUTH BEND, IN; Owner: HICKS BROADCASTING OF INDIANA, LLC)
- WIRX (107.1 FM; ST. JOSEPH, MI; Owner: WSJM, INC.)
- WUBS (89.7 FM; SOUTH BEND, IN; Owner: INTERFAITH CHRISTIAN UNION, INC.)
- WHFB-FM (99.9 FM; BENTON HARBOR, MI; Owner: WHFB BROADCAST ASSOCIATES L P)
- WSND-FM (88.9 FM; NOTRE DAME, IN; Owner: VOICE OF THE FIGHTING IRISH, INC.)
- WYTZ (97.5 FM; BRIDGMAN, MI; Owner: WSJM INC)
- WETL (91.7 FM; SOUTH BEND, IN; Owner: SOUTH BEND COMMUNITY SCHOOL CORP.)
- WFRN-FM (104.7 FM; ELKHART, IN; Owner: PROGRESSIVE BROADCASTING SYSTEM, INC.)
- WCNF (94.9 FM; BENTON HARBOR, MI; Owner: WSJM, INC.)
- W243AJ (96.5 FM; MISHAWAKA, IN; Owner: PROGRESSIVE BROADCASTING SYSTEM, INC.)
TV broadcast stations around Niles:
- WRDY-LP (Channel 69; SOUTH BEND, IN; Owner: WEIGEL BROADCASTING COMPANY)
- WBND-LP (Channel 57; SOUTH BEND, IN; Owner: WBND-TV LIMITED PARTNERSHIP)
- WSJV (Channel 28; ELKHART, IN; Owner: WSJV TELEVISION, INC.)
- WSBT-TV (Channel 22; SOUTH BEND, IN; Owner: WSBT, INC.)
- WNIT (Channel 34; SOUTH BEND, IN; Owner: MICHIANA PUBLIC BROADCASTING CORPORATION)
- WNDU-TV (Channel 16; SOUTH BEND, IN; Owner: MICHIANA TELECASTING CORP.)
- WMWB-LP (Channel 25; SOUTH BEND, IN; Owner: WMWB-TV LIMITED PARTNERSHIP)
- WHME-TV (Channel 46; SOUTH BEND, IN; Owner: LESEA BROADCASTING CORPORATION)
- WYGN-LP (Channel 12; BERRIEN SPRINGS, MI; Owner: GOOD NEWS TELEVISION)
- National Bridge Inventory (NBI) Statistics
- 28Number of bridges
- 256ft / 78.3mTotal length
- $790,000Total costs
- 199,015Total average daily traffic
- 10,172Total average daily truck traffic
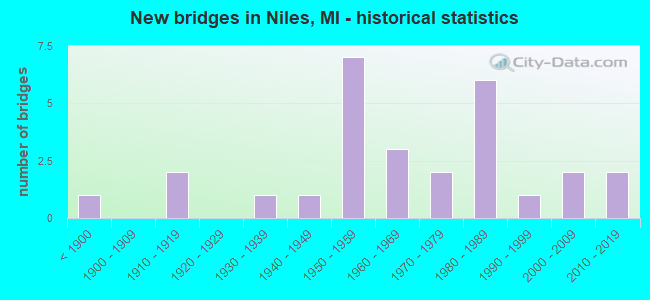
- New bridges - historical statistics
- 1Before 1900
- 21910-1919
- 11930-1939
- 11940-1949
- 71950-1959
- 31960-1969
- 21970-1979
- 61980-1989
- 11990-1999
- 22000-2009
- 22010-2019
FCC Registered Antenna Towers: 185 (See the full list of FCC Registered Antenna Towers)
FCC Registered Commercial Land Mobile Towers: 2 (See the full list of FCC Registered Commercial Land Mobile Towers in Niles, MI)
FCC Registered Private Land Mobile Towers: 1 (See the full list of FCC Registered Private Land Mobile Towers)
FCC Registered Broadcast Land Mobile Towers: 27 (See the full list of FCC Registered Broadcast Land Mobile Towers)
FCC Registered Microwave Towers: 30 (See the full list of FCC Registered Microwave Towers in this town)
FCC Registered Paging Towers: 4 (See the full list of FCC Registered Paging Towers)
FCC Registered Maritime Coast & Aviation Ground Towers: 2 (See the full list of FCC Registered Maritime Coast & Aviation Ground Towers)
FCC Registered Amateur Radio Licenses: 205 (See the full list of FCC Registered Amateur Radio Licenses in Niles)
FAA Registered Aircraft: 32 (See the full list of FAA Registered Aircraft in Niles)
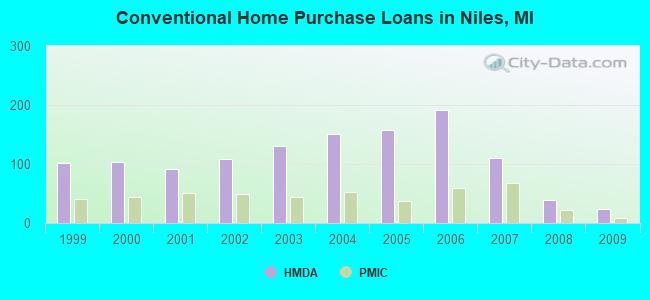
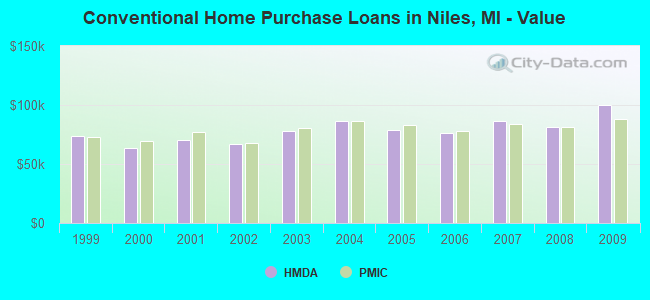
| Home Mortgage Disclosure Act Aggregated Statistics For Year 2009 (Based on 1 full and 3 partial tracts) | ||||||||||||
| A) FHA, FSA/RHS & VA Home Purchase Loans | B) Conventional Home Purchase Loans | C) Refinancings | D) Home Improvement Loans | F) Non-occupant Loans on < 5 Family Dwellings (A B C & D) | G) Loans On Manufactured Home Dwelling (A B C & D) | |||||||
|---|---|---|---|---|---|---|---|---|---|---|---|---|
| Number | Average Value | Number | Average Value | Number | Average Value | Number | Average Value | Number | Average Value | Number | Average Value | |
| LOANS ORIGINATED | 52 | $71,004 | 24 | $100,290 | 119 | $109,752 | 17 | $33,995 | 8 | $49,806 | 1 | $47,770 |
| APPLICATIONS APPROVED, NOT ACCEPTED | 0 | $0 | 2 | $40,420 | 19 | $96,364 | 2 | $7,295 | 1 | $32,860 | 0 | $0 |
| APPLICATIONS DENIED | 10 | $71,985 | 9 | $78,143 | 56 | $88,249 | 15 | $15,739 | 3 | $38,663 | 1 | $55,920 |
| APPLICATIONS WITHDRAWN | 7 | $122,454 | 11 | $83,357 | 39 | $128,674 | 8 | $40,452 | 1 | $70,020 | 0 | $0 |
| FILES CLOSED FOR INCOMPLETENESS | 2 | $93,490 | 0 | $0 | 14 | $122,621 | 0 | $0 | 1 | $24,650 | 0 | $0 |
Detailed HMDA statistics for the following Tracts: 0205.00 , 0206.00, 0207.00, 0209.00
| Private Mortgage Insurance Companies Aggregated Statistics For Year 2009 (Based on 1 full and 3 partial tracts) | ||||
| A) Conventional Home Purchase Loans | B) Refinancings | |||
|---|---|---|---|---|
| Number | Average Value | Number | Average Value | |
| LOANS ORIGINATED | 9 | $87,764 | 4 | $96,202 |
| APPLICATIONS APPROVED, NOT ACCEPTED | 0 | $0 | 2 | $107,505 |
| APPLICATIONS DENIED | 4 | $136,070 | 0 | $0 |
| APPLICATIONS WITHDRAWN | 1 | $47,970 | 1 | $82,950 |
| FILES CLOSED FOR INCOMPLETENESS | 0 | $0 | 1 | $65,960 |
Detailed PMIC statistics for the following Tracts: 0205.00 , 0206.00, 0207.00, 0209.00
2002 - 2018 National Fire Incident Reporting System (NFIRS) incidents
- Fire incident types reported to NFIRS in Niles, MI
- 1,42952.0%Structure Fires
- 79528.9%Outside Fires
- 43916.0%Mobile Property/Vehicle Fires
- 843.1%Other
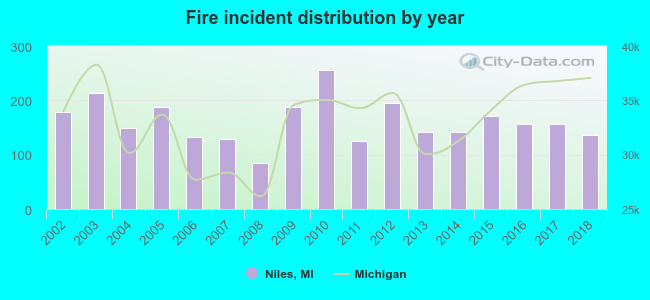 Based on the data from the years 2002 - 2018 the average number of fire incidents per year is 162. The highest number of fire incidents - 255 took place in 2010, and the least - 84 in 2008. The data has a dropping trend.
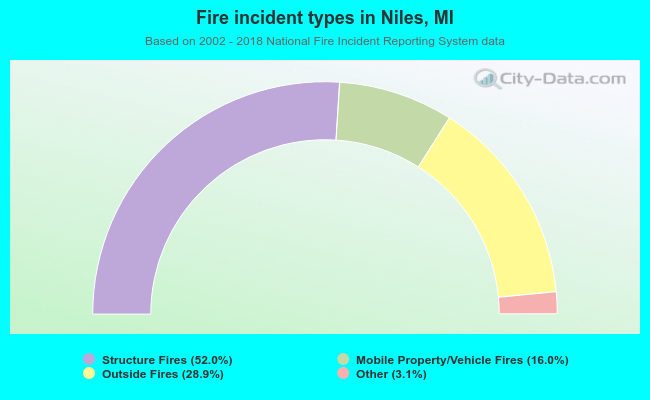 When looking into fire subcategories, the most reports belonged to: Structure Fires (52.0%), and Outside Fires (28.9%).
Fire-safe hotels and motels in Niles, Michigan:
- Holiday Inn Express & Suites, 1000 Moore Dr, Niles, Michigan 49120 , Phone: (269) 684-0300, Fax: (269) 684-0500
- Comfort Inn & Suites, 1265 S 11TH St, Niles, Michigan 49120 , Phone: (269) 684-3900, Fax: (269) 684-2900
| Most common first names in Niles, MI among deceased individuals | ||
| Name | Count | Lived (average) |
|---|---|---|
| John | 562 | 74.9 years |
| William | 478 | 74.3 years |
| Robert | 476 | 71.4 years |
| Mary | 464 | 77.2 years |
| James | 328 | 71.6 years |
| Charles | 318 | 75.1 years |
| George | 280 | 75.9 years |
| Richard | 254 | 71.8 years |
| Helen | 246 | 79.1 years |
| Dorothy | 232 | 77.5 years |
| Most common last names in Niles, MI among deceased individuals | ||
| Last name | Count | Lived (average) |
|---|---|---|
| Smith | 228 | 75.5 years |
| Johnson | 156 | 75.7 years |
| Williams | 146 | 75.3 years |
| Miller | 144 | 73.2 years |
| Jones | 132 | 77.7 years |
| Davis | 124 | 76.2 years |
| Brown | 104 | 76.1 years |
| Thompson | 86 | 75.3 years |
| Young | 78 | 75.7 years |
| Mitchell | 76 | 76.9 years |
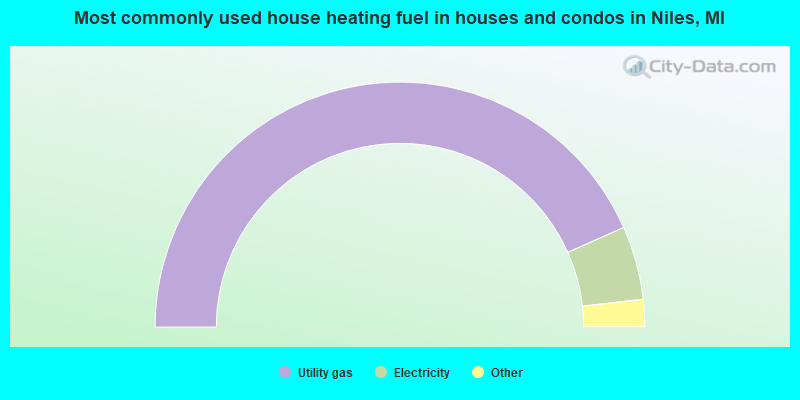
- 86.7%Utility gas
- 9.7%Electricity
- 1.4%Bottled, tank, or LP gas
- 1.3%Wood
- 0.9%Fuel oil, kerosene, etc.
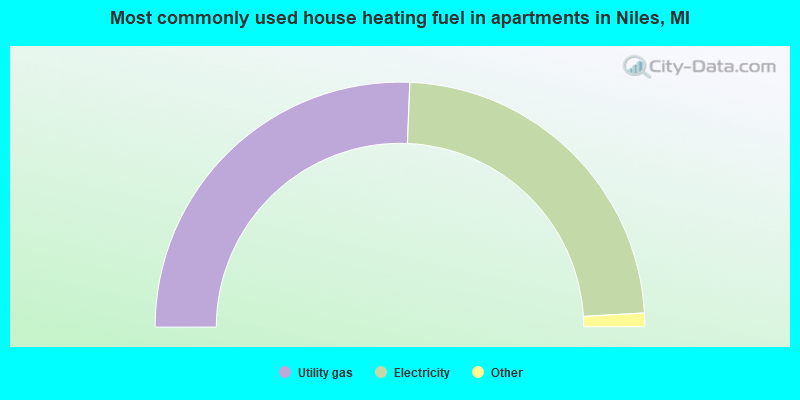
- 51.3%Utility gas
- 46.9%Electricity
- 0.9%No fuel used
- 0.5%Other fuel
- 0.4%Bottled, tank, or LP gas
Niles compared to Michigan state average:
- Median household income below state average.
- Median house value below state average.
- Unemployed percentage below state average.
- Median age below state average.
- Foreign-born population percentage significantly below state average.
- Renting percentage above state average.
- House age above state average.
- Number of college students below state average.
Niles on our top lists:
- #70 on the list of "Top 101 cities with the largest positive percentage difference between never married females and males (15+ years) (with at least 1,000 females never married)"
- #78 on the list of "Top 101 cities with the most local government spending on current operations of libraries per resident (population 10,000+)"

|
|
Total of 97 patent applications in 2008-2024.