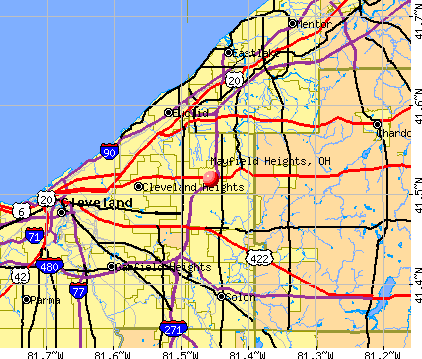
Mayfield Heights, Ohio
Submit your own pictures of this city and show them to the world
- OSM Map
- General Map
- Google Map
- MSN Map
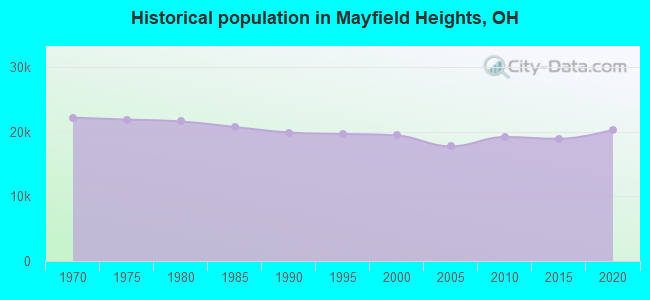
Population change since 2000: +2.7%
 |
| Males: 9,155 | |
| Females: 10,752 |
| Median resident age: | 38.8 years |
| Ohio median age: | 39.9 years |
Zip codes: 44124.
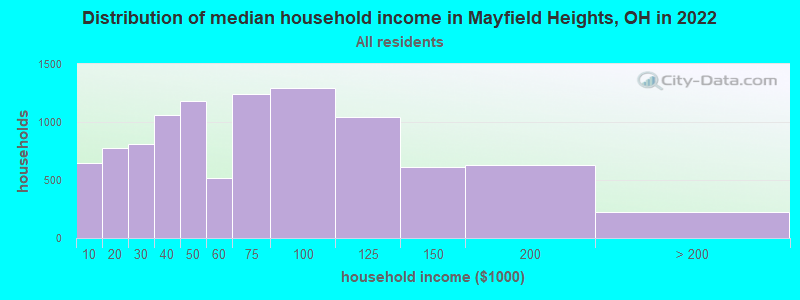
| Mayfield Heights: | $60,078 |
| OH: | $65,720 |
Estimated per capita income in 2022: $39,682 (it was $24,392 in 2000)
Mayfield Heights city income, earnings, and wages data
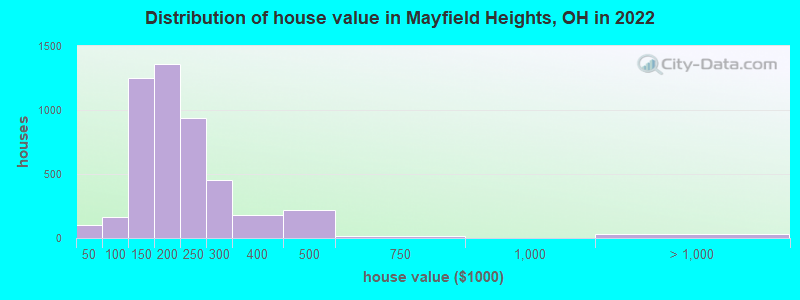
Estimated median house or condo value in 2022: $199,438 (it was $126,100 in 2000)
| Mayfield Heights: | $199,438 |
| OH: | $204,100 |
Mean prices in 2022: all housing units: $235,815; detached houses: $243,339; townhouses or other attached units: $214,792; in 2-unit structures: $118,975; in 3-to-4-unit structures: $232,984; in 5-or-more-unit structures: $177,601; mobile homes: $87,444
Median gross rent in 2022: $1,093.
Mayfield Heights, OH residents, houses, and apartments details
(6.8% for White Non-Hispanic residents, 17.6% for Black residents, 10.5% for Hispanic or Latino residents, 57.3% for other race residents)
Detailed information about poverty and poor residents in Mayfield Heights, OH

Compare current foreclosures near Mayfield Heights, OH:
| Photo | Address | Area | Beds / Baths | Price | Details |
|---|---|---|---|---|---|

|
#1
E 90th St
Cleveland, OH 44106
|
1,776 sq. feet
|
1 baths 4 beds |
$214,500
|
show details |

|
#2
Wellner Rd
Eastlake, OH 44095
|
1,030 sq. feet
|
2 baths 3 beds |
$194,900
|
show details |

|
#3
Arcade Ave
Cleveland, OH 44110
|
2,036 sq. feet
|
2 baths 4 beds |
$8,500
|
show details |

|
#4
E 134th St
Cleveland, OH 44105
|
1,549 sq. feet
|
1 baths 3 beds |
$129,900
|
show details |

|
#5
Miller Ave
Cleveland, OH 44119
|
830 sq. feet
|
1 baths 2 beds |
$149,900
|
show details |

|
#6
E 128th St
Cleveland, OH 44120
|
2,590 sq. feet
|
3 baths 5 beds |
$22,500
|
show details |

|
#7
Clearview Rd
Chesterland, OH 44026
|
4,317 sq. feet
|
2 baths 4 beds |
$291,200
|
show details |

|
#8
Wilmington Rd
Cleveland, OH 44121
|
1,278 sq. feet
|
1 baths 3 beds |
$114,900
|
show details |

|
#9
Alton Rd
Wickliffe, OH 44092
|
936 sq. feet
|
1 baths 3 beds |
$159,900
|
show details |

|
#10
Snow Rd
Burton, OH 44021
|
2,200 sq. feet
|
1 baths 4 beds |
$349,900
|
show details |
| Photo | Address | Area | Beds / Baths | Price | Details |
|---|---|---|---|---|---|

|
#11
Maryland Ave
Cleveland, OH 44105
|
1,908 sq. feet
|
2 baths 4 beds |
$29,900
|
show details |

|
#12
Pawnee Ave
Cleveland, OH 44119
|
1,884 sq. feet
|
2 baths 4 beds |
show details | |

|
#13
Daleford Rd
Cleveland, OH 44120
|
3,164 sq. feet
|
3 baths 6 beds |
show details | |

|
#14
Farnham Dr
Mentor, OH 44060
|
1,326 sq. feet
|
2 baths 3 beds |
show details | |

|
#15
Oakridge Dr
Mentor, OH 44060
|
2,594 sq. feet
|
3 baths 4 beds |
show details | |

|
#16
Maple Hill Dr
Chagrin Falls, OH 44022
|
2,423 sq. feet
|
4 baths 4 beds |
show details | |

|
#17
E 74th St
Cleveland, OH 44103
|
3,025 sq. feet
|
2 baths 4 beds |
show details | |

|
#18
Welland Dr
Mentor, OH 44060
|
1,470 sq. feet
|
1 baths 3 beds |
show details | |

|
#19
Kirkwood Dr # 12
Mentor, OH 44060
|
1,824 sq. feet
|
2 baths 3 beds |
show details | |

|
#20
Adams St
Bedford, OH 44146
|
1,536 sq. feet
|
1 baths 2 beds |
show details |
| Photo | Address | Area | Beds / Baths | Price | Details |
|---|---|---|---|---|---|

|
#21
Prame Ave
Cleveland, OH 44109
|
1,012 sq. feet
|
1 baths 2 beds |
show details | |

|
#22
Corning Ave
Cleveland, OH 44109
|
1,864 sq. feet
|
1 baths 4 beds |
show details | |

|
#23
Green Rd
Cleveland, OH 44128
|
1,118 sq. feet
|
1 baths 3 beds |
show details | |

|
#24
Bell Rd
Newbury, OH 44065
|
2,635 sq. feet
|
3 baths 4 beds |
show details | |

|
#25
Windy Hill Ln
Solon, OH 44139
|
4,243 sq. feet
|
4 baths 4 beds |
show details | |

|
#26
Wayside Rd
Cleveland, OH 44110
|
912 sq. feet
|
1 baths 3 beds |
show details | |

|
#27
Pirates Cv
Aurora, OH 44202
|
2,016 sq. feet
|
3 baths 4 beds |
show details | |

|
#28
Jennings Rd
Cleveland, OH 44109
|
1,054 sq. feet
|
2 baths 2 beds |
show details | |

|
#29
Stone Creek Ln
Twinsburg, OH 44087
|
1,502 sq. feet
|
2 baths 3 beds |
show details | |

|
#30
Beechwood Dr
Mentor, OH 44060
|
1,628 sq. feet
|
2 baths 3 beds |
show details |
| Photo | Address | Area | Beds / Baths | Price | Details |
|---|---|---|---|---|---|

|
#31
Haggett Dr
Twinsburg, OH 44087
|
1,659 sq. feet
|
3 baths 3 beds |
show details | |

|
#32
E 276th St
Euclid, OH 44132
|
1,746 sq. feet
|
1 baths 3 beds |
show details | |

|
#33
Overlook Ridge Dr # C
Cleveland, OH 44109
|
1,066 sq. feet
|
2 baths 2 beds |
show details | |

|
#34
Kohout St
Maple Heights, OH 44137
|
720 sq. feet
|
1 baths 2 beds |
show details | |

|
#35
Beech Ave
Maple Heights, OH 44137
|
968 sq. feet
|
2 baths 3 beds |
show details | |

|
#36
E 120th St
Cleveland, OH 44105
|
1,214 sq. feet
|
2 baths 3 beds |
show details | |

|
#37
Outrigger Cv
Aurora, OH 44202
|
1,757 sq. feet
|
3 baths 3 beds |
show details | |

|
#38
Mohican Ave
Cleveland, OH 44119
|
1,377 sq. feet
|
1 baths 3 beds |
show details | |

|
#39
Nelson Ave
Cleveland, OH 44105
|
880 sq. feet
|
1 baths 3 beds |
show details | |

|
#40
Pinehurst Dr
Chardon, OH 44024
|
3,675 sq. feet
|
3 baths 4 beds |
show details |
| Photo | Address | Area | Beds / Baths | Price | Details |
|---|---|---|---|---|---|

|
#41
Pheasant Run Dr # C
Chagrin Falls, OH 44022
|
2,328 sq. feet
|
3 baths 2 beds |
show details | |

|
#42
Shadow Ledge Dr
Twinsburg, OH 44087
|
3,090 sq. feet
|
3 baths 4 beds |
show details | |

|
#43
Pleasantview Trl
Mentor, OH 44060
|
1,862 sq. feet
|
3 baths 4 beds |
show details | |

|
#44
E 248th St
Euclid, OH 44123
|
960 sq. feet
|
2 baths 2 beds |
show details | |

|
#45
Lexington Ave
Cleveland, OH 44103
|
2,768 sq. feet
|
3 baths 4 beds |
show details | |

|
#46
E 216th St
Cleveland, OH 44119
|
1,174 sq. feet
|
2 baths 3 beds |
show details | |

|
#47
Linwood Ave
Cleveland, OH 44103
|
1,780 sq. feet
|
3 baths 3 beds |
show details | |

|
#48
Avery Ave
Bedford, OH 44146
|
1,622 sq. feet
|
1 baths 4 beds |
show details | |

|
#49
Mavec Ave
Euclid, OH 44123
|
2,064 sq. feet
|
2 baths 4 beds |
show details | |

|
Check over 1 million property listings on Foreclosure.com!
|
browse all offers | |||


- 12,75664.4%White alone
- 3,31716.8%Black alone
- 1,2956.5%Two or more races
- 1,2346.2%Asian alone
- 1,1525.8%Hispanic
- 660.3%Other race alone
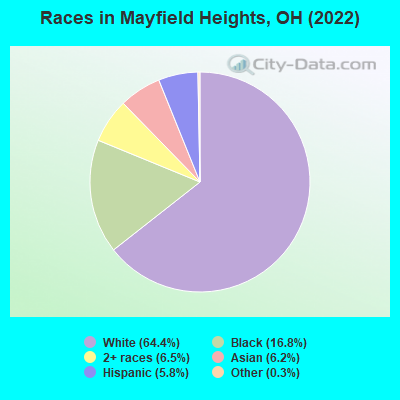
Races in Mayfield Heights detailed stats: ancestries, foreign born residents, place of birth
According to our research of Ohio and other state lists, there were 4 registered sex offenders living in Mayfield Heights, Ohio as of June 10, 2024.
The ratio of all residents to sex offenders in Mayfield Heights is 4,684 to 1.
The ratio of registered sex offenders to all residents in this city is much lower than the state average.
Type |
2009 |
2010 |
2011 |
2012 |
2013 |
2014 |
2015 |
2016 |
2017 |
2018 |
2019 |
2020 |
2021 |
2022 |
|---|---|---|---|---|---|---|---|---|---|---|---|---|---|---|
| Murders (per 100,000) | 0 (0.0) | 0 (0.0) | 0 (0.0) | 0 (0.0) | 0 (0.0) | 0 (0.0) | 0 (0.0) | 0 (0.0) | 1 (5.3) | 0 (0.0) | 0 (0.0) | 0 (0.0) | 1 (5.4) | 0 (0.0) |
| Rapes (per 100,000) | 2 (11.4) | 0 (0.0) | 0 (0.0) | 0 (0.0) | 0 (0.0) | 0 (0.0) | 0 (0.0) | 0 (0.0) | 1 (5.3) | 0 (0.0) | 1 (5.4) | 1 (5.4) | 2 (10.9) | 4 (20.2) |
| Robberies (per 100,000) | 8 (45.5) | 8 (41.8) | 10 (52.2) | 4 (21.0) | 4 (21.1) | 1 (5.3) | 6 (31.9) | 9 (47.9) | 5 (26.7) | 1 (5.4) | 3 (16.2) | 7 (38.0) | 3 (16.3) | 4 (20.2) |
| Assaults (per 100,000) | 5 (28.5) | 11 (57.4) | 3 (15.7) | 8 (42.1) | 4 (21.1) | 0 (0.0) | 8 (42.6) | 5 (26.6) | 6 (32.0) | 4 (21.5) | 8 (43.2) | 9 (48.9) | 16 (86.9) | 7 (35.3) |
| Burglaries (per 100,000) | 34 (193.5) | 35 (182.7) | 34 (177.4) | 36 (189.4) | 34 (179.7) | 6 (31.8) | 9 (47.9) | 11 (58.6) | 12 (64.1) | 3 (16.1) | 8 (43.2) | 4 (21.7) | 11 (59.7) | 8 (40.4) |
| Thefts (per 100,000) | 229 (1,304) | 250 (1,305) | 320 (1,669) | 300 (1,579) | 236 (1,247) | 111 (587.6) | 118 (628.3) | 176 (937.7) | 170 (907.9) | 109 (584.5) | 220 (1,188) | 157 (853.1) | 120 (651.4) | 197 (994.3) |
| Auto thefts (per 100,000) | 16 (91.1) | 15 (78.3) | 15 (78.3) | 17 (89.5) | 14 (74.0) | 9 (47.6) | 0 (0.0) | 2 (10.7) | 6 (32.0) | 1 (5.4) | 2 (10.8) | 7 (38.0) | 3 (16.3) | 18 (90.8) |
| Arson (per 100,000) | 2 (11.4) | 1 (5.2) | 3 (15.7) | 2 (10.5) | 0 (0.0) | 0 (0.0) | 0 (0.0) | 0 (0.0) | 0 (0.0) | 1 (5.4) | 0 (0.0) | 2 (10.9) | 1 (5.4) | 0 (0.0) |
| City-Data.com crime index | 101.4 | 95.3 | 104.2 | 98.3 | 79.0 | 31.1 | 46.6 | 62.2 | 72.7 | 30.8 | 69.2 | 64.2 | 73.3 | 79.1 |
The City-Data.com crime index weighs serious crimes and violent crimes more heavily. Higher means more crime, U.S. average is 246.1. It adjusts for the number of visitors and daily workers commuting into cities.
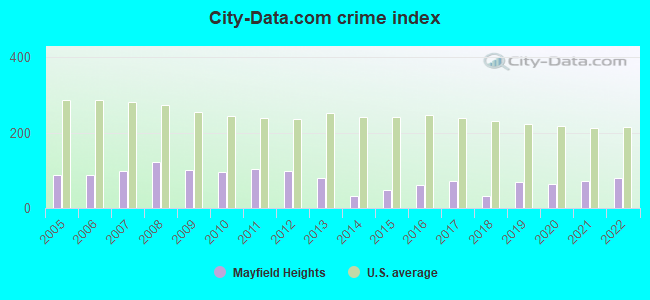
Crime rate in Mayfield Heights detailed stats: murders, rapes, robberies, assaults, burglaries, thefts, arson
Full-time law enforcement employees in 2019, including police officers: 50 (39 officers - 39 male; 0 female).
| Officers per 1,000 residents here: | 2.11 |
| Ohio average: | 2.43 |
 Recent articles from our blog. Our writers, many of them Ph.D. graduates or candidates, create easy-to-read articles on a wide variety of topics.


Latest news from Mayfield Heights, OH collected exclusively by city-data.com from local newspapers, TV, and radio stations
Ancestries: Italian (15.0%), German (6.3%), Russian (5.0%), Irish (4.4%), Romanian (3.1%), American (2.3%).
Current Local Time: EST time zone
Elevation: 1080 feet
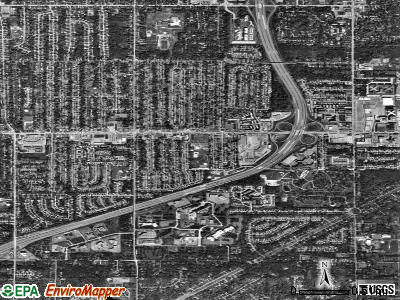
Land area: 4.22 square miles.
Population density: 4,720 people per square mile (average).
3,736 residents are foreign born (8.8% Asia, 7.9% Europe).
| This city: | 18.9% |
| Ohio: | 4.9% |
Median real estate property taxes paid for housing units with mortgages in 2022: $3,704 (1.8%)
Median real estate property taxes paid for housing units with no mortgage in 2022: $3,795 (1.9%)
Nearest city with pop. 50,000+: Euclid, OH  (6.3 miles , pop. 52,717).
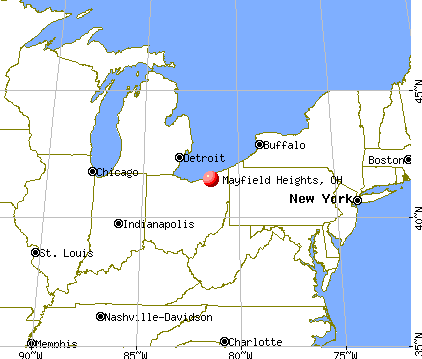
Nearest city with pop. 200,000+: Cleveland, OH (11.3 miles , pop. 478,403).
Nearest city with pop. 1,000,000+: Chicago, IL (322.2 miles , pop. 2,896,016).
Nearest cities:
), ), ), Latitude: 41.52 N, Longitude: 81.46 W
Daytime population change due to commuting: +4,220 (+21.3%)
Workers who live and work in this city: 3,472 (32.1%)
Area code commonly used in this area: 440
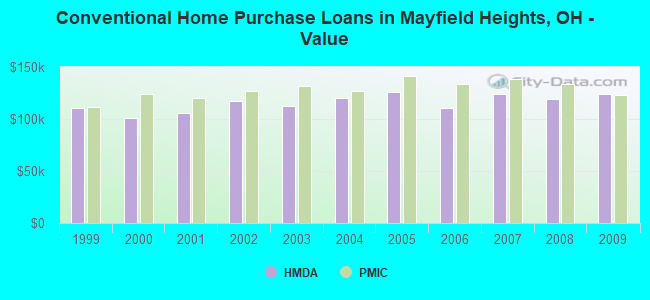
Property values in Mayfield Heights, OH
Mayfield Heights, Ohio accommodation & food services, waste management - Economy and Business Data
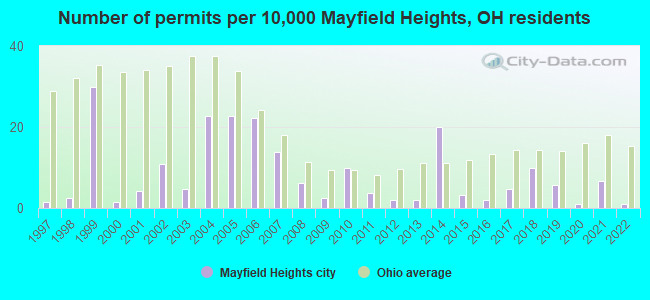
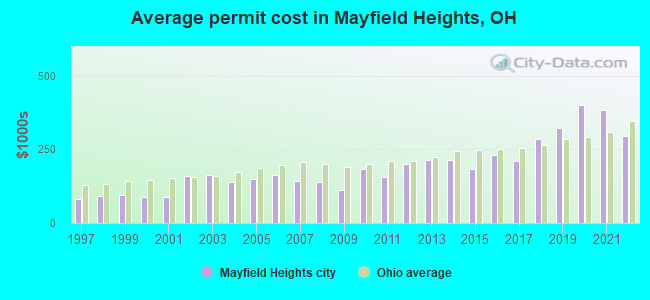
Single-family new house construction building permits:
- 2022: 2 buildings, average cost: $295,000
- 2021: 13 buildings, average cost: $383,500
- 2020: 2 buildings, average cost: $400,000
- 2019: 11 buildings, average cost: $321,400
- 2018: 19 buildings, average cost: $284,700
- 2017: 9 buildings, average cost: $210,000
- 2016: 4 buildings, average cost: $231,300
- 2015: 6 buildings, average cost: $182,500
- 2014: 39 buildings, average cost: $214,900
- 2013: 4 buildings, average cost: $212,300
- 2012: 4 buildings, average cost: $198,800
- 2011: 7 buildings, average cost: $157,100
- 2010: 19 buildings, average cost: $182,100
- 2009: 5 buildings, average cost: $111,000
- 2008: 12 buildings, average cost: $137,500
- 2007: 27 buildings, average cost: $140,600
- 2006: 43 buildings, average cost: $163,700
- 2005: 44 buildings, average cost: $150,000
- 2004: 44 buildings, average cost: $138,700
- 2003: 9 buildings, average cost: $161,700
- 2002: 21 buildings, average cost: $159,800
- 2001: 8 buildings, average cost: $86,900
- 2000: 3 buildings, average cost: $88,300
- 1999: 58 buildings, average cost: $94,900
- 1998: 5 buildings, average cost: $92,000
- 1997: 3 buildings, average cost: $83,300
| Here: | 3.2% |
| Ohio: | 3.1% |
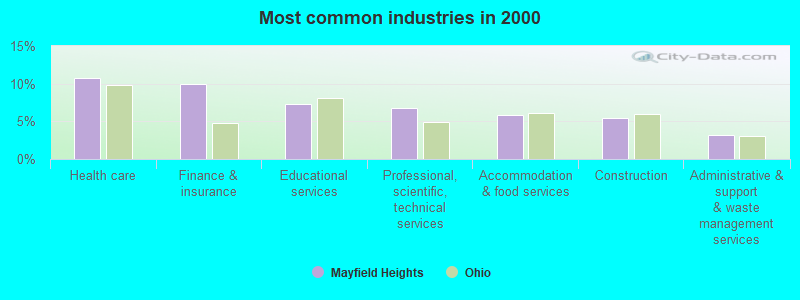
- Health care (10.7%)
- Finance & insurance (9.9%)
- Educational services (7.3%)
- Professional, scientific, technical services (6.8%)
- Accommodation & food services (5.8%)
- Construction (5.5%)
- Administrative & support & waste management services (3.1%)
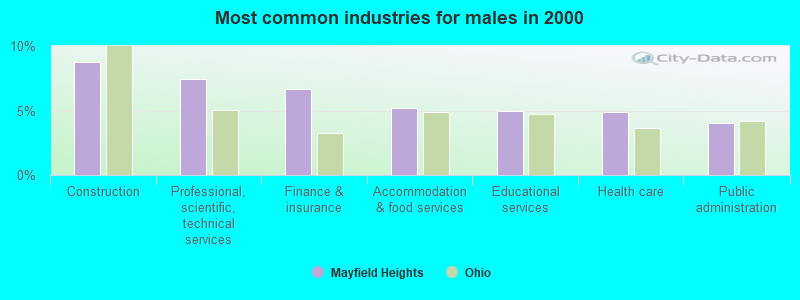
- Construction (8.7%)
- Professional, scientific, technical services (7.4%)
- Finance & insurance (6.6%)
- Accommodation & food services (5.2%)
- Educational services (5.0%)
- Health care (4.9%)
- Public administration (4.1%)
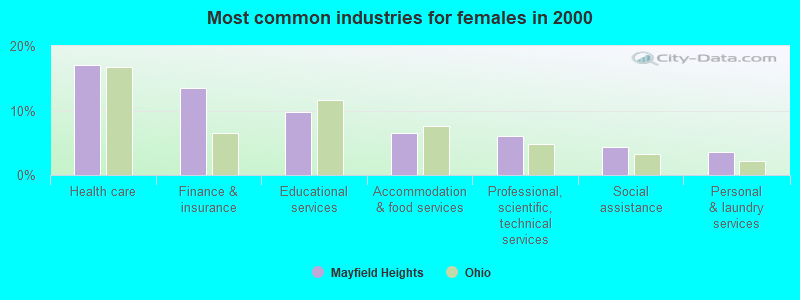
- Health care (17.1%)
- Finance & insurance (13.5%)
- Educational services (9.8%)
- Accommodation & food services (6.5%)
- Professional, scientific, technical services (6.1%)
- Social assistance (4.3%)
- Personal & laundry services (3.6%)
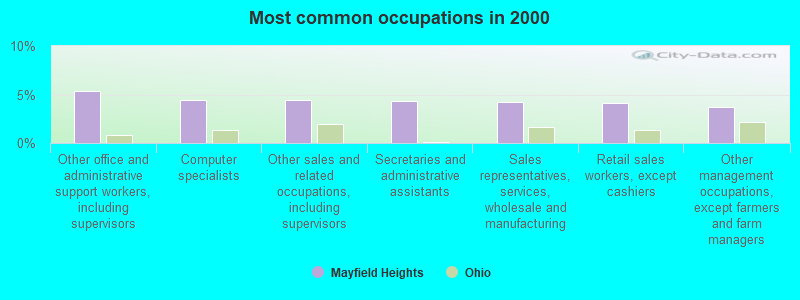
- Other office and administrative support workers, including supervisors (5.3%)
- Computer specialists (4.4%)
- Other sales and related occupations, including supervisors (4.4%)
- Secretaries and administrative assistants (4.3%)
- Sales representatives, services, wholesale and manufacturing (4.2%)
- Retail sales workers, except cashiers (4.1%)
- Other management occupations, except farmers and farm managers (3.7%)
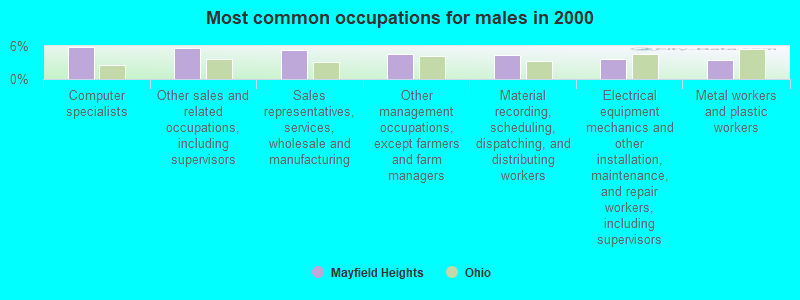
- Computer specialists (5.7%)
- Other sales and related occupations, including supervisors (5.6%)
- Sales representatives, services, wholesale and manufacturing (5.4%)
- Other management occupations, except farmers and farm managers (4.6%)
- Material recording, scheduling, dispatching, and distributing workers (4.4%)
- Electrical equipment mechanics and other installation, maintenance, and repair workers, including supervisors (3.6%)
- Metal workers and plastic workers (3.5%)

- Other office and administrative support workers, including supervisors (9.5%)
- Secretaries and administrative assistants (9.1%)
- Retail sales workers, except cashiers (6.0%)
- Preschool, kindergarten, elementary, and middle school teachers (4.5%)
- Registered nurses (3.6%)
- Other sales and related occupations, including supervisors (3.1%)
- Information and record clerks, except customer service representatives (3.0%)
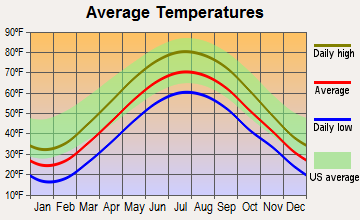
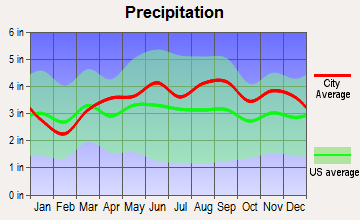
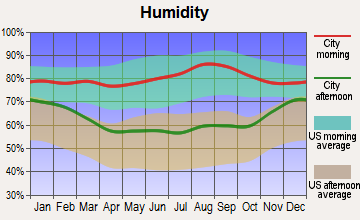
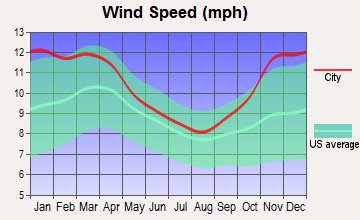
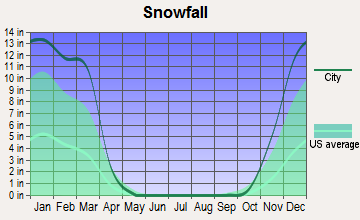
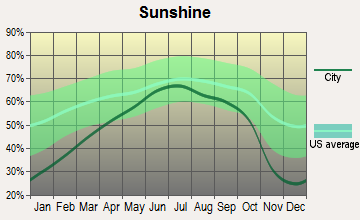
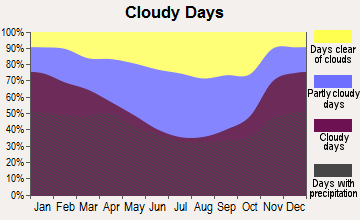
Average climate in Mayfield Heights, Ohio
Based on data reported by over 4,000 weather stations
|
|

(lower is better)
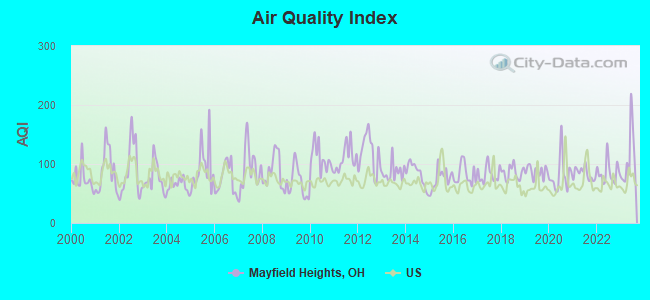
Air Quality Index (AQI) level in 2023 was 109. This is significantly worse than average.
| City: | 109 |
| U.S.: | 73 |
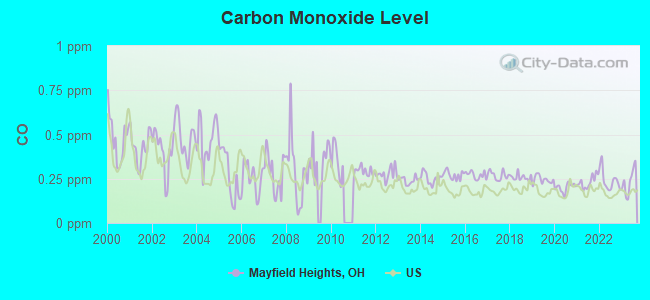
Carbon Monoxide (CO) [ppm] level in 2023 was 0.235. This is about average. Closest monitor was 7.4 miles away from the city center.
| City: | 0.235 |
| U.S.: | 0.251 |
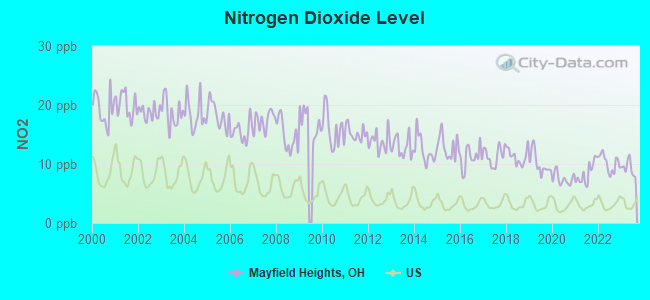
Nitrogen Dioxide (NO2) [ppb] level in 2023 was 9.32. This is significantly worse than average. Closest monitor was 1.3 miles away from the city center.
| City: | 9.32 |
| U.S.: | 5.11 |
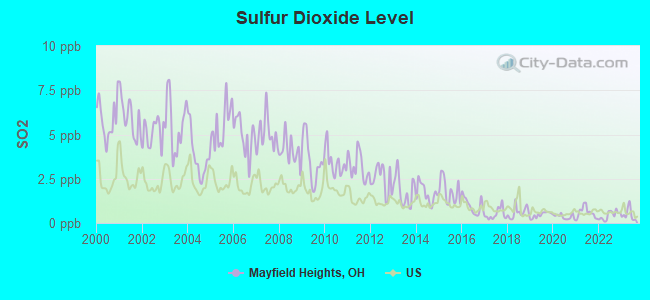
Sulfur Dioxide (SO2) [ppb] level in 2023 was 0.491. This is significantly better than average. Closest monitor was 1.3 miles away from the city center.
| City: | 0.491 |
| U.S.: | 1.515 |
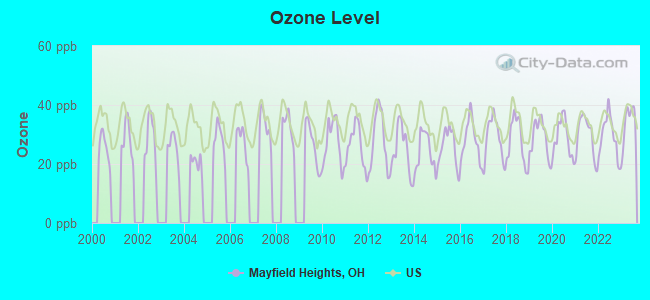
Ozone [ppb] level in 2023 was 34.0. This is about average. Closest monitor was 6.7 miles away from the city center.
| City: | 34.0 |
| U.S.: | 33.3 |
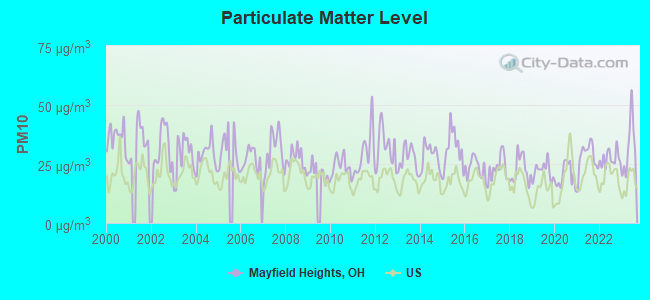
Particulate Matter (PM10) [µg/m3] level in 2023 was 32.2. This is significantly worse than average. Closest monitor was 10.9 miles away from the city center.
| City: | 32.2 |
| U.S.: | 19.2 |
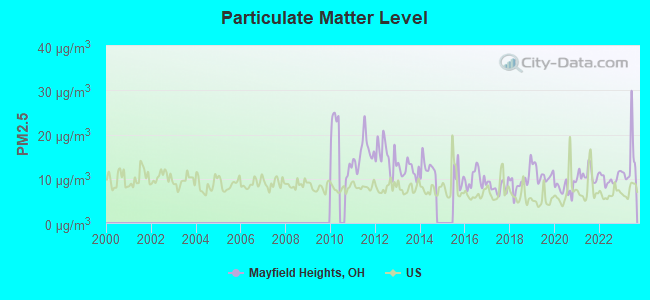
Particulate Matter (PM2.5) [µg/m3] level in 2023 was 13.9. This is significantly worse than average. Closest monitor was 7.5 miles away from the city center.
| City: | 13.9 |
| U.S.: | 8.1 |
Tornado activity:
Mayfield Heights-area historical tornado activity is slightly below Ohio state average. It is 10% smaller than the overall U.S. average.
On 5/31/1985, a category F5 (max. wind speeds 261-318 mph) tornado 27.1 miles away from the Mayfield Heights city center killed 18 people and injured 310 people and caused between $50,000,000 and $500,000,000 in damages.
On 6/8/1953, a category F4 (max. wind speeds 207-260 mph) tornado 13.7 miles away from the city center killed 17 people and injured 379 people.
Earthquake activity:
Mayfield Heights-area historical earthquake activity is significantly above Ohio state average. It is 52% smaller than the overall U.S. average.On 9/25/1998 at 19:52:52, a magnitude 5.2 (4.8 MB, 4.3 MS, 5.2 LG, 4.5 MW, Depth: 3.1 mi, Class: Moderate, Intensity: VI - VII) earthquake occurred 54.9 miles away from the city center
On 1/31/1986 at 16:46:43, a magnitude 5.0 (5.0 MB) earthquake occurred 16.4 miles away from the city center
On 8/23/2011 at 17:51:04, a magnitude 5.8 (5.8 MW, Depth: 3.7 mi) earthquake occurred 311.9 miles away from the city center
On 6/10/2019 at 14:50:45, a magnitude 4.0 (4.0 MB, Depth: 1.2 mi, Class: Light, Intensity: IV - V) earthquake occurred 11.2 miles away from Mayfield Heights center
On 7/27/1980 at 18:52:21, a magnitude 5.2 (5.1 MB, 4.7 MS, 5.0 UK, 5.2 UK) earthquake occurred 264.4 miles away from Mayfield Heights center
On 12/31/2011 at 20:05:01, a magnitude 4.0 (4.0 ML, Depth: 3.1 mi) earthquake occurred 48.5 miles away from Mayfield Heights center
Magnitude types: regional Lg-wave magnitude (LG), body-wave magnitude (MB), local magnitude (ML), surface-wave magnitude (MS), moment magnitude (MW)
Natural disasters:
The number of natural disasters in Cuyahoga County (16) is near the US average (15).Major Disasters (Presidential) Declared: 12
Emergencies Declared: 3
Causes of natural disasters: Storms: 9, Floods: 8, Tornadoes: 7, Winds: 3, Hurricanes: 2, Blizzard: 1, Heavy Rain: 1, Power Outage: 1, Snowstorm: 1, Tropical Storm: 1, Other: 1 (Note: some incidents may be assigned to more than one category).
Main business address for: NACCO INDUSTRIES INC (INDUSTRIAL TRUCKS TRACTORS TRAILERS & STACKERS), CHART INDUSTRIES INC (FABRICATED PLATE WORK (BOILER SHOPS)), DATATRAK INTERNATIONAL INC (SERVICES-PREPACKAGED SOFTWARE).
Hospitals and medical centers in Mayfield Heights:
Heliports located in Mayfield Heights:
Amtrak station near Mayfield Heights:
Colleges/universities with over 2000 students nearest to Mayfield Heights:
- John Carroll University (about 5 miles; University Heights, OH; Full-time enrollment: 3,546)
- Case Western Reserve University (about 8 miles; Cleveland, OH; FT enrollment: 7,034)
- Lakeland Community College (about 10 miles; Kirtland, OH; FT enrollment: 6,170)
- Cuyahoga Community College District (about 12 miles; Cleveland, OH; FT enrollment: 20,271)
- Cleveland State University (about 12 miles; Cleveland, OH; FT enrollment: 14,161)
- Baldwin Wallace University (about 23 miles; Berea, OH; FT enrollment: 3,699)
- Kent State University at Kent (about 27 miles; Kent, OH; FT enrollment: 25,431)
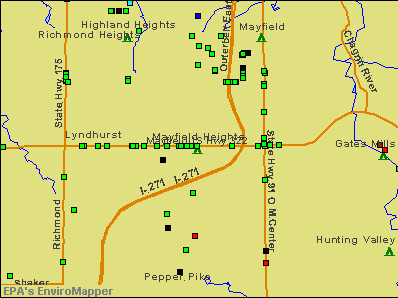
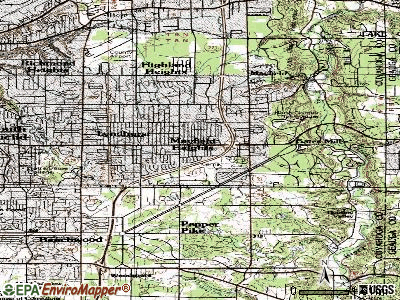
Points of interest:
Notable locations in Mayfield Heights: Lander Haven Country Club (A), Mayfield Heights Fire Department (B), Mayfield Heights City Hall (C). Display/hide their locations on the map
Shopping Centers: Mayland Shopping Center (1), Golden Gate Shopping Center (2), East Gate Shopping Center (3). Display/hide their locations on the map
Main business address in Mayfield Heights include: NACCO INDUSTRIES INC (A), CHART INDUSTRIES INC (B), DATATRAK INTERNATIONAL INC (C). Display/hide their locations on the map
Cemeteries: Acacia Park Cemetery (1), Knollwood Cemetery (2). Display/hide their locations on the map
Hotel: Baymont Inn & Suites - Mayfield Heights (1421 Golden Gate Blvd).
Birthplace of: Kevin Coughlin - Politician, Matt Prater - Football player, Jim Coode - Football player.
| This city: | 2.0 people |
| Ohio: | 2.4 people |
| This city: | 50.5% |
| Whole state: | 65.0% |
| This city: | 4.5% |
| Whole state: | 6.8% |
Likely homosexual households (counted as self-reported same-sex unmarried-partner households)
- Lesbian couples: 0.3% of all households
- Gay men: 0.1% of all households
People in group quarters in Mayfield Heights in 2010:
- 121 people in nursing facilities/skilled-nursing facilities
- 8 people in residential treatment centers for adults
- 2 people in local jails and other municipal confinement facilities
People in group quarters in Mayfield Heights in 2000:
- 144 people in nursing homes
- 7 people in homes for the mentally retarded
- 5 people in local jails and other confinement facilities (including police lockups)
Banks with most branches in Mayfield Heights (2011 data):
- The Huntington National Bank: Mayfield Heights Giant Eagle Branch, Mayfield Hts Branch, Corporate Financial Center Branch, Mayfield Heights Branch. Info updated 2012/04/02: Bank assets: $54,183.4 mil, Deposits: $44,300.3 mil, headquarters in Columbus, OH, positive income, Commercial Lending Specialization, 878 total offices, Holding Company: Huntington Bancshares Incorporated
- U.S. Bank National Association: Eastgate Cleveland Branch, Mayfield Branch, Mayfield Heights Walmart. Info updated 2012/01/30: Bank assets: $330,470.8 mil, Deposits: $236,091.5 mil, headquarters in Cincinnati, OH, positive income, 3121 total offices, Holding Company: U.S. Bancorp
- Firstmerit Bank, National Association: Mayfield Heights at 6689 Eastgate Drive, branch established on 1996/03/19. Info updated 2010/05/17: Bank assets: $14,420.6 mil, Deposits: $11,497.6 mil, headquarters in Akron, OH, positive income, Commercial Lending Specialization, 213 total offices, Holding Company: Firstmerit Corporation
- Dollar Bank, Federal Savings Bank: Mayfield Heights Branch at 1283 Som Center Rd, branch established on 2007/06/04. Info updated 2011/07/21: Bank assets: $6,350.8 mil, Deposits: $4,971.8 mil, headquarters in Pittsburgh, PA, positive income, Mortgage Lending Specialization, 62 total offices
- PNC Bank, National Association: Eastgate Branch at 1272 Som Center Rd., branch established on 1967/07/27. Info updated 2012/03/20: Bank assets: $263,309.6 mil, Deposits: $197,343.0 mil, headquarters in Wilmington, DE, positive income, Commercial Lending Specialization, 3085 total offices, Holding Company: Pnc Financial Services Group, Inc., The
- Park View Federal Savings Bank: 1244 Som Center Road at 1244 Som Center Road, branch established on 2004/06/14. Info updated 2011/07/21: Bank assets: $803.3 mil, Deposits: $696.8 mil, headquarters in Solon, OH, negative income in the last year, Commercial Lending Specialization, 17 total offices
- Fifth Third Bank: Mayfield Heights Branch at 1209 Som Center Road, branch established on 1886/01/01. Info updated 2009/10/05: Bank assets: $114,540.4 mil, Deposits: $89,689.1 mil, headquarters in Cincinnati, OH, positive income, Commercial Lending Specialization, 1378 total offices, Holding Company: Fifth Third Bancorp
- New York Community Bank: 6500 Mayfield Rd Branch at 6500 Mayfield Rd, branch established on 1921/01/01. Info updated 2010/03/29: Bank assets: $39,468.7 mil, Deposits: $20,709.8 mil, headquarters in Westbury, NY, positive income, Commercial Lending Specialization, 247 total offices, Holding Company: New York Community Bancorp, Inc.
- KeyBank National Association: Mayfield-Som Branch at 1400 Som Center Road, branch established on 1958/08/22. Info updated 2008/03/03: Bank assets: $86,198.8 mil, Deposits: $64,214.8 mil, headquarters in Cleveland, OH, positive income, Commercial Lending Specialization, 1067 total offices, Holding Company: Keycorp
For population 15 years and over in Mayfield Heights:
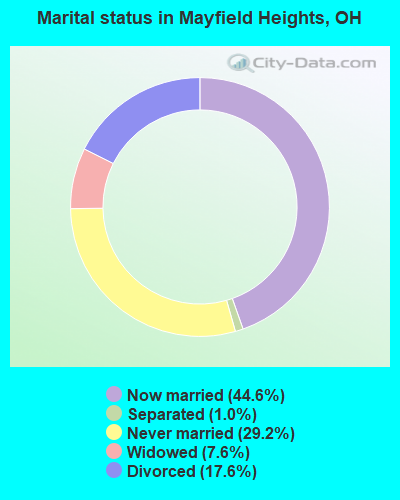
- Never married: 29.2%
- Now married: 44.6%
- Separated: 1.0%
- Widowed: 7.6%
- Divorced: 17.6%
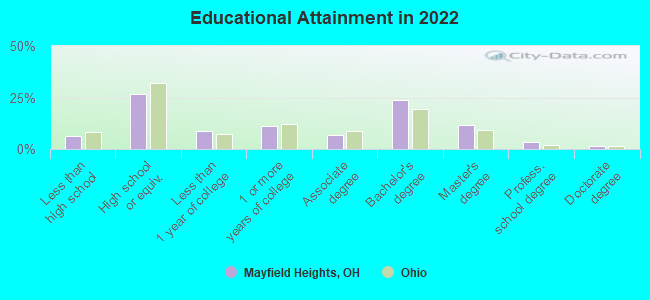
For population 25 years and over in Mayfield Heights:
- High school or higher: 93.1%
- Bachelor's degree or higher: 37.5%
- Graduate or professional degree: 14.8%
- Unemployed: 5.2%
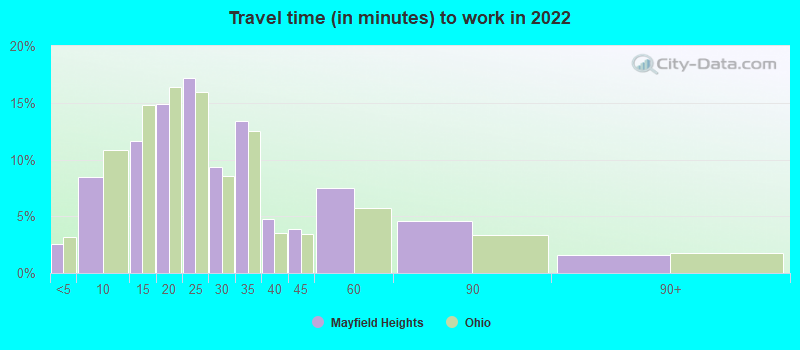
- Mean travel time to work (commute): 17.8 minutes
| Here: | 10.9 |
| Ohio average: | 11.0 |
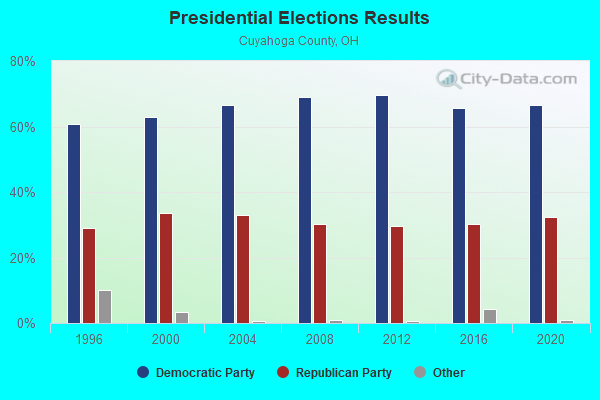
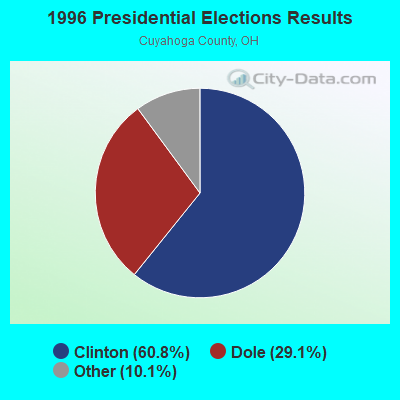
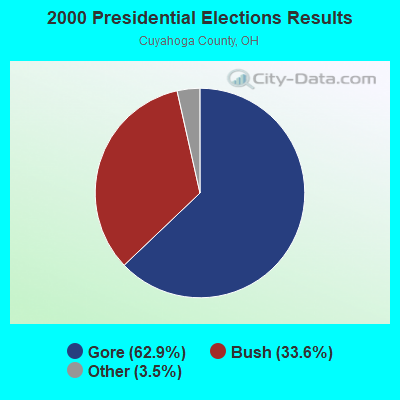
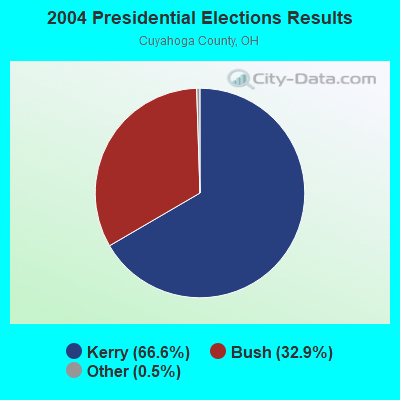
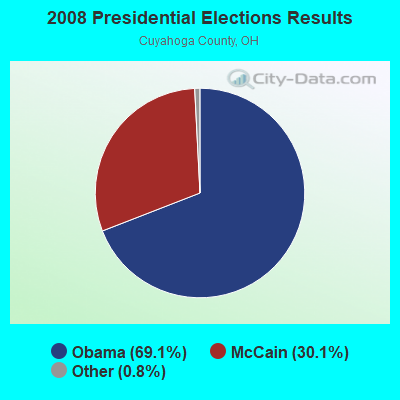
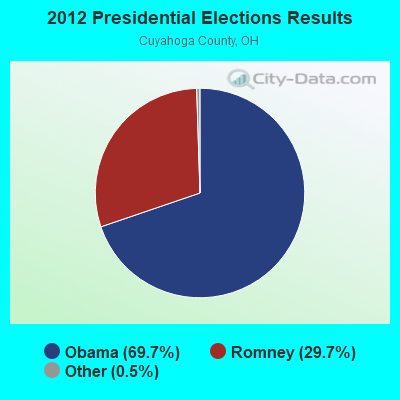
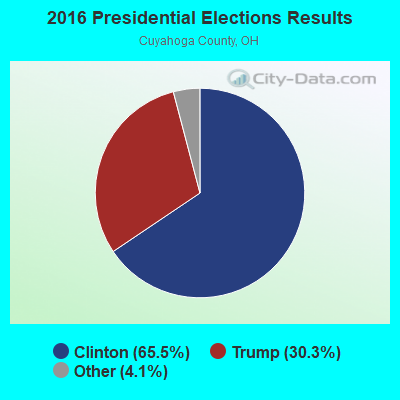
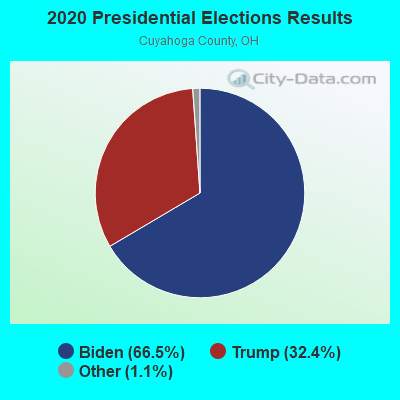
Graphs represent county-level data. Detailed 2008 Election Results
Political contributions by individuals in Mayfield Heights, OH
Religion statistics for Mayfield Heights, OH (based on Cuyahoga County data)
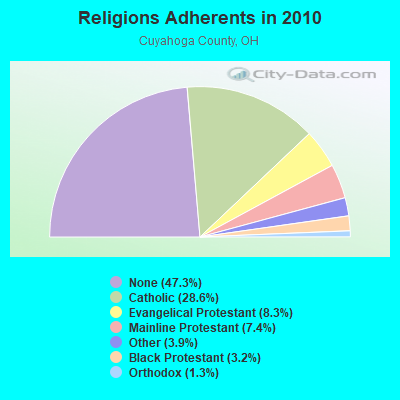
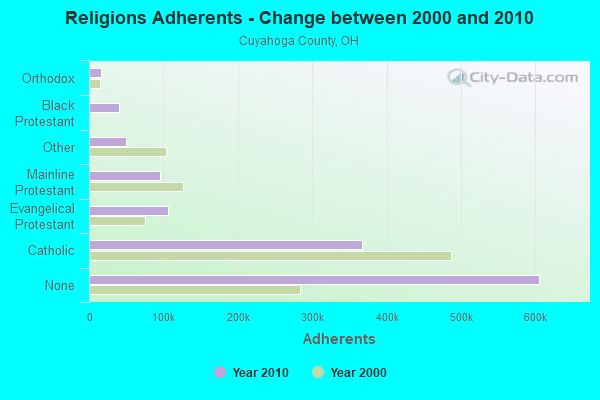
| Religion | Adherents | Congregations |
|---|---|---|
| Catholic | 366,464 | 110 |
| Evangelical Protestant | 106,477 | 326 |
| Mainline Protestant | 94,977 | 233 |
| Other | 49,641 | 126 |
| Black Protestant | 40,776 | 129 |
| Orthodox | 16,456 | 31 |
| None | 605,331 | - |
Food Environment Statistics:
| Here: | 2.33 / 10,000 pop. |
| State: | 1.89 / 10,000 pop. |
| Cuyahoga County: | 0.05 / 10,000 pop. |
| Ohio: | 0.13 / 10,000 pop. |
| This county: | 1.68 / 10,000 pop. |
| Ohio: | 1.25 / 10,000 pop. |
| This county: | 2.26 / 10,000 pop. |
| Ohio: | 2.93 / 10,000 pop. |
| Here: | 6.88 / 10,000 pop. |
| Ohio: | 6.25 / 10,000 pop. |
| Here: | 10.8% |
| Ohio: | 10.3% |
| This county: | 28.3% |
| State: | 29.1% |
| Cuyahoga County: | 10.4% |
| Ohio: | 11.9% |
Health and Nutrition:
| This city: | 53.2% |
| Ohio: | 50.4% |
| Mayfield Heights: | 49.7% |
| State: | 47.8% |
| Mayfield Heights: | 28.2 |
| Ohio: | 28.7 |
| This city: | 18.1% |
| Ohio: | 20.6% |
| Here: | 11.4% |
| Ohio: | 10.4% |
| Mayfield Heights: | 7.0 |
| State: | 6.8 |
| Mayfield Heights: | 33.8% |
| Ohio: | 34.3% |
| This city: | 57.7% |
| Ohio: | 57.0% |
| Mayfield Heights: | 77.1% |
| State: | 79.1% |
More about Health and Nutrition of Mayfield Heights, OH Residents
| Local government employment and payroll (March 2022) | |||||
| Function | Full-time employees | Monthly full-time payroll | Average yearly full-time wage | Part-time employees | Monthly part-time payroll |
|---|---|---|---|---|---|
| Police Protection - Officers | 38 | $342,675 | $108,213 | 0 | $0 |
| Firefighters | 35 | $300,178 | $102,918 | 0 | $0 |
| Other and Unallocable | 14 | $87,753 | $75,217 | 0 | $0 |
| Police - Other | 11 | $72,581 | $79,179 | 3 | $6,361 |
| Streets and Highways | 11 | $55,859 | $60,937 | 0 | $0 |
| Parks and Recreation | 9 | $55,165 | $73,553 | 4 | $2,241 |
| Other Government Administration | 5 | $35,824 | $85,978 | 32 | $10,324 |
| Financial Administration | 3 | $26,436 | $105,744 | 1 | $3,132 |
| Fire - Other | 1 | $6,106 | $73,272 | 0 | $0 |
| Judicial and Legal | 1 | $5,337 | $64,044 | 0 | $0 |
| Totals for Government | 128 | $987,915 | $92,617 | 40 | $22,059 |
Mayfield Heights government finances - Expenditure in 2021 (per resident):
- Construction - Regular Highways: $2,493,000 ($125.23)
Central Staff Services: $199,000 ($10.00)
Parks and Recreation: $88,000 ($4.42)
General Public Buildings: $70,000 ($3.52)
Police Protection: $10,000 ($0.50)
- Current Operations - Police Protection: $8,158,000 ($409.81)
Local Fire Protection: $6,278,000 ($315.37)
Regular Highways: $2,686,000 ($134.93)
Central Staff Services: $1,660,000 ($83.39)
Parks and Recreation: $1,509,000 ($75.80)
Financial Administration: $1,246,000 ($62.59)
Protective Inspection and Regulation - Other: $989,000 ($49.68)
Solid Waste Management: $824,000 ($41.39)
General - Other: $670,000 ($33.66)
Judicial and Legal Services: $285,000 ($14.32)
Health - Other: $151,000 ($7.59)
- General - Interest on Debt: $108,000 ($5.43)
- Other Capital Outlay - Regular Highways: $351,000 ($17.63)
Local Fire Protection: $263,000 ($13.21)
Police Protection: $230,000 ($11.55)
Central Staff Services: $36,000 ($1.81)
Parks and Recreation: $23,000 ($1.16)
Financial Administration: $6,000 ($0.30)
- Total Salaries and Wages: $13,413,000 ($673.78)
Mayfield Heights government finances - Revenue in 2021 (per resident):
- Charges - Other: $927,000 ($46.57)
Parks and Recreation: $319,000 ($16.02)
- Federal Intergovernmental - Other: $1,412,000 ($70.93)
- Local Intergovernmental - General Local Government Support: $420,000 ($21.10)
Other: $204,000 ($10.25)
Highways: $150,000 ($7.54)
- Miscellaneous - General Revenue - Other: $1,847,000 ($92.78)
Interest Earnings: $194,000 ($9.75)
Donations From Private Sources: $194,000 ($9.75)
Fines and Forfeits: $104,000 ($5.22)
Rents: $73,000 ($3.67)
Sale of Property: $27,000 ($1.36)
Royalties: $1,000 ($0.05)
- State Intergovernmental - Highways: $922,000 ($46.32)
General Local Government Support: $484,000 ($24.31)
Other: $131,000 ($6.58)
- Tax - Individual Income: $19,160,000 ($962.48)
Property: $5,269,000 ($264.68)
Other Selective Sales: $204,000 ($10.25)
Other License: $81,000 ($4.07)
Occupation and Business License - Other: $50,000 ($2.51)
Amusements Sales: $21,000 ($1.05)
Public Utilities Sales: $19,000 ($0.95)
Amusements License: $5,000 ($0.25)
Mayfield Heights government finances - Debt in 2021 (per resident):
- Long Term Debt - Beginning Outstanding - Unspecified Public Purpose: $3,420,000 ($171.80)
Retired Unspecified Public Purpose: $2,500,000 ($125.58)
Outstanding Unspecified Public Purpose: $2,420,000 ($121.57)
Issue, Unspecified Public Purpose: $1,500,000 ($75.35)
- Short Term Debt Outstanding - End of Fiscal Year: $9,000,000 ($452.10)
Beginning: $1,100,000 ($55.26)
Mayfield Heights government finances - Cash and Securities in 2021 (per resident):
- Other Funds - Cash and Securities: $30,032,000 ($1508.62)
4.02% of this county's 2021 resident taxpayers lived in other counties in 2020 ($66,006 average adjusted gross income)
| Here: | 4.02% |
| Ohio average: | 5.68% |
0.02% of residents moved from foreign countries ($135 average AGI)
Cuyahoga County: 0.02% Ohio average: 0.01%
Top counties from which taxpayers relocated into this county between 2020 and 2021:
| from Lorain County, OH | |
| from Summit County, OH | |
| from Lake County, OH |
5.02% of this county's 2020 resident taxpayers moved to other counties in 2021 ($88,842 average adjusted gross income)
| Here: | 5.02% |
| Ohio average: | 5.79% |
0.01% of residents moved to foreign countries ($120 average AGI)
Cuyahoga County: 0.01% Ohio average: 0.01%
Top counties to which taxpayers relocated from this county between 2020 and 2021:
| to Lorain County, OH | |
| to Summit County, OH | |
| to Lake County, OH |
| Businesses in Mayfield Heights, OH | ||||
| Name | Count | Name | Count | |
|---|---|---|---|---|
| AT&T | 1 | Marshalls | 1 | |
| Arby's | 1 | McDonald's | 1 | |
| AutoZone | 1 | Men's Wearhouse | 1 | |
| Bath & Body Works | 1 | Nike | 1 | |
| Bed Bath & Beyond | 1 | Nissan | 1 | |
| CVS | 2 | OfficeMax | 1 | |
| Chipotle | 1 | Old Navy | 1 | |
| Chuck E. Cheese's | 1 | Panera Bread | 1 | |
| Comfort Inn | 1 | PetSmart | 1 | |
| Dairy Queen | 1 | Pizza Hut | 1 | |
| DressBarn | 1 | Rite Aid | 2 | |
| Dressbarn | 1 | Staples | 1 | |
| Dunkin Donuts | 1 | Starbucks | 1 | |
| Famous Footwear | 1 | Subway | 1 | |
| FedEx | 4 | T-Mobile | 3 | |
| Ford | 1 | T.G.I. Driday's | 1 | |
| GNC | 1 | Target | 1 | |
| GameStop | 1 | Toys"R"Us | 1 | |
| H&R Block | 1 | UPS | 1 | |
| Holiday Inn | 1 | Verizon Wireless | 1 | |
| Jimmy John's | 1 | Walgreens | 1 | |
| Lane Bryant | 1 | Walmart | 1 | |
| Little Caesars Pizza | 1 | |||
Strongest AM radio stations in Mayfield Heights:
- WKNR (850 AM; 50 kW; CLEVELAND, OH; Owner: CARON BROADCASTING, INC.)
- WTAM (1100 AM; 50 kW; CLEVELAND, OH; Owner: JACOR BROADCASTING CORPORATION)
- WHK (1220 AM; 50 kW; CLEVELAND, OH; Owner: CARON BROADCASTING, INC.)
- WWMK (1260 AM; 10 kW; CLEVELAND, OH; Owner: ABC, INC.)
- WRMR (1420 AM; 5 kW; CLEVELAND, OH; Owner: CLEVELAND CLASSICAL RADIO, LLC)
- WJMO (1490 AM; 1 kW; CLEVELAND HEIGHTS, OH; Owner: BLUE CHIP BROADCASTING LICENSES, LTD.)
- WERE (1300 AM; 5 kW; CLEVELAND, OH)
- WCUE (1150 AM; 5 kW; CUYAHOGA FALLS, OH; Owner: FAMILY STATIONS, INC.)
- WABQ (1540 AM; daytime; 1 kW; CLEVELAND, OH; Owner: WABQ, INC.)
- WHLO (640 AM; 5 kW; AKRON, OH; Owner: CLEAR CHANNEL BROADCASTING LICENSES, INC.)
- WTOU (1350 AM; 5 kW; AKRON, OH)
- WJR (760 AM; 50 kW; DETROIT, MI; Owner: ABC, INC.)
- WHBC (1480 AM; 15 kW; CANTON, OH; Owner: NM LICENSING, LLC)
Strongest FM radio stations in Mayfield Heights:
- WFHM-FM (95.5 FM; CLEVELAND, OH; Owner: SCA LICENSE CORPORATION)
- WXTM (92.3 FM; CLEVELAND HEIGHTS, OH; Owner: INFINITY RADIO OPERATIONS INC.)
- WJCU (88.7 FM; UNIVERSITY HEIGHTS, OH; Owner: JOHN CARROLL UNIVERSITY)
- WENZ (107.9 FM; CLEVELAND, OH; Owner: RADIO ONE LICENSES, LLC)
- WMJI (105.7 FM; CLEVELAND, OH; Owner: CITICASTERS LICENSES, L.P.)
- WDOK (102.1 FM; CLEVELAND, OH; Owner: INFINITY RADIO OPERATIONS INC.)
- WQAL (104.1 FM; CLEVELAND, OH; Owner: INFINITY RADIO OPERATIONS INC.)
- WMVX (106.5 FM; CLEVELAND, OH; Owner: JACOR BROADCASTING CORPORATION)
- WRUW-FM (91.1 FM; CLEVELAND, OH; Owner: CASE WESTERN RESERVE UNIVERSITY)
- WNCX (98.5 FM; CLEVELAND, OH; Owner: INFINITY RADIO OF CLEVELAND INC.)
- WKHR (91.5 FM; BAINBRIDGE, OH; Owner: KENSTON LOCAL SCHOOL DISTRICT)
- WMMS (100.7 FM; CLEVELAND, OH; Owner: CITICASTERS LICENSES, L.P.)
- WCRF-FM (103.3 FM; CLEVELAND, OH; Owner: THE MOODY BIBLE INSTITUTE OF CHICAGO)
- WZAK (93.1 FM; CLEVELAND, OH; Owner: RADIO ONE LICENSES, LLC)
- WCPN (90.3 FM; CLEVELAND, OH; Owner: IDEASTREAM)
- WGAR-FM (99.5 FM; CLEVELAND, OH; Owner: CITICASTERS LICENSES, L.P.)
- WAKS (96.5 FM; AKRON, OH; Owner: CAPSTAR TX LIMITED PARTNERSHIP)
- WKSU-FM (89.7 FM; KENT, OH; Owner: KENT STATE UNIVERSITY)
- WQMX (94.9 FM; MEDINA, OH; Owner: RUBBER CITY RADIO GROUP, INC)
- WONE-FM (97.5 FM; AKRON, OH; Owner: RUBBER CITY RADIO GROUP, INC.)
TV broadcast stations around Mayfield Heights:
- WXOX-LP (Channel 65; CLEVELAND, OH; Owner: VENTURE TECHNOLOGIES GROUP, LLC)
- W53AX (Channel 53; CLEVELAND, OH; Owner: WORD OF GOD FELLOWSHIP, INC.)
- WKYC-TV (Channel 3; CLEVELAND, OH; Owner: WKYC-TV, INC.)
- WOIO (Channel 19; SHAKER HEIGHTS, OH; Owner: RAYCOM NATIONAL, INC.)
- WRAP-CA (Channel 32; CLEVELAND, OH; Owner: COMMERCIAL BROADCASTING CORP.)
- WBNX-TV (Channel 55; AKRON, OH; Owner: WINSTON BROADCASTING NETWORK, INC.)
- W35AX (Channel 35; CLEVELAND, OH; Owner: MEDIA-COM TELEVISION, INC.)
- WQHS-TV (Channel 61; CLEVELAND, OH; Owner: UNIVISION CLEVELAND LLC)
- W51BI (Channel 51; KIRTLAND, OH; Owner: TRINITY BROADCASTING NETWORK)
- WEWS-TV (Channel 5; CLEVELAND, OH; Owner: SCRIPPS HOWARD BROADCASTING COMPANY)
- WUAB (Channel 43; LORAIN, OH; Owner: RAYCOM NATIONAL, INC.)
- WJW (Channel 8; CLEVELAND, OH; Owner: WJW LICENSE, INC.)
- WVIZ (Channel 25; CLEVELAND, OH; Owner: IDEASTREAM)
- WEAO (Channel 49; AKRON, OH; Owner: NORTHEASTERN EDUCATIONAL TELEVISION OF OHIO, INC.)
- WVPX (Channel 23; AKRON, OH; Owner: PAXSON AKRON LICENSE, INC.)
- WKBN-TV (Channel 27; YOUNGSTOWN, OH; Owner: PIEDMONT TELEVISION OF YOUNGSTOWN LICENSE LLC)
- WAKN-LP (Channel 11; AKRON, OH; Owner: AKRON TELEVISION, INC.)
- WOAC (Channel 67; CANTON, OH; Owner: WRAY, INC.)
- National Bridge Inventory (NBI) Statistics
- 26Number of bridges
- 276ft / 83.5mTotal length
- 1,179,248Total average daily traffic
- 101,577Total average daily truck traffic
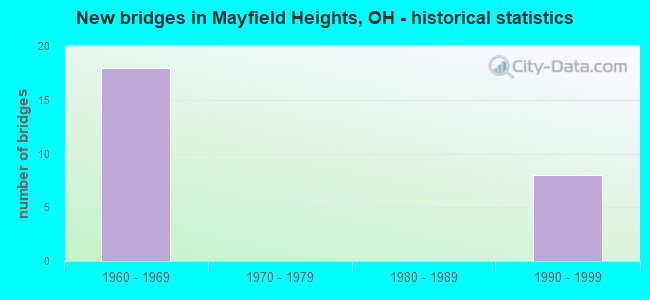
- New bridges - historical statistics
- 181960-1969
- 81990-1999
FCC Registered Private Land Mobile Towers: 2 (See the full list of FCC Registered Private Land Mobile Towers in Mayfield Heights, OH)
FCC Registered Broadcast Land Mobile Towers: 14 (See the full list of FCC Registered Broadcast Land Mobile Towers)
FCC Registered Microwave Towers: 6 (See the full list of FCC Registered Microwave Towers in this town)
FCC Registered Paging Towers: 3 (See the full list of FCC Registered Paging Towers)
FCC Registered Amateur Radio Licenses: 54 (See the full list of FCC Registered Amateur Radio Licenses in Mayfield Heights)
FAA Registered Aircraft Manufacturers and Dealers: 2 (See the full list of FAA Registered Manufacturers and Dealers in Mayfield Heights)
FAA Registered Aircraft: 12 (See the full list of FAA Registered Aircraft)
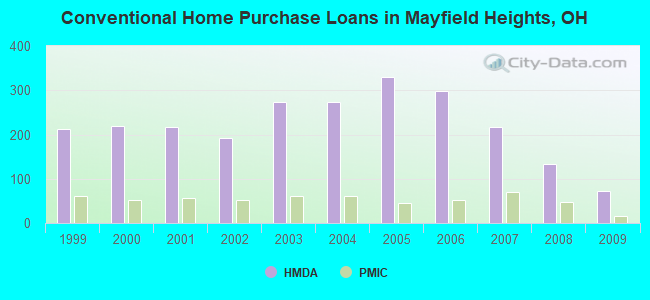
| Home Mortgage Disclosure Act Aggregated Statistics For Year 2009 (Based on 5 full tracts) | ||||||||||||
| A) FHA, FSA/RHS & VA Home Purchase Loans | B) Conventional Home Purchase Loans | C) Refinancings | D) Home Improvement Loans | E) Loans on Dwellings For 5+ Families | F) Non-occupant Loans on < 5 Family Dwellings (A B C & D) | |||||||
|---|---|---|---|---|---|---|---|---|---|---|---|---|
| Number | Average Value | Number | Average Value | Number | Average Value | Number | Average Value | Number | Average Value | Number | Average Value | |
| LOANS ORIGINATED | 95 | $127,116 | 72 | $123,708 | 251 | $123,789 | 10 | $52,100 | 1 | $5,300,000 | 10 | $94,100 |
| APPLICATIONS APPROVED, NOT ACCEPTED | 3 | $102,000 | 2 | $136,000 | 33 | $122,333 | 5 | $40,000 | 0 | $0 | 1 | $60,000 |
| APPLICATIONS DENIED | 1 | $117,000 | 4 | $78,000 | 81 | $125,222 | 11 | $14,636 | 0 | $0 | 3 | $88,000 |
| APPLICATIONS WITHDRAWN | 6 | $148,833 | 4 | $111,250 | 48 | $143,708 | 1 | $13,000 | 0 | $0 | 1 | $167,000 |
| FILES CLOSED FOR INCOMPLETENESS | 2 | $92,000 | 2 | $94,500 | 15 | $135,333 | 1 | $12,000 | 0 | $0 | 3 | $87,667 |
Detailed HMDA statistics for the following Tracts: 1721.01 , 1721.02, 1721.03, 1722.01, 1722.02
| Private Mortgage Insurance Companies Aggregated Statistics For Year 2009 (Based on 5 full tracts) | ||||
| A) Conventional Home Purchase Loans | B) Refinancings | |||
|---|---|---|---|---|
| Number | Average Value | Number | Average Value | |
| LOANS ORIGINATED | 15 | $123,267 | 6 | $183,500 |
| APPLICATIONS APPROVED, NOT ACCEPTED | 3 | $111,667 | 4 | $155,000 |
| APPLICATIONS DENIED | 0 | $0 | 1 | $175,000 |
| APPLICATIONS WITHDRAWN | 1 | $231,000 | 1 | $131,000 |
| FILES CLOSED FOR INCOMPLETENESS | 0 | $0 | 0 | $0 |
Detailed PMIC statistics for the following Tracts: 1721.01 , 1721.02, 1721.03, 1722.01, 1722.02
2002 - 2018 National Fire Incident Reporting System (NFIRS) incidents
- Fire incident types reported to NFIRS in Mayfield Heights, OH
- 35161.6%Structure Fires
- 13423.5%Outside Fires
- 8414.7%Mobile Property/Vehicle Fires
- 10.2%Other
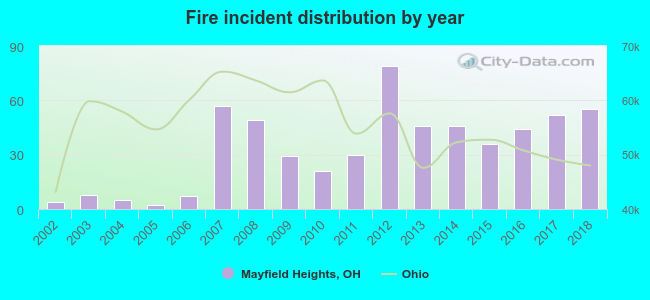 According to the data from the years 2002 - 2018 the average number of fires per year is 34. The highest number of reported fires - 79 took place in 2012, and the least - 2 in 2005. The data has a rising trend.
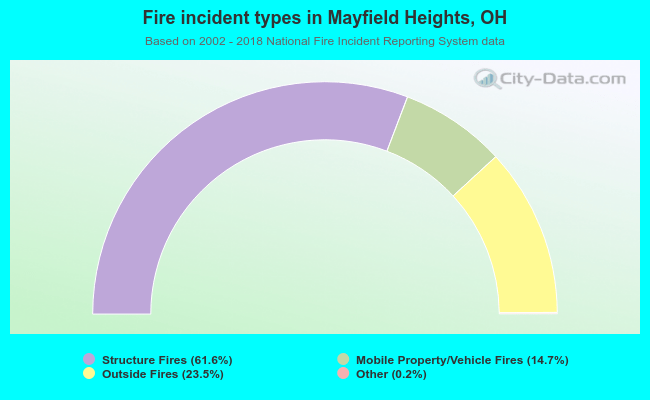 When looking into fire subcategories, the most incidents belonged to: Structure Fires (61.6%), and Outside Fires (23.5%).
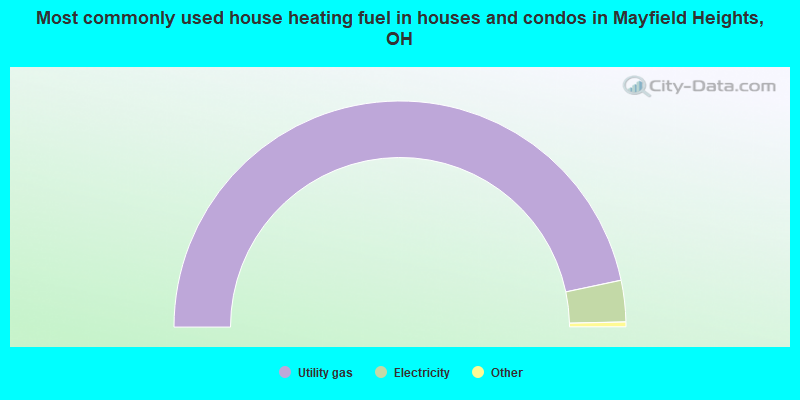
- 93.3%Utility gas
- 5.9%Electricity
- 0.3%Other fuel
- 0.2%Bottled, tank, or LP gas
- 0.2%Wood
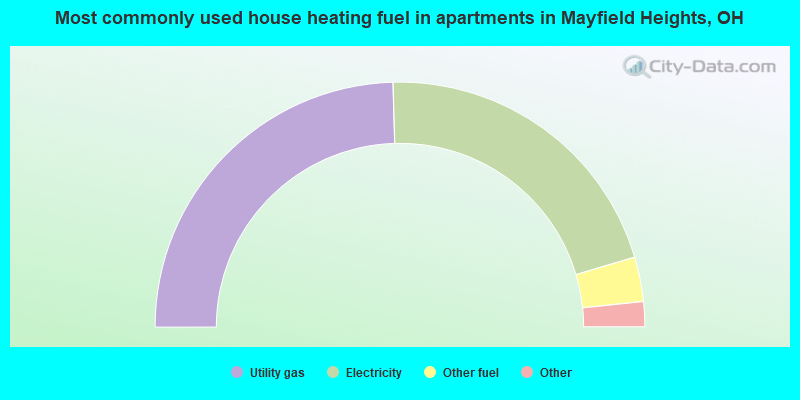
- 49.1%Utility gas
- 41.7%Electricity
- 5.9%Other fuel
- 2.5%No fuel used
- 0.7%Bottled, tank, or LP gas
Mayfield Heights compared to Ohio state average:
- Unemployed percentage below state average.
- Foreign-born population percentage significantly above state average.
- Renting percentage above state average.
- Number of rooms per house below state average.
- Percentage of population with a bachelor's degree or higher above state average.
Mayfield Heights on our top lists:
- #51 on the list of "Top 101 cities with the most residents born in Russia (population 500+)"
- #68 on the list of "Top 101 cities with the most residents born in Italy (population 500+)"
- #82 on the list of "Top 101 cities with the most residents born in Ukraine (population 500+)"
- #100 on the list of "Top 101 cities with the most residents born in Eastern Europe (population 500+)"
- #68 (44124) on the list of "Top 101 zip codes with the largest percentage of Hungarian first ancestries (pop 5,000+)"
- #5 on the list of "Top 101 counties with the most Orthodox congregations"
- #9 on the list of "Top 101 counties with the most Catholic congregations"
- #9 on the list of "Top 101 counties with the most Orthodox adherents"
- #10 on the list of "Top 101 counties with the most Black Protestant congregations"
- #11 on the list of "Top 101 counties with the most Mainline Protestant congregations (pop. 50,000+)"

|
|
Total of 346 patent applications in 2008-2024.