Martinsville, Indiana Submit your own pictures of this city and show them to the world
OSM Map
General Map
Google Map
MSN Map
OSM Map
General Map
Google Map
MSN Map
OSM Map
General Map
Google Map
MSN Map
OSM Map
General Map
Google Map
MSN Map
Please wait while loading the map...
Population in 2022: 11,858 (100% urban, 0% rural). Population change since 2000: +1.4%Males: 6,108 Females: 5,750
March 2022 cost of living index in Martinsville: 86.8 (less than average, U.S. average is 100) Percentage of residents living in poverty in 2022: 9.9%for White Non-Hispanic residents , 2.4% for Black residents , 55.5% for Hispanic or Latino residents , 100.0% for other race residents , 33.2% for two or more races residents )
Profiles of local businesses
Business Search - 14 Million verified businesses
Data:
Median household income ($)
Median household income (% change since 2000)
Household income diversity
Ratio of average income to average house value (%)
Ratio of average income to average rent
Median household income ($) - White
Median household income ($) - Black or African American
Median household income ($) - Asian
Median household income ($) - Hispanic or Latino
Median household income ($) - American Indian and Alaska Native
Median household income ($) - Multirace
Median household income ($) - Other Race
Median household income for houses/condos with a mortgage ($)
Median household income for apartments without a mortgage ($)
Races - White alone (%)
Races - White alone (% change since 2000)
Races - Black alone (%)
Races - Black alone (% change since 2000)
Races - American Indian alone (%)
Races - American Indian alone (% change since 2000)
Races - Asian alone (%)
Races - Asian alone (% change since 2000)
Races - Hispanic (%)
Races - Hispanic (% change since 2000)
Races - Native Hawaiian and Other Pacific Islander alone (%)
Races - Native Hawaiian and Other Pacific Islander alone (% change since 2000)
Races - Two or more races (%)
Races - Two or more races (% change since 2000)
Races - Other race alone (%)
Races - Other race alone (% change since 2000)
Racial diversity
Unemployment (%)
Unemployment (% change since 2000)
Unemployment (%) - White
Unemployment (%) - Black or African American
Unemployment (%) - Asian
Unemployment (%) - Hispanic or Latino
Unemployment (%) - American Indian and Alaska Native
Unemployment (%) - Multirace
Unemployment (%) - Other Race
Population density (people per square mile)
Population - Males (%)
Population - Females (%)
Population - Males (%) - White
Population - Males (%) - Black or African American
Population - Males (%) - Asian
Population - Males (%) - Hispanic or Latino
Population - Males (%) - American Indian and Alaska Native
Population - Males (%) - Multirace
Population - Males (%) - Other Race
Population - Females (%) - White
Population - Females (%) - Black or African American
Population - Females (%) - Asian
Population - Females (%) - Hispanic or Latino
Population - Females (%) - American Indian and Alaska Native
Population - Females (%) - Multirace
Population - Females (%) - Other Race
Coronavirus confirmed cases (May 26, 2024)
Deaths caused by coronavirus (May 26, 2024)
Coronavirus confirmed cases (per 100k population) (May 26, 2024)
Deaths caused by coronavirus (per 100k population) (May 26, 2024)
Daily increase in number of cases (May 26, 2024)
Weekly increase in number of cases (May 26, 2024)
Cases doubled (in days) (May 26, 2024)
Hospitalized patients (Apr 18, 2022)
Negative test results (Apr 18, 2022)
Total test results (Apr 18, 2022)
COVID Vaccine doses distributed (per 100k population) (Sep 19, 2023)
COVID Vaccine doses administered (per 100k population) (Sep 19, 2023)
COVID Vaccine doses distributed (Sep 19, 2023)
COVID Vaccine doses administered (Sep 19, 2023)
Likely homosexual households (%)
Likely homosexual households (% change since 2000)
Likely homosexual households - Lesbian couples (%)
Likely homosexual households - Lesbian couples (% change since 2000)
Likely homosexual households - Gay men (%)
Likely homosexual households - Gay men (% change since 2000)
Cost of living index
Median gross rent ($)
Median contract rent ($)
Median monthly housing costs ($)
Median house or condo value ($)
Median house or condo value ($ change since 2000)
Mean house or condo value by units in structure - 1, detached ($)
Mean house or condo value by units in structure - 1, attached ($)
Mean house or condo value by units in structure - 2 ($)
Mean house or condo value by units in structure by units in structure - 3 or 4 ($)
Mean house or condo value by units in structure - 5 or more ($)
Mean house or condo value by units in structure - Boat, RV, van, etc. ($)
Mean house or condo value by units in structure - Mobile home ($)
Median house or condo value ($) - White
Median house or condo value ($) - Black or African American
Median house or condo value ($) - Asian
Median house or condo value ($) - Hispanic or Latino
Median house or condo value ($) - American Indian and Alaska Native
Median house or condo value ($) - Multirace
Median house or condo value ($) - Other Race
Median resident age
Resident age diversity
Median resident age - Males
Median resident age - Females
Median resident age - White
Median resident age - Black or African American
Median resident age - Asian
Median resident age - Hispanic or Latino
Median resident age - American Indian and Alaska Native
Median resident age - Multirace
Median resident age - Other Race
Median resident age - Males - White
Median resident age - Males - Black or African American
Median resident age - Males - Asian
Median resident age - Males - Hispanic or Latino
Median resident age - Males - American Indian and Alaska Native
Median resident age - Males - Multirace
Median resident age - Males - Other Race
Median resident age - Females - White
Median resident age - Females - Black or African American
Median resident age - Females - Asian
Median resident age - Females - Hispanic or Latino
Median resident age - Females - American Indian and Alaska Native
Median resident age - Females - Multirace
Median resident age - Females - Other Race
Commute - mean travel time to work (minutes)
Travel time to work - Less than 5 minutes (%)
Travel time to work - Less than 5 minutes (% change since 2000)
Travel time to work - 5 to 9 minutes (%)
Travel time to work - 5 to 9 minutes (% change since 2000)
Travel time to work - 10 to 19 minutes (%)
Travel time to work - 10 to 19 minutes (% change since 2000)
Travel time to work - 20 to 29 minutes (%)
Travel time to work - 20 to 29 minutes (% change since 2000)
Travel time to work - 30 to 39 minutes (%)
Travel time to work - 30 to 39 minutes (% change since 2000)
Travel time to work - 40 to 59 minutes (%)
Travel time to work - 40 to 59 minutes (% change since 2000)
Travel time to work - 60 to 89 minutes (%)
Travel time to work - 60 to 89 minutes (% change since 2000)
Travel time to work - 90 or more minutes (%)
Travel time to work - 90 or more minutes (% change since 2000)
Marital status - Never married (%)
Marital status - Now married (%)
Marital status - Separated (%)
Marital status - Widowed (%)
Marital status - Divorced (%)
Median family income ($)
Median family income (% change since 2000)
Median non-family income ($)
Median non-family income (% change since 2000)
Median per capita income ($)
Median per capita income (% change since 2000)
Median family income ($) - White
Median family income ($) - Black or African American
Median family income ($) - Asian
Median family income ($) - Hispanic or Latino
Median family income ($) - American Indian and Alaska Native
Median family income ($) - Multirace
Median family income ($) - Other Race
Median year house/condo built
Median year apartment built
Year house built - Built 2005 or later (%)
Year house built - Built 2000 to 2004 (%)
Year house built - Built 1990 to 1999 (%)
Year house built - Built 1980 to 1989 (%)
Year house built - Built 1970 to 1979 (%)
Year house built - Built 1960 to 1969 (%)
Year house built - Built 1950 to 1959 (%)
Year house built - Built 1940 to 1949 (%)
Year house built - Built 1939 or earlier (%)
Average household size
Household density (households per square mile)
Average household size - White
Average household size - Black or African American
Average household size - Asian
Average household size - Hispanic or Latino
Average household size - American Indian and Alaska Native
Average household size - Multirace
Average household size - Other Race
Occupied housing units (%)
Vacant housing units (%)
Owner occupied housing units (%)
Renter occupied housing units (%)
Vacancy status - For rent (%)
Vacancy status - For sale only (%)
Vacancy status - Rented or sold, not occupied (%)
Vacancy status - For seasonal, recreational, or occasional use (%)
Vacancy status - For migrant workers (%)
Vacancy status - Other vacant (%)
Residents with income below the poverty level (%)
Residents with income below 50% of the poverty level (%)
Children below poverty level (%)
Poor families by family type - Married-couple family (%)
Poor families by family type - Male, no wife present (%)
Poor families by family type - Female, no husband present (%)
Poverty status for native-born residents (%)
Poverty status for foreign-born residents (%)
Poverty among high school graduates not in families (%)
Poverty among people who did not graduate high school not in families (%)
Residents with income below the poverty level (%) - White
Residents with income below the poverty level (%) - Black or African American
Residents with income below the poverty level (%) - Asian
Residents with income below the poverty level (%) - Hispanic or Latino
Residents with income below the poverty level (%) - American Indian and Alaska Native
Residents with income below the poverty level (%) - Multirace
Residents with income below the poverty level (%) - Other Race
Air pollution - Air Quality Index (AQI)
Air pollution - CO
Air pollution - NO2
Air pollution - SO2
Air pollution - Ozone
Air pollution - PM10
Air pollution - PM25
Air pollution - Pb
Crime - Murders per 100,000 population
Crime - Rapes per 100,000 population
Crime - Robberies per 100,000 population
Crime - Assaults per 100,000 population
Crime - Burglaries per 100,000 population
Crime - Thefts per 100,000 population
Crime - Auto thefts per 100,000 population
Crime - Arson per 100,000 population
Crime - City-data.com crime index
Crime - Violent crime index
Crime - Property crime index
Crime - Murders per 100,000 population (5 year average)
Crime - Rapes per 100,000 population (5 year average)
Crime - Robberies per 100,000 population (5 year average)
Crime - Assaults per 100,000 population (5 year average)
Crime - Burglaries per 100,000 population (5 year average)
Crime - Thefts per 100,000 population (5 year average)
Crime - Auto thefts per 100,000 population (5 year average)
Crime - Arson per 100,000 population (5 year average)
Crime - City-data.com crime index (5 year average)
Crime - Violent crime index (5 year average)
Crime - Property crime index (5 year average)
1996 Presidential Elections Results (%) - Democratic Party (Clinton)
1996 Presidential Elections Results (%) - Republican Party (Dole)
1996 Presidential Elections Results (%) - Other
2000 Presidential Elections Results (%) - Democratic Party (Gore)
2000 Presidential Elections Results (%) - Republican Party (Bush)
2000 Presidential Elections Results (%) - Other
2004 Presidential Elections Results (%) - Democratic Party (Kerry)
2004 Presidential Elections Results (%) - Republican Party (Bush)
2004 Presidential Elections Results (%) - Other
2008 Presidential Elections Results (%) - Democratic Party (Obama)
2008 Presidential Elections Results (%) - Republican Party (McCain)
2008 Presidential Elections Results (%) - Other
2012 Presidential Elections Results (%) - Democratic Party (Obama)
2012 Presidential Elections Results (%) - Republican Party (Romney)
2012 Presidential Elections Results (%) - Other
2016 Presidential Elections Results (%) - Democratic Party (Clinton)
2016 Presidential Elections Results (%) - Republican Party (Trump)
2016 Presidential Elections Results (%) - Other
2020 Presidential Elections Results (%) - Democratic Party (Biden)
2020 Presidential Elections Results (%) - Republican Party (Trump)
2020 Presidential Elections Results (%) - Other
Ancestries Reported - Arab (%)
Ancestries Reported - Czech (%)
Ancestries Reported - Danish (%)
Ancestries Reported - Dutch (%)
Ancestries Reported - English (%)
Ancestries Reported - French (%)
Ancestries Reported - French Canadian (%)
Ancestries Reported - German (%)
Ancestries Reported - Greek (%)
Ancestries Reported - Hungarian (%)
Ancestries Reported - Irish (%)
Ancestries Reported - Italian (%)
Ancestries Reported - Lithuanian (%)
Ancestries Reported - Norwegian (%)
Ancestries Reported - Polish (%)
Ancestries Reported - Portuguese (%)
Ancestries Reported - Russian (%)
Ancestries Reported - Scotch-Irish (%)
Ancestries Reported - Scottish (%)
Ancestries Reported - Slovak (%)
Ancestries Reported - Subsaharan African (%)
Ancestries Reported - Swedish (%)
Ancestries Reported - Swiss (%)
Ancestries Reported - Ukrainian (%)
Ancestries Reported - United States (%)
Ancestries Reported - Welsh (%)
Ancestries Reported - West Indian (%)
Ancestries Reported - Other (%)
Educational Attainment - No schooling completed (%)
Educational Attainment - Less than high school (%)
Educational Attainment - High school or equivalent (%)
Educational Attainment - Less than 1 year of college (%)
Educational Attainment - 1 or more years of college (%)
Educational Attainment - Associate degree (%)
Educational Attainment - Bachelor's degree (%)
Educational Attainment - Master's degree (%)
Educational Attainment - Professional school degree (%)
Educational Attainment - Doctorate degree (%)
School Enrollment - Nursery, preschool (%)
School Enrollment - Kindergarten (%)
School Enrollment - Grade 1 to 4 (%)
School Enrollment - Grade 5 to 8 (%)
School Enrollment - Grade 9 to 12 (%)
School Enrollment - College undergrad (%)
School Enrollment - Graduate or professional (%)
School Enrollment - Not enrolled in school (%)
School enrollment - Public schools (%)
School enrollment - Private schools (%)
School enrollment - Not enrolled (%)
Median number of rooms in houses and condos
Median number of rooms in apartments
Housing units lacking complete plumbing facilities (%)
Housing units lacking complete kitchen facilities (%)
Density of houses
Urban houses (%)
Rural houses (%)
Households with people 60 years and over (%)
Households with people 65 years and over (%)
Households with people 75 years and over (%)
Households with one or more nonrelatives (%)
Households with no nonrelatives (%)
Population in households (%)
Family households (%)
Nonfamily households (%)
Population in families (%)
Family households with own children (%)
Median number of bedrooms in owner occupied houses
Mean number of bedrooms in owner occupied houses
Median number of bedrooms in renter occupied houses
Mean number of bedrooms in renter occupied houses
Median number of vehichles in owner occupied houses
Mean number of vehichles in owner occupied houses
Median number of vehichles in renter occupied houses
Mean number of vehichles in renter occupied houses
Mortgage status - with mortgage (%)
Mortgage status - with second mortgage (%)
Mortgage status - with home equity loan (%)
Mortgage status - with both second mortgage and home equity loan (%)
Mortgage status - without a mortgage (%)
Average family size
Average family size - White
Average family size - Black or African American
Average family size - Asian
Average family size - Hispanic or Latino
Average family size - American Indian and Alaska Native
Average family size - Multirace
Average family size - Other Race
Geographical mobility - Same house 1 year ago (%)
Geographical mobility - Moved within same county (%)
Geographical mobility - Moved from different county within same state (%)
Geographical mobility - Moved from different state (%)
Geographical mobility - Moved from abroad (%)
Place of birth - Born in state of residence (%)
Place of birth - Born in other state (%)
Place of birth - Native, outside of US (%)
Place of birth - Foreign born (%)
Housing units in structures - 1, detached (%)
Housing units in structures - 1, attached (%)
Housing units in structures - 2 (%)
Housing units in structures - 3 or 4 (%)
Housing units in structures - 5 to 9 (%)
Housing units in structures - 10 to 19 (%)
Housing units in structures - 20 to 49 (%)
Housing units in structures - 50 or more (%)
Housing units in structures - Mobile home (%)
Housing units in structures - Boat, RV, van, etc. (%)
House/condo owner moved in on average (years ago)
Renter moved in on average (years ago)
Year householder moved into unit - Moved in 1999 to March 2000 (%)
Year householder moved into unit - Moved in 1995 to 1998 (%)
Year householder moved into unit - Moved in 1990 to 1994 (%)
Year householder moved into unit - Moved in 1980 to 1989 (%)
Year householder moved into unit - Moved in 1970 to 1979 (%)
Year householder moved into unit - Moved in 1969 or earlier (%)
Means of transportation to work - Drove car alone (%)
Means of transportation to work - Carpooled (%)
Means of transportation to work - Public transportation (%)
Means of transportation to work - Bus or trolley bus (%)
Means of transportation to work - Streetcar or trolley car (%)
Means of transportation to work - Subway or elevated (%)
Means of transportation to work - Railroad (%)
Means of transportation to work - Ferryboat (%)
Means of transportation to work - Taxicab (%)
Means of transportation to work - Motorcycle (%)
Means of transportation to work - Bicycle (%)
Means of transportation to work - Walked (%)
Means of transportation to work - Other means (%)
Working at home (%)
Industry diversity
Most Common Industries - Agriculture, forestry, fishing and hunting, and mining (%)
Most Common Industries - Agriculture, forestry, fishing and hunting (%)
Most Common Industries - Mining, quarrying, and oil and gas extraction (%)
Most Common Industries - Construction (%)
Most Common Industries - Manufacturing (%)
Most Common Industries - Wholesale trade (%)
Most Common Industries - Retail trade (%)
Most Common Industries - Transportation and warehousing, and utilities (%)
Most Common Industries - Transportation and warehousing (%)
Most Common Industries - Utilities (%)
Most Common Industries - Information (%)
Most Common Industries - Finance and insurance, and real estate and rental and leasing (%)
Most Common Industries - Finance and insurance (%)
Most Common Industries - Real estate and rental and leasing (%)
Most Common Industries - Professional, scientific, and management, and administrative and waste management services (%)
Most Common Industries - Professional, scientific, and technical services (%)
Most Common Industries - Management of companies and enterprises (%)
Most Common Industries - Administrative and support and waste management services (%)
Most Common Industries - Educational services, and health care and social assistance (%)
Most Common Industries - Educational services (%)
Most Common Industries - Health care and social assistance (%)
Most Common Industries - Arts, entertainment, and recreation, and accommodation and food services (%)
Most Common Industries - Arts, entertainment, and recreation (%)
Most Common Industries - Accommodation and food services (%)
Most Common Industries - Other services, except public administration (%)
Most Common Industries - Public administration (%)
Occupation diversity
Most Common Occupations - Management, business, science, and arts occupations (%)
Most Common Occupations - Management, business, and financial occupations (%)
Most Common Occupations - Management occupations (%)
Most Common Occupations - Business and financial operations occupations (%)
Most Common Occupations - Computer, engineering, and science occupations (%)
Most Common Occupations - Computer and mathematical occupations (%)
Most Common Occupations - Architecture and engineering occupations (%)
Most Common Occupations - Life, physical, and social science occupations (%)
Most Common Occupations - Education, legal, community service, arts, and media occupations (%)
Most Common Occupations - Community and social service occupations (%)
Most Common Occupations - Legal occupations (%)
Most Common Occupations - Education, training, and library occupations (%)
Most Common Occupations - Arts, design, entertainment, sports, and media occupations (%)
Most Common Occupations - Healthcare practitioners and technical occupations (%)
Most Common Occupations - Health diagnosing and treating practitioners and other technical occupations (%)
Most Common Occupations - Health technologists and technicians (%)
Most Common Occupations - Service occupations (%)
Most Common Occupations - Healthcare support occupations (%)
Most Common Occupations - Protective service occupations (%)
Most Common Occupations - Fire fighting and prevention, and other protective service workers including supervisors (%)
Most Common Occupations - Law enforcement workers including supervisors (%)
Most Common Occupations - Food preparation and serving related occupations (%)
Most Common Occupations - Building and grounds cleaning and maintenance occupations (%)
Most Common Occupations - Personal care and service occupations (%)
Most Common Occupations - Sales and office occupations (%)
Most Common Occupations - Sales and related occupations (%)
Most Common Occupations - Office and administrative support occupations (%)
Most Common Occupations - Natural resources, construction, and maintenance occupations (%)
Most Common Occupations - Farming, fishing, and forestry occupations (%)
Most Common Occupations - Construction and extraction occupations (%)
Most Common Occupations - Installation, maintenance, and repair occupations (%)
Most Common Occupations - Production, transportation, and material moving occupations (%)
Most Common Occupations - Production occupations (%)
Most Common Occupations - Transportation occupations (%)
Most Common Occupations - Material moving occupations (%)
People in Group quarters - Institutionalized population (%)
People in Group quarters - Correctional institutions (%)
People in Group quarters - Federal prisons and detention centers (%)
People in Group quarters - Halfway houses (%)
People in Group quarters - Local jails and other confinement facilities (including police lockups) (%)
People in Group quarters - Military disciplinary barracks (%)
People in Group quarters - State prisons (%)
People in Group quarters - Other types of correctional institutions (%)
People in Group quarters - Nursing homes (%)
People in Group quarters - Hospitals/wards, hospices, and schools for the handicapped (%)
People in Group quarters - Hospitals/wards and hospices for chronically ill (%)
People in Group quarters - Hospices or homes for chronically ill (%)
People in Group quarters - Military hospitals or wards for chronically ill (%)
People in Group quarters - Other hospitals or wards for chronically ill (%)
People in Group quarters - Hospitals or wards for drug/alcohol abuse (%)
People in Group quarters - Mental (Psychiatric) hospitals or wards (%)
People in Group quarters - Schools, hospitals, or wards for the mentally retarded (%)
People in Group quarters - Schools, hospitals, or wards for the physically handicapped (%)
People in Group quarters - Institutions for the deaf (%)
People in Group quarters - Institutions for the blind (%)
People in Group quarters - Orthopedic wards and institutions for the physically handicapped (%)
People in Group quarters - Wards in general hospitals for patients who have no usual home elsewhere (%)
People in Group quarters - Wards in military hospitals for patients who have no usual home elsewhere (%)
People in Group quarters - Juvenile institutions (%)
People in Group quarters - Long-term care (%)
People in Group quarters - Homes for abused, dependent, and neglected children (%)
People in Group quarters - Residential treatment centers for emotionally disturbed children (%)
People in Group quarters - Training schools for juvenile delinquents (%)
People in Group quarters - Short-term care, detention or diagnostic centers for delinquent children (%)
People in Group quarters - Type of juvenile institution unknown (%)
People in Group quarters - Noninstitutionalized population (%)
People in Group quarters - College dormitories (includes college quarters off campus) (%)
People in Group quarters - Military quarters (%)
People in Group quarters - On base (%)
People in Group quarters - Barracks, unaccompanied personnel housing (UPH), (Enlisted/Officer), ;and similar group living quarters for military personnel (%)
People in Group quarters - Transient quarters for temporary residents (%)
People in Group quarters - Military ships (%)
People in Group quarters - Group homes (%)
People in Group quarters - Homes or halfway houses for drug/alcohol abuse (%)
People in Group quarters - Homes for the mentally ill (%)
People in Group quarters - Homes for the mentally retarded (%)
People in Group quarters - Homes for the physically handicapped (%)
People in Group quarters - Other group homes (%)
People in Group quarters - Religious group quarters (%)
People in Group quarters - Dormitories (%)
People in Group quarters - Agriculture workers' dormitories on farms (%)
People in Group quarters - Job Corps and vocational training facilities (%)
People in Group quarters - Other workers' dormitories (%)
People in Group quarters - Crews of maritime vessels (%)
People in Group quarters - Other nonhousehold living situations (%)
People in Group quarters - Other noninstitutional group quarters (%)
Residents speaking English at home (%)
Residents speaking English at home - Born in the United States (%)
Residents speaking English at home - Native, born elsewhere (%)
Residents speaking English at home - Foreign born (%)
Residents speaking Spanish at home (%)
Residents speaking Spanish at home - Born in the United States (%)
Residents speaking Spanish at home - Native, born elsewhere (%)
Residents speaking Spanish at home - Foreign born (%)
Residents speaking other language at home (%)
Residents speaking other language at home - Born in the United States (%)
Residents speaking other language at home - Native, born elsewhere (%)
Residents speaking other language at home - Foreign born (%)
Class of Workers - Employee of private company (%)
Class of Workers - Self-employed in own incorporated business (%)
Class of Workers - Private not-for-profit wage and salary workers (%)
Class of Workers - Local government workers (%)
Class of Workers - State government workers (%)
Class of Workers - Federal government workers (%)
Class of Workers - Self-employed workers in own not incorporated business and Unpaid family workers (%)
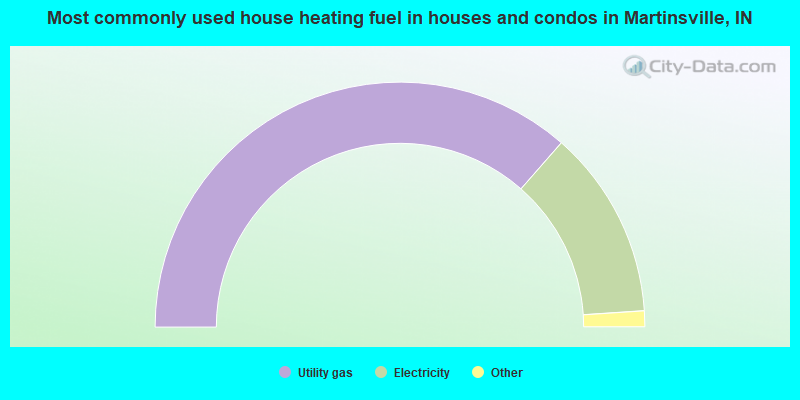
House heating fuel used in houses and condos - Utility gas (%)
House heating fuel used in houses and condos - Bottled, tank, or LP gas (%)
House heating fuel used in houses and condos - Electricity (%)
House heating fuel used in houses and condos - Fuel oil, kerosene, etc. (%)
House heating fuel used in houses and condos - Coal or coke (%)
House heating fuel used in houses and condos - Wood (%)
House heating fuel used in houses and condos - Solar energy (%)
House heating fuel used in houses and condos - Other fuel (%)
House heating fuel used in houses and condos - No fuel used (%)
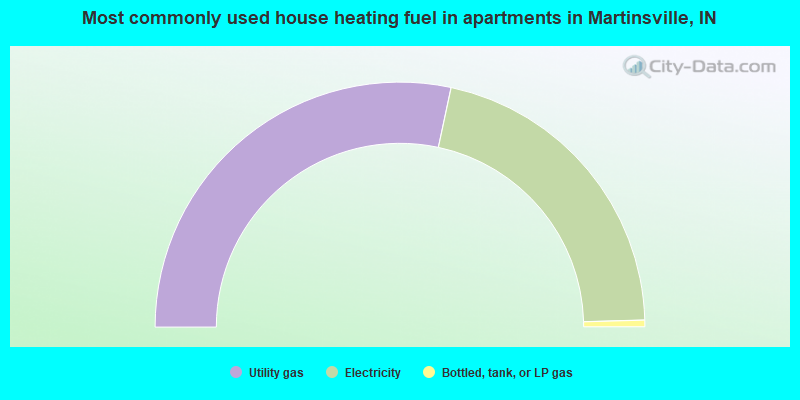
House heating fuel used in apartments - Utility gas (%)
House heating fuel used in apartments - Bottled, tank, or LP gas (%)
House heating fuel used in apartments - Electricity (%)
House heating fuel used in apartments - Fuel oil, kerosene, etc. (%)
House heating fuel used in apartments - Coal or coke (%)
House heating fuel used in apartments - Wood (%)
House heating fuel used in apartments - Solar energy (%)
House heating fuel used in apartments - Other fuel (%)
House heating fuel used in apartments - No fuel used (%)
Armed forces status - In Armed Forces (%)
Armed forces status - Civilian (%)
Armed forces status - Civilian - Veteran (%)
Armed forces status - Civilian - Nonveteran (%)
Fatal accidents locations in years 2005-2021
Fatal accidents locations in 2005
Fatal accidents locations in 2006
Fatal accidents locations in 2007
Fatal accidents locations in 2008
Fatal accidents locations in 2009
Fatal accidents locations in 2010
Fatal accidents locations in 2011
Fatal accidents locations in 2012
Fatal accidents locations in 2013
Fatal accidents locations in 2014
Fatal accidents locations in 2015
Fatal accidents locations in 2016
Fatal accidents locations in 2017
Fatal accidents locations in 2018
Fatal accidents locations in 2019
Fatal accidents locations in 2020
Fatal accidents locations in 2021
Alcohol use - People drinking some alcohol every month (%)
Alcohol use - People not drinking at all (%)
Alcohol use - Average days/month drinking alcohol
Alcohol use - Average drinks/week
Alcohol use - Average days/year people drink much
Audiometry - Average condition of hearing (%)
Audiometry - People that can hear a whisper from across a quiet room (%)
Audiometry - People that can hear normal voice from across a quiet room (%)
Audiometry - Ears ringing, roaring, buzzing (%)
Audiometry - Had a job exposure to loud noise (%)
Audiometry - Had off-work exposure to loud noise (%)
Blood Pressure & Cholesterol - Has high blood pressure (%)
Blood Pressure & Cholesterol - Checking blood pressure at home (%)
Blood Pressure & Cholesterol - Frequently checking blood cholesterol (%)
Blood Pressure & Cholesterol - Has high cholesterol level (%)
Consumer Behavior - Money monthly spent on food at supermarket/grocery store
Consumer Behavior - Money monthly spent on food at other stores
Consumer Behavior - Money monthly spent on eating out
Consumer Behavior - Money monthly spent on carryout/delivered foods
Consumer Behavior - Income spent on food at supermarket/grocery store (%)
Consumer Behavior - Income spent on food at other stores (%)
Consumer Behavior - Income spent on eating out (%)
Consumer Behavior - Income spent on carryout/delivered foods (%)
Current Health Status - General health condition (%)
Current Health Status - Blood donors (%)
Current Health Status - Has blood ever tested for HIV virus (%)
Current Health Status - Left-handed people (%)
Dermatology - People using sunscreen (%)
Diabetes - Diabetics (%)
Diabetes - Had a blood test for high blood sugar (%)
Diabetes - People taking insulin (%)
Diet Behavior & Nutrition - Diet health (%)
Diet Behavior & Nutrition - Milk product consumption (# of products/month)
Diet Behavior & Nutrition - Meals not home prepared (#/week)
Diet Behavior & Nutrition - Meals from fast food or pizza place (#/week)
Diet Behavior & Nutrition - Ready-to-eat foods (#/month)
Diet Behavior & Nutrition - Frozen meals/pizza (#/month)
Drug Use - People that ever used marijuana or hashish (%)
Drug Use - Ever used hard drugs (%)
Drug Use - Ever used any form of cocaine (%)
Drug Use - Ever used heroin (%)
Drug Use - Ever used methamphetamine (%)
Health Insurance - People covered by health insurance (%)
Kidney Conditions-Urology - Avg. # of times urinating at night
Medical Conditions - People with asthma (%)
Medical Conditions - People with anemia (%)
Medical Conditions - People with psoriasis (%)
Medical Conditions - People with overweight (%)
Medical Conditions - Elderly people having difficulties in thinking or remembering (%)
Medical Conditions - People who ever received blood transfusion (%)
Medical Conditions - People having trouble seeing even with glass/contacts (%)
Medical Conditions - People with arthritis (%)
Medical Conditions - People with gout (%)
Medical Conditions - People with congestive heart failure (%)
Medical Conditions - People with coronary heart disease (%)
Medical Conditions - People with angina pectoris (%)
Medical Conditions - People who ever had heart attack (%)
Medical Conditions - People who ever had stroke (%)
Medical Conditions - People with emphysema (%)
Medical Conditions - People with thyroid problem (%)
Medical Conditions - People with chronic bronchitis (%)
Medical Conditions - People with any liver condition (%)
Medical Conditions - People who ever had cancer or malignancy (%)
Mental Health - People who have little interest in doing things (%)
Mental Health - People feeling down, depressed, or hopeless (%)
Mental Health - People who have trouble sleeping or sleeping too much (%)
Mental Health - People feeling tired or having little energy (%)
Mental Health - People with poor appetite or overeating (%)
Mental Health - People feeling bad about themself (%)
Mental Health - People who have trouble concentrating on things (%)
Mental Health - People moving or speaking slowly or too fast (%)
Mental Health - People having thoughts they would be better off dead (%)
Oral Health - Average years since last visit a dentist
Oral Health - People embarrassed because of mouth (%)
Oral Health - People with gum disease (%)
Oral Health - General health of teeth and gums (%)
Oral Health - Average days a week using dental floss/device
Oral Health - Average days a week using mouthwash for dental problem
Oral Health - Average number of teeth
Pesticide Use - Households using pesticides to control insects (%)
Pesticide Use - Households using pesticides to kill weeds (%)
Physical Activity - People doing vigorous-intensity work activities (%)
Physical Activity - People doing moderate-intensity work activities (%)
Physical Activity - People walking or bicycling (%)
Physical Activity - People doing vigorous-intensity recreational activities (%)
Physical Activity - People doing moderate-intensity recreational activities (%)
Physical Activity - Average hours a day doing sedentary activities
Physical Activity - Average hours a day watching TV or videos
Physical Activity - Average hours a day using computer
Physical Functioning - People having limitations keeping them from working (%)
Physical Functioning - People limited in amount of work they can do (%)
Physical Functioning - People that need special equipment to walk (%)
Physical Functioning - People experiencing confusion/memory problems (%)
Physical Functioning - People requiring special healthcare equipment (%)
Prescription Medications - Average number of prescription medicines taking
Preventive Aspirin Use - Adults 40+ taking low-dose aspirin (%)
Reproductive Health - Vaginal deliveries (%)
Reproductive Health - Cesarean deliveries (%)
Reproductive Health - Deliveries resulted in a live birth (%)
Reproductive Health - Pregnancies resulted in a delivery (%)
Reproductive Health - Women breastfeeding newborns (%)
Reproductive Health - Women that had a hysterectomy (%)
Reproductive Health - Women that had both ovaries removed (%)
Reproductive Health - Women that have ever taken birth control pills (%)
Reproductive Health - Women taking birth control pills (%)
Reproductive Health - Women that have ever used Depo-Provera or injectables (%)
Reproductive Health - Women that have ever used female hormones (%)
Sexual Behavior - People 18+ that ever had sex (vaginal, anal, or oral) (%)
Sexual Behavior - Males 18+ that ever had vaginal sex with a woman (%)
Sexual Behavior - Males 18+ that ever performed oral sex on a woman (%)
Sexual Behavior - Males 18+ that ever had anal sex with a woman (%)
Sexual Behavior - Males 18+ that ever had any sex with a man (%)
Sexual Behavior - Females 18+ that ever had vaginal sex with a man (%)
Sexual Behavior - Females 18+ that ever performed oral sex on a man (%)
Sexual Behavior - Females 18+ that ever had anal sex with a man (%)
Sexual Behavior - Females 18+ that ever had any kind of sex with a woman (%)
Sexual Behavior - Average age people first had sex
Sexual Behavior - Average number of female sex partners in lifetime (males 18+)
Sexual Behavior - Average number of female vaginal sex partners in lifetime (males 18+)
Sexual Behavior - Average age people first performed oral sex on a woman (18+)
Sexual Behavior - Average number of woman performed oral sex on in lifetime (18+)
Sexual Behavior - Average number of male sex partners in lifetime (males 18+)
Sexual Behavior - Average number of male anal sex partners in lifetime (males 18+)
Sexual Behavior - Average age people first performed oral sex on a man (18+)
Sexual Behavior - Average number of male oral sex partners in lifetime (18+)
Sexual Behavior - People using protection when performing oral sex (%)
Sexual Behavior - Average number of times people have vaginal or anal sex a year
Sexual Behavior - People having sex without condom (%)
Sexual Behavior - Average number of male sex partners in lifetime (females 18+)
Sexual Behavior - Average number of male vaginal sex partners in lifetime (females 18+)
Sexual Behavior - Average number of female sex partners in lifetime (females 18+)
Sexual Behavior - Circumcised males 18+ (%)
Sleep Disorders - Average hours sleeping at night
Sleep Disorders - People that has trouble sleeping (%)
Smoking-Cigarette Use - People smoking cigarettes (%)
Taste & Smell - People 40+ having problems with smell (%)
Taste & Smell - People 40+ having problems with taste (%)
Taste & Smell - People 40+ that ever had wisdom teeth removed (%)
Taste & Smell - People 40+ that ever had tonsils teeth removed (%)
Taste & Smell - People 40+ that ever had a loss of consciousness because of a head injury (%)
Taste & Smell - People 40+ that ever had a broken nose or other serious injury to face or skull (%)
Taste & Smell - People 40+ that ever had two or more sinus infections (%)
Weight - Average height (inches)
Weight - Average weight (pounds)
Weight - Average BMI
Weight - People that are obese (%)
Weight - People that ever were obese (%)
Weight - People trying to lose weight (%)
According to our research of Indiana and other state lists, there were 5 registered sex offenders living in Martinsville, Indiana as of May 26, 2024 . The ratio of all residents to sex offenders in Martinsville is 2,358 to 1.The ratio of registered sex offenders to all residents in this city is much lower than the state average.
Officers per 1,000 residents here:
1.93Indiana average:
1.75
Latest news from Martinsville, IN collected exclusively by city-data.com from local newspapers, TV, and radio stations
Ancestries: American (27.3%), Irish (15.2%), English (11.7%), German (11.3%), European (9.5%), Italian (1.4%).
Current Local Time:
Land area: 4.46 square miles.
Population density: 2,656 people per square mile (average).
172 residents are foreign born
This city:
1.4%Indiana:
5.6%
Median real estate property taxes paid for housing units with mortgages in 2022: $880 (0.5%)Median real estate property taxes paid for housing units with no mortgage in 2022: $688 (0.6%)
Nearest city with pop. 50,000+: Bloomington, IN
Nearest city with pop. 200,000+: Indianapolis, IN
Nearest city with pop. 1,000,000+: Chicago, IL
Nearest cities:
Bethany, IN (2.8 miles),
Latitude: 39.42 N, Longitude: 86.42 W
Daytime population change due to commuting: +405 (+3.4%)Workers who live and work in this city: 2,536 (45.6%)
Single-family new house construction building permits:
2022: 25 buildings , average cost: $285,5002021: 28 buildings , average cost: $278,0002020: 44 buildings , average cost: $171,8002019: 11 buildings , average cost: $210,4002018: 8 buildings , average cost: $219,7002017: 20 buildings , average cost: $257,8002016: 7 buildings , average cost: $235,6002015: 6 buildings , average cost: $178,6002014: 1 building , cost: $120,0002013: 7 buildings , average cost: $168,6002012: 2 buildings , average cost: $152,5002011: 3 buildings , average cost: $182,4002010: 4 buildings , average cost: $186,3002009: 7 buildings , average cost: $147,9002008: 7 buildings , average cost: $125,0002007: 10 buildings , average cost: $164,3002006: 22 buildings , average cost: $110,0002005: 30 buildings , average cost: $129,5002004: 34 buildings , average cost: $117,7002003: 54 buildings , average cost: $130,2002002: 48 buildings , average cost: $110,3002001: 49 buildings , average cost: $87,5002000: 32 buildings , average cost: $90,9001999: 19 buildings , average cost: $85,3001998: 31 buildings , average cost: $96,7001997: 25 buildings , average cost: $95,400Unemployment in December 2023:
Population change in the 1990s: +78 (+0.7%).
Most common occupations in Martinsville, IN (%)
Both Males Females
Building and grounds cleaning and maintenance occupations (4.2%)
Other sales and related occupations, including supervisors (4.1%)
Laborers and material movers, hand (3.8%)
Driver/sales workers and truck drivers (3.7%)
Assemblers and fabricators (3.7%)
Electrical equipment mechanics and other installation, maintenance, and repair workers, including supervisors (3.5%)
Cashiers (3.5%)
Driver/sales workers and truck drivers (6.6%)
Electrical equipment mechanics and other installation, maintenance, and repair workers, including supervisors (6.2%)
Construction traders workers except carpenters, electricians, painters, plumbers, and construction laborers (6.1%)
Metal workers and plastic workers (5.6%)
Laborers and material movers, hand (5.2%)
Vehicle and mobile equipment mechanics, installers, and repairers (5.1%)
Construction laborers (4.7%)
Cashiers (7.6%)
Secretaries and administrative assistants (6.6%)
Other office and administrative support workers, including supervisors (6.1%)
Assemblers and fabricators (5.4%)
Other management occupations, except farmers and farm managers (4.7%)
Food and beverage serving workers, except waiters and waitresses (3.9%)
Building and grounds cleaning and maintenance occupations (3.7%)
Tornado activity:
Martinsville-area historical tornado activity is slightly above Indiana state average. It is 110% greater than the overall U.S. average.
On 11/22/1992, a category F3 (max. wind speeds 158-206 mph) tornado 5.4 miles away from the Martinsville city center caused between $500,000 and $5,000,000 in damages.
On 5/14/1972, a category F4 (max. wind speeds 207-260 mph) tornado 30.2 miles away from the city center injured 20 people and caused between $50,000 and $500,000 in damages.
Earthquake activity:
Martinsville-area historical earthquake activity is significantly above Indiana state average. It is 101% greater than the overall U.S. average. On 4/18/2008 at 09:36:59, a magnitude 5.4 (5.1 MB, 4.8 MS, 5.4 MW, 5.2 MW, Class: Moderate, Intensity: VI - VII) earthquake occurred 103.5 miles away from the city center On 4/18/2008 at 09:36:59, a magnitude 5.2 (5.2 MW, Depth: 8.9 mi) earthquake occurred 103.5 miles away from the city center On 6/10/1987 at 23:48:54, a magnitude 5.1 (4.9 MB, 4.4 MS, 4.6 MS, 5.1 LG) earthquake occurred 88.8 miles away from the city center On 7/27/1980 at 18:52:21, a magnitude 5.2 (5.1 MB, 4.7 MS, 5.0 UK, 5.2 UK) earthquake occurred 158.0 miles away from Martinsville center On 6/18/2002 at 17:37:15, a magnitude 5.0 (4.3 MB, 4.6 MW, 5.0 LG) earthquake occurred 123.4 miles away from Martinsville center On 4/18/2008 at 15:14:16, a magnitude 4.8 (4.5 MB, 4.8 MW, 4.6 MW, Class: Light, Intensity: IV - V) earthquake occurred 100.8 miles away from Martinsville center Magnitude types: regional Lg-wave magnitude (LG), body-wave magnitude (MB), surface-wave magnitude (MS), moment magnitude (MW) Natural disasters: The number of natural disasters in Morgan County (14) is near the US average (15).Major Disasters (Presidential) Declared: 10Emergencies Declared: 3Floods: 7, Storms: 7, Tornadoes: 4, Winter Storms: 3, Blizzard: 1, Hurricane: 1, Snow: 1, Snowstorm: 1, Other: 1 (Note: some incidents may be assigned to more than one category). Hospitals in Martinsville: INDIANA UNIVERSITY HEALTH MORGAN HOSPITAL INC (Voluntary non-profit - Private, 2209 JOHN R WOODEN DR) TRANSITIONAL SERVICES INC (110 W PIKE ST) Nursing Homes in Martinsville: GRANDVIEW CONVALESCENT CENTER (1959 EAST COLUMBUS STREET) GRANDVIEW HEALTH AND REHABILITATION CENTER (1959 E COLUMBUS ST) GRANDVIEW LIVING CENTER (2009 EAST COLUMBUS STREET) HERITAGE HOUSE CONVALESCENT CENTER,THE (2055 HERITAGE DRIVE) MORGAN COUNTY MEMORIAL HOSPITAL TCU (2209 JOHN R WOODEN DR) NBA KENNEDY LIVING CENTER (301 W HARRISON ST) WATERS OF MARTINSVILLE THE (2055 HERITAGE DR) Dialysis Facilities in Martinsville: FMC - MORGAN COUNTY (2200 JOHN WOODEN DR SUITE 106) Home Health Centers in Martinsville: HERITAGE HOME HEALTH SERVICES LLC (801 PLAZA DR STE A) Colleges/universities with over 2000 students nearest to Martinsville:
Indiana University-Bloomington (about 19 miles; Bloomington, IN ; Full-time enrollment: 39,039)
University of Indianapolis (about 26 miles; Indianapolis, IN ; FT enrollment: 4,625)
Indiana University-Purdue University-Indianapolis (about 28 miles; Indianapolis, IN ; FT enrollment: 22,751)
American College of Education (about 28 miles; Indianapolis, IN ; FT enrollment: 2,718)
DePauw University (about 28 miles; Greencastle, IN ; FT enrollment: 2,360)
Harrison College-Indianapolis (about 28 miles; Indianapolis, IN ; FT enrollment: 4,244)
Marian University (about 30 miles; Indianapolis, IN ; FT enrollment: 2,476)
Public high school in Martinsville:
Private high school in Martinsville:
Public elementary/middle schools in Martinsville: MARTINSVILLE WEST MIDDLE SCH Students: 619, Location: 109 E GARFIELD ST, Grades: 6-8)SOUTH ELEMENTARY SCH Students: 470, Location: 500 E MAHALASVILLE RD, Grades: KG-5)POSTON ROAD ELEMENTARY SCHOOL Students: 420, Location: 139 E POSTON RD, Grades: KG-5)WAVERLY ELEMENTARY SCHOOL Students: 346, Location: 8525 WAVERLY RD, Grades: PK-6)CHARLES L SMITH ELEM SCHOOL Students: 335, Location: 1359 E COLUMBUS ST, Grades: PK-5)GREEN TOWNSHIP ELEM SCH Students: 296, Location: 6275 MAPLE GROVE RD, Grades: KG-5)CENTERTON ELEMENTARY SCHOOL Students: 246, Location: 6075 HIGH ST, Grades: KG-5)CENTRAL ELEMENTARY SCHOOL Location: 389 E JACKSON ST, Grades: KG-5)
RONALD K BELL EAST MIDDLE SCHOOL Location: 1459 E COLUMBUS ST, Grades: 6-8)
See full list of schools located in Martinsville Library in Martinsville: MORGAN COUNTY PUBLIC LIBRARY Operating income: $1,289,737; Location: 110 SOUTH JEFFERSON STREET; 169,749 books ; 10,104 audio materials ; 8,070 video materials ; 5 local licensed databases ; 37 state licensed databases ; 204 print serial subscriptions )
Notable locations in Martinsville: (A) , Martinsville Fire Station (B) , Martinsville Fire Department (C) . Display/hide their locations on the map
Church in Martinsville: (A) . Display/hide its location on the map
Cemetery: (1) . Display/hide its location on the map
Lake: (A) . Display/hide its location on the map
Tourist attraction:
Hotels:
Courts:
Birthplace of: Charles E. Ford - Film director, Craig Jarrett - Football player, T.J Wolf - College basketball player (Murray State Racers), Tim Dearlove - College basketball player (Wisc. Green Bay Phoenix).
Morgan County has a predicted average indoor radon screening level between 2 and 4 pCi/L (pico curies per liter) - Moderate Potential Drinking water stations with addresses in Martinsville and their reported violations in the past:
MARTINSVILLE WATER UTILITY (Population served: 15,000, Groundwater):
Past monitoring violations:
Follow-up Or Routine LCR Tap M/R - In OCT-01-2009, Contaminant: Lead and Copper Rule. Follow-up actions: St Public Notif requested (NOV-09-2009), St Violation/Reminder Notice (NOV-09-2009), St Compliance achieved (NOV-10-2009)
One regular monitoring violation
Population served: 8,637, Groundwater):
Past health violations:
MCL, Acute (TCR) - In MAY-2013, Contaminant: Coliform. Follow-up actions: St Public Notif requested (MAY-15-2013), St Violation/Reminder Notice (MAY-15-2013), St Boil Water Order (MAY-15-2013), St Compliance achieved (MAY-17-2013)
MCL, Monthly (TCR) - In OCT-2011, Contaminant: Coliform. Follow-up actions: St Boil Water Order (OCT-20-2011), St Public Notif requested (OCT-20-2011), St Violation/Reminder Notice (OCT-20-2011), St Public Notif received (NOV-03-2011), St Compliance achieved (MAR-14-2012)
Treatment Technique (SWTR and GWR) - In JUN-2010, Contaminant: GROUNDWATER RULE. Follow-up actions: St Public Notif requested (JUL-22-2010), St Violation/Reminder Notice (JUL-22-2010), St Public Notif received (AUG-03-2010), St Compliance achieved (FEB-01-2012)
MCL, Monthly (TCR) - In JUN-2009, Contaminant: Coliform. Follow-up actions: St Boil Water Order (JUN-26-2009), St Violation/Reminder Notice (JUN-26-2009), St Public Notif requested (JUN-26-2009), St Compliance achieved (2 times from MAY-17-2010 to SEP-30-2011)
Past monitoring violations:
One minor monitoring violation
One regular monitoring violation
Population served: 1,536, Groundwater):
Past monitoring violations:
One routine major monitoring violation
Average household size: This city:
2.5 peopleIndiana:
2.5 people
Percentage of family households: This city:
64.9%Whole state:
66.9%
Percentage of households with unmarried partners: This city:
8.5%Whole state:
6.9%
Likely homosexual households (counted as self-reported same-sex unmarried-partner households)
Lesbian couples: 0.5% of all households Gay men: 0.2% of all households
People in group quarters in Martinsville in 2010:
227 people in local jails and other municipal confinement facilities
149 people in nursing facilities/skilled-nursing facilities
56 people in emergency and transitional shelters (with sleeping facilities) for people experiencing homelessness
18 people in hospitals with patients who have no usual home elsewhere
8 people in mental (psychiatric) hospitals and psychiatric units in other hospitals
People in group quarters in Martinsville in 2000:
262 people in nursing homes
174 people in local jails and other confinement facilities (including police lockups)
23 people in other noninstitutional group quarters
22 people in wards in general hospitals for patients who have no usual home elsewhere
14 people in homes or halfway houses for drug/alcohol abuse
2 people in religious group quarters
Banks with branches in Martinsville (2011 data):
BMO Harris Bank National Association: Sycamore Street Martinsville In Bran, North Jefferson Branch, Plaza Branch. Info updated 2011/07/14: Bank assets: $97,264.0 mil, Deposits: $75,624.6 mil, headquarters in Chicago, IL, positive income , 717 total offices , Holding Company: Bank Of Montreal
Citizens Bank: East Morgan Branch, Morton Ave Branch, Artesian Square Branch. Info updated 2006/11/03: Bank assets: $356.0 mil, Deposits: $310.6 mil, headquarters in Mooresville, IN, positive income , 13 total offices , Holding Company: Citba Financial Corporation
Home Bank SB: Birk Road Branch at 670 Birk Road, branch established on 2007/06/20; Home Bank Sb at 59 West Washington Street, branch established on 1890/01/01. Info updated 2011/07/21: Bank assets: $233.0 mil, Deposits: $165.6 mil, local headquarters , positive income , Mortgage Lending Specialization, 3 total offices
KeyBank National Association: Martinsville Branch at 76 South Main Street, branch established on 1909/07/09. Info updated 2008/03/03: Bank assets: $86,198.8 mil, Deposits: $64,214.8 mil, headquarters in Cleveland, OH, positive income , Commercial Lending Specialization, 1067 total offices , Holding Company: Keycorp
Old National Bank: Martinsville/Walmart Branch at 410 Grand Valley Blvd., branch established on 2004/05/19. Info updated 2011/08/01: Bank assets: $8,467.9 mil, Deposits: $6,653.1 mil, headquarters in Evansville, IN, positive income , 195 total offices , Holding Company: Old National Bancorp
For population 15 years and over in Martinsville:
Never married: 27.5%Now married: 44.0%Separated: 1.0%Widowed: 9.6%Divorced: 17.8% For population 25 years and over in Martinsville:
High school or higher: 84.6%Bachelor's degree or higher: 13.0%Graduate or professional degree: 4.9%Unemployed: 3.4%Mean travel time to work (commute): 26.1 minutes
Education Gini index (Inequality in education) Here:
10.2Indiana average:
11.3
Religion statistics for Martinsville, IN (based on Morgan County data)
Religion Adherents Congregations Evangelical Protestant 15,772 72 Mainline Protestant 5,458 25 Catholic 3,003 2 Other 602 3 None 44,059 -
Source: Clifford Grammich, Kirk Hadaway, Richard Houseal, Dale E.Jones, Alexei Krindatch, Richie Stanley and Richard H.Taylor. 2012. 2010 U.S.Religion Census: Religious Congregations & Membership Study. Association of Statisticians of American Religious Bodies. Jones, Dale E., et al. 2002. Congregations and Membership in the United States 2000. Nashville, TN: Glenmary Research Center. Graphs represent county-level data
Food Environment Statistics: Number of grocery stores : 8Morgan County :
1.15 / 10,000 pop.State :
1.73 / 10,000 pop.
Number of convenience stores (no gas) : 2Morgan County :
0.29 / 10,000 pop.Indiana :
0.50 / 10,000 pop.
Number of convenience stores (with gas) : 30This county :
4.30 / 10,000 pop.State :
3.57 / 10,000 pop.
Number of full-service restaurants : 27Here :
3.87 / 10,000 pop.Indiana :
6.78 / 10,000 pop.
Adult diabetes rate : Morgan County :
8.9%Indiana :
9.2%
Adult obesity rate : Morgan County :
29.2%Indiana :
29.0%
Low-income preschool obesity rate : This county :
13.7%State :
14.3%
Health and Nutrition: Healthy diet rate : Martinsville:
51.0%State:
49.3%
Average overall health of teeth and gums : This city:
48.2%Indiana:
46.2%
Average BMI : This city:
28.4Indiana:
28.7
People feeling badly about themselves : This city:
18.2%Indiana:
21.3%
People not drinking alcohol at all : This city:
9.3%Indiana:
10.6%
Average hours sleeping at night : Martinsville:
6.8Indiana:
6.8
Overweight people : Martinsville:
34.4%State:
33.9%
General health condition : Martinsville:
57.6%Indiana:
56.1%
Average condition of hearing : Martinsville:
78.6%State:
78.7%
More about Health and Nutrition of Martinsville, IN Residents
Local government employment and payroll (March 2022)
Function
Full-time employees
Monthly full-time payroll
Average yearly full-time wage
Part-time employees
Monthly part-time payroll
Police Protection - Officers
29 $134,987 $55,857 0 $0 Firefighters
24 $106,673 $53,337 0 $0 Streets and Highways
12 $50,419 $50,419 0 $0 Water Supply
8 $38,524 $57,786 0 $0 Financial Administration
7 $29,273 $50,182 1 $1,125 Other Government Administration
6 $19,138 $38,276 9 $1,958 Sewerage
6 $29,479 $58,958 0 $0 Other and Unallocable
2 $8,126 $48,756 6 $5,712 Judicial and Legal
1 $3,891 $46,692 4 $5,855 Parks and Recreation
1 $4,170 $50,040 1 $2,146 Solid Waste Management
1 $5,742 $68,904 0 $0 Police - Other
0 $0 5 $5,274
Totals for Government
97 $430,422 $53,248 26 $22,070
Martinsville government finances - Expenditure in 2021 (per resident):
Construction - General - Other: $187,000 ($15.77)
Sewerage: $22,000 ($1.86)Current Operations - General - Other: $6,736,000 ($568.06)
Water Utilities: $3,257,000 ($274.67)Sewerage: $3,088,000 ($260.41)Police Protection: $3,067,000 ($258.64)Local Fire Protection: $2,513,000 ($211.92)Regular Highways: $2,170,000 ($183.00)Housing and Community Development: $1,782,000 ($150.28)Central Staff Services: $984,000 ($82.98)Parks and Recreation: $638,000 ($53.80)Financial Administration: $285,000 ($24.03)Protective Inspection and Regulation - Other: $256,000 ($21.59)Judicial and Legal Services: $176,000 ($14.84)Electric Utilities: $128,000 ($10.79)General Public Buildings: $99,000 ($8.35)General - Interest on Debt: $648,000 ($54.65)
Intergovernmental to Local - Other - Judicial and Legal Services: $75,000 ($6.32)
Martinsville government finances - Revenue in 2021 (per resident):
Charges - Sewerage: $5,269,000 ($444.34)
Other: $515,000 ($43.43)Parks and Recreation: $94,000 ($7.93)Local Intergovernmental - Highways: $206,000 ($17.37)
Miscellaneous - Rents: $157,000 ($13.24)
Donations From Private Sources: $19,000 ($1.60)Fines and Forfeits: $15,000 ($1.26)Revenue - Water Utilities: $16,692,000 ($1407.66)
State Intergovernmental - Highways: $1,250,000 ($105.41)
General Local Government Support: $503,000 ($42.42)Other: $487,000 ($41.07)Tax - Property: $5,834,000 ($491.99)
Other Selective Sales: $377,000 ($31.79)Public Utilities Sales: $110,000 ($9.28)Other License: $109,000 ($9.19)Occupation and Business License - Other: $8,000 ($0.67)
Martinsville government finances - Debt in 2021 (per resident):
Long Term Debt - Outstanding Unspecified Public Purpose: $16,201,000 ($1366.25)
Beginning Outstanding - Unspecified Public Purpose: $16,201,000 ($1366.25)
Martinsville government finances - Cash and Securities in 2021 (per resident):
Bond Funds - Cash and Securities: $6,970,000 ($587.79)
Other Funds - Cash and Securities: $12,720,000 ($1072.69)
Sinking Funds - Cash and Securities: $2,461,000 ($207.54)
Businesses in Martinsville, IN
Name Count Name Count
AT&T 1 Lane Furniture 1 Ace Hardware 1 Long John Silver's 1 Arby's 1 MasterBrand Cabinets 4 AutoZone 1 Maurices 1 Best Western 1 McDonald's 2 Burger King 1 Nike 1 CVS 1 Pizza Hut 1 Chevrolet 1 Sears 1 Circle K 4 Starbucks 1 Curves 1 Steak 'n Shake 1 Dairy Queen 2 Subway 1 FedEx 3 Super 8 1 Ford 1 Taco Bell 1 GNC 1 U-Haul 4 H&R Block 1 UPS 7 Hardee's 1 Walgreens 1 Holiday Inn 1 Walmart 1 KFC 1 Wendy's 1 Kroger 2 White Castle 1 La-Z-Boy 1 YMCA 1
Strongest AM radio stations in Martinsville:
WMCB (1540 AM; daytime; 0 kW; MARTINSVILLE, IN; Owner: MID-AMERICA RADIO GROUP, INC.)
WIBC (1070 AM; 50 kW; INDIANAPOLIS, IN; Owner: EMMIS RADIO LICENSE CORPORATION)
WGCL (1370 AM; 5 kW; BLOOMINGTON, IN; Owner: SARKES TARZIAN, INC,)
WTLC (1310 AM; 5 kW; INDIANAPOLIS, IN; Owner: RADIO ONE OF INDIANA, LLC)
WHAS (840 AM; 50 kW; LOUISVILLE, KY; Owner: CLEAR CHANNEL BROADCASTING LICENSES, INC.)
WLW (700 AM; 50 kW; CINCINNATI, OH; Owner: JACOR BROADCASTING CORPORATION)
WXLW (950 AM; 5 kW; INDIANAPOLIS, IN)
WNTS (1590 AM; 5 kW; BEECH GROVE, IN; Owner: S + M BROADCASTING CO., INC.)
WXNT (1430 AM; 5 kW; INDIANAPOLIS, IN; Owner: MYSTAR COMMUNICATIONS CORPORATION)
WSAI (1530 AM; 50 kW; CINCINNATI, OH; Owner: JACOR BROADCASTING CORPORATION)
WNDE (1260 AM; 5 kW; INDIANAPOLIS, IN; Owner: CAPSTAR TX LIMITED PARTNERSHIP)
WOWO (1190 AM; 50 kW; FORT WAYNE, IN; Owner: PATHFINDER COMMUNICATIONS CORPORATION)
WBRI (1500 AM; daytime; 5 kW; INDIANAPOLIS, IN)
Strongest FM radio stations in Martinsville:
WCBK-FM (102.3 FM; MARTINSVILLE, IN; Owner: MID-AMERICA RADIO GROUP, INC.)
WTTS (92.3 FM; BLOOMINGTON, IN; Owner: SARKES TARZIAN, INC.)
WVNI (95.1 FM; NASHVILLE, IN; Owner: BROWN COUNTY BROADCASTERS, INC.)
WENS (97.1 FM; SHELBYVILLE, IN; Owner: EMMIS RADIO LICENSE CORPORATION)
WFIU (103.7 FM; BLOOMINGTON, IN; Owner: TRUSTEES OF INDIANA UNIVERSITY)
WHCC (105.1 FM; ELLETTSVILLE, IN; Owner: ARTISTIC MEDIA PARTNERS, L.P.)
WNOU (93.1 FM; INDIANAPOLIS, IN; Owner: EMMIS RADIO LICENSE CORPORATION)
WZPL (99.5 FM; GREENFIELD, IN; Owner: MYSTAR COMMUNICATIONS CORPORATION)
WFMS (95.5 FM; INDIANAPOLIS, IN; Owner: WFMS LICO, INC)
WYXB (105.7 FM; INDIANAPOLIS, IN; Owner: EMMIS RADIO LICENSE CORPORATION)
WBWB (96.7 FM; BLOOMINGTON, IN; Owner: ARTISTIC MEDIA PARTNERS, L.P.)
WIJY (95.9 FM; FRANKLIN, IN; Owner: PILGRIM COMMUNICATIONS, LLC)
WHHH (96.3 FM; INDIANAPOLIS, IN; Owner: RADIO ONE OF INDIANA, LLC)
WFBQ (94.7 FM; INDIANAPOLIS, IN; Owner: CAPSTAR TX LIMITED PARTNERSHIP)
WRZX (103.3 FM; INDIANAPOLIS, IN; Owner: CAPSTAR TX LIMITED PARTNERSHIP)
WEDJ (107.1 FM; DANVILLE, IN; Owner: CONTINENTAL BROADCAST GROUP, LLC)
WTPI (107.9 FM; INDIANAPOLIS, IN; Owner: MYSTAR COMMUNICATIONS CORPORATION)
WSPM (89.1 FM; CLOVERDALE, IN; Owner: HOOSIER BROADCASTING CORPORATION)
WSKT (92.7 FM; SPENCER, IN; Owner: MID-AMERICA RADIO OF INDIANA, INC.)
WFCI (89.5 FM; FRANKLIN, IN; Owner: FRANKLIN COLLEGE OF INDIANA)
TV broadcast stations around Martinsville:
WREP-LP (Channel 15; MARTINSVILLE, IN; Owner: METROPOLITAN SCH. DIST. MARTINSVILLE)
WTTV (Channel 4; BLOOMINGTON, IN; Owner: TRIBUNE BROADCAST HOLDINGS, INC.)
WCLJ (Channel 42; BLOOMINGTON, IN; Owner: TRINITY BROADCASTING OF INDIANA, INC.)
WTIU (Channel 30; BLOOMINGTON, IN; Owner: THE TRUSTEES OF INDIANA UNIVERSITY)
WIPX (Channel 63; BLOOMINGTON, IN; Owner: PAXSON INDIANAPOLIS LICENSE, INC.)
WKOG-LP (Channel 31; INDIANAPOLIS, IN; Owner: KINGDOM OF GOD MINISTRIES, INC.)
WDNI-LP (Channel 65; INDIANAPOLIS, IN; Owner: RADIO ONE OF INDIANA, LLC)
WIPX-LP (Channel 51; INDIANAPOLIS, IN; Owner: PAXSON COMMUNICATIONS LICENSE COMPANY, LLC)
WXIN (Channel 59; INDIANAPOLIS, IN; Owner: TRIBUNE TELEVISION COMPANY)
WISH-TV (Channel 8; INDIANAPOLIS, IN; Owner: INDIANA BROADCASTING, LLC)
WHMB-TV (Channel 40; INDIANAPOLIS, IN; Owner: LESEA BROADCASTING CORPORATION)
WRTV (Channel 6; INDIANAPOLIS, IN; Owner: MCGRAW-HILL BROADCASTING COMPANY, INC.)
WTHR (Channel 13; INDIANAPOLIS, IN; Owner: VIDEOINDIANA, INC.)
WBXI-CA (Channel 47; INDIANAPOLIS, IN; Owner: THE BOX WORLDWIDE LLC)
WFYI (Channel 20; INDIANAPOLIS, IN; Owner: METROPOLITAN INDIANAPOLIS PUBLIC BROADCASTING, INC.)
WALV-CA (Channel 50; INDIANAPOLIS, IN; Owner: VIDEOHIO, INC..)
WTBU-TV (Channel 69; INDIANAPOLIS, IN; Owner: BUTLER UNIVERSITY)
National Bridge Inventory (NBI) Statistics 64 Number of bridges587ft / 179m Total length $2,100,000 Total costs513,477 Total average daily traffic88,061 Total average daily truck traffic
New bridges - historical statistics
1 Before 1900 2 1920-1929 2 1930-1939 1 1940-1949 4 1960-1969 6 1970-1979 1 1980-1989 5 1990-1999 2 2000-2009 21 2010-2019 19 2020-2022
See full National Bridge Inventory statistics for Martinsville, IN
Home Mortgage Disclosure Act Aggregated Statistics For Year 2009(Based on 2 full tracts) A) FHA, FSA/RHS & VA B) Conventional C) Refinancings D) Home Improvement Loans F) Non-occupant Loans on G) Loans On Manufactured Number Average Value Number Average Value Number Average Value Number Average Value Number Average Value Number Average Value
LOANS ORIGINATED 20 $76,018 23 $78,500 104 $83,916 18 $41,282 31 $79,797 1 $25,000 APPLICATIONS APPROVED, NOT ACCEPTED 1 $48,600 0 $0 4 $67,052 0 $0 0 $0 0 $0 APPLICATIONS DENIED 11 $63,676 14 $50,795 43 $87,789 12 $36,192 11 $56,454 0 $0 APPLICATIONS WITHDRAWN 5 $101,774 8 $55,041 34 $80,968 0 $0 10 $60,801 0 $0 FILES CLOSED FOR INCOMPLETENESS 1 $88,280 1 $71,000 3 $108,417 1 $3,000 0 $0 0 $0
Aggregated Statistics For Year 2008(Based on 2 full tracts) A) FHA, FSA/RHS & VA B) Conventional C) Refinancings D) Home Improvement Loans E) Loans on Dwellings For 5+ Families F) Non-occupant Loans on G) Loans On Manufactured Number Average Value Number Average Value Number Average Value Number Average Value Number Average Value Number Average Value Number Average Value
LOANS ORIGINATED 42 $78,660 38 $64,058 74 $71,726 17 $23,415 1 $168,620 29 $59,151 2 $24,795 APPLICATIONS APPROVED, NOT ACCEPTED 3 $85,633 3 $94,443 9 $107,739 3 $28,473 0 $0 2 $68,935 1 $47,610 APPLICATIONS DENIED 13 $80,458 14 $63,670 67 $89,050 18 $17,479 0 $0 8 $68,634 7 $39,959 APPLICATIONS WITHDRAWN 4 $71,630 6 $81,667 28 $93,908 3 $75,693 0 $0 5 $74,306 0 $0 FILES CLOSED FOR INCOMPLETENESS 4 $103,800 4 $51,348 7 $83,641 0 $0 0 $0 2 $40,000 1 $74,390
Aggregated Statistics For Year 2007(Based on 2 full tracts) A) FHA, FSA/RHS & VA B) Conventional C) Refinancings D) Home Improvement Loans E) Loans on Dwellings For 5+ Families F) Non-occupant Loans on G) Loans On Manufactured Number Average Value Number Average Value Number Average Value Number Average Value Number Average Value Number Average Value Number Average Value
LOANS ORIGINATED 26 $79,163 83 $77,312 94 $78,760 26 $34,983 1 $168,620 42 $66,195 2 $104,150 APPLICATIONS APPROVED, NOT ACCEPTED 5 $68,798 6 $60,090 21 $83,538 1 $19,000 0 $0 1 $42,000 1 $112,080 APPLICATIONS DENIED 3 $106,040 26 $64,380 104 $102,798 27 $47,342 0 $0 9 $79,393 2 $29,295 APPLICATIONS WITHDRAWN 1 $90,260 12 $55,308 61 $95,678 4 $16,978 0 $0 10 $66,287 1 $112,080 FILES CLOSED FOR INCOMPLETENESS 1 $110,000 2 $122,395 13 $84,460 0 $0 0 $0 2 $94,500 0 $0
Aggregated Statistics For Year 2006(Based on 2 full tracts) A) FHA, FSA/RHS & VA B) Conventional C) Refinancings D) Home Improvement Loans E) Loans on Dwellings For 5+ Families F) Non-occupant Loans on G) Loans On Manufactured Number Average Value Number Average Value Number Average Value Number Average Value Number Average Value Number Average Value Number Average Value
LOANS ORIGINATED 18 $78,724 106 $71,796 120 $78,573 25 $40,018 2 $432,470 44 $79,444 1 $9,920 APPLICATIONS APPROVED, NOT ACCEPTED 0 $0 8 $82,971 13 $67,393 4 $29,212 0 $0 0 $0 0 $0 APPLICATIONS DENIED 4 $67,382 37 $66,523 107 $93,436 31 $42,072 0 $0 14 $75,111 4 $57,778 APPLICATIONS WITHDRAWN 3 $77,243 16 $67,558 40 $105,353 5 $41,486 0 $0 9 $60,771 0 $0 FILES CLOSED FOR INCOMPLETENESS 0 $0 1 $62,000 16 $106,952 0 $0 0 $0 3 $69,693 0 $0
Aggregated Statistics For Year 2005(Based on 2 full tracts) A) FHA, FSA/RHS & VA B) Conventional C) Refinancings D) Home Improvement Loans E) Loans on Dwellings For 5+ Families F) Non-occupant Loans on G) Loans On Manufactured Number Average Value Number Average Value Number Average Value Number Average Value Number Average Value Number Average Value Number Average Value
LOANS ORIGINATED 25 $78,864 111 $69,278 154 $81,206 28 $31,526 1 $148,790 55 $73,583 1 $26,780 APPLICATIONS APPROVED, NOT ACCEPTED 1 $126,960 19 $59,041 25 $84,684 2 $6,470 0 $0 1 $64,000 2 $16,365 APPLICATIONS DENIED 6 $86,885 37 $66,061 110 $89,762 16 $31,771 0 $0 10 $71,559 6 $37,315 APPLICATIONS WITHDRAWN 1 $63,480 10 $71,552 78 $92,539 15 $82,997 1 $3,200,000 8 $54,184 0 $0 FILES CLOSED FOR INCOMPLETENESS 0 $0 0 $0 21 $101,163 0 $0 0 $0 3 $81,333 0 $0
Aggregated Statistics For Year 2004(Based on 2 full tracts) A) FHA, FSA/RHS & VA B) Conventional C) Refinancings D) Home Improvement Loans F) Non-occupant Loans on G) Loans On Manufactured Number Average Value Number Average Value Number Average Value Number Average Value Number Average Value Number Average Value
LOANS ORIGINATED 29 $84,774 79 $65,441 161 $75,540 37 $30,861 60 $57,104 1 $49,590 APPLICATIONS APPROVED, NOT ACCEPTED 1 $105,000 15 $87,317 22 $82,048 4 $45,820 3 $164,203 0 $0 APPLICATIONS DENIED 4 $89,732 33 $64,355 150 $86,869 25 $45,303 10 $80,840 5 $19,640 APPLICATIONS WITHDRAWN 2 $88,500 8 $76,236 83 $93,353 5 $30,344 2 $48,380 0 $0 FILES CLOSED FOR INCOMPLETENESS 2 $69,435 5 $62,552 29 $81,667 2 $101,570 2 $70,600 0 $0
Aggregated Statistics For Year 2003(Based on 2 full tracts) A) FHA, FSA/RHS & VA B) Conventional C) Refinancings D) Home Improvement Loans E) Loans on Dwellings For 5+ Families F) Non-occupant Loans on Number Average Value Number Average Value Number Average Value Number Average Value Number Average Value Number Average Value
LOANS ORIGINATED 22 $93,087 53 $79,920 326 $76,950 13 $10,022 1 $1,305,000 69 $58,286 APPLICATIONS APPROVED, NOT ACCEPTED 1 $194,000 9 $93,226 46 $78,588 4 $26,645 0 $0 11 $61,855 APPLICATIONS DENIED 5 $86,572 23 $56,996 145 $90,220 9 $19,713 0 $0 13 $54,904 APPLICATIONS WITHDRAWN 4 $88,100 5 $89,084 87 $84,462 0 $0 0 $0 6 $60,408 FILES CLOSED FOR INCOMPLETENESS 1 $68,440 2 $56,295 12 $72,648 0 $0 0 $0 0 $0
Aggregated Statistics For Year 2002(Based on 2 full tracts) A) FHA, FSA/RHS & VA B) Conventional C) Refinancings D) Home Improvement Loans F) Non-occupant Loans on Number Average Value Number Average Value Number Average Value Number Average Value Number Average Value
LOANS ORIGINATED 41 $84,142 66 $76,943 239 $77,317 13 $6,894 62 $62,070 APPLICATIONS APPROVED, NOT ACCEPTED 4 $114,498 13 $82,450 46 $84,908 1 $9,920 5 $69,684 APPLICATIONS DENIED 6 $78,907 20 $74,768 124 $76,976 14 $13,563 8 $70,656 APPLICATIONS WITHDRAWN 1 $63,480 5 $75,946 71 $79,158 1 $29,760 5 $66,798 FILES CLOSED FOR INCOMPLETENESS 2 $78,360 1 $83,000 47 $73,347 0 $0 5 $74,488
Aggregated Statistics For Year 2001(Based on 2 full tracts) A) FHA, FSA/RHS & VA B) Conventional C) Refinancings D) Home Improvement Loans F) Non-occupant Loans on Number Average Value Number Average Value Number Average Value Number Average Value Number Average Value
LOANS ORIGINATED 34 $84,441 75 $77,951 259 $77,866 33 $11,316 57 $75,561 APPLICATIONS APPROVED, NOT ACCEPTED 4 $92,108 10 $57,920 26 $81,063 4 $39,282 5 $86,694 APPLICATIONS DENIED 4 $98,000 27 $50,932 157 $72,365 28 $13,580 10 $48,406 APPLICATIONS WITHDRAWN 2 $81,115 15 $57,547 58 $77,158 5 $13,332 3 $89,000 FILES CLOSED FOR INCOMPLETENESS 1 $46,620 2 $134,500 20 $75,780 1 $30,000 0 $0
Aggregated Statistics For Year 2000(Based on 2 full tracts) A) FHA, FSA/RHS & VA B) Conventional C) Refinancings D) Home Improvement Loans F) Non-occupant Loans on Number Average Value Number Average Value Number Average Value Number Average Value Number Average Value
LOANS ORIGINATED 25 $81,244 73 $66,799 116 $63,685 44 $13,609 38 $63,172 APPLICATIONS APPROVED, NOT ACCEPTED 6 $85,740 9 $53,578 26 $61,611 13 $19,413 4 $56,298 APPLICATIONS DENIED 4 $98,968 27 $58,528 108 $58,332 22 $20,163 11 $49,828 APPLICATIONS WITHDRAWN 4 $87,975 12 $78,955 44 $58,577 6 $22,543 5 $58,238 FILES CLOSED FOR INCOMPLETENESS 1 $69,430 1 $42,000 12 $69,137 1 $35,000 0 $0
Aggregated Statistics For Year 1999(Based on 2 full tracts) A) FHA, FSA/RHS & VA B) Conventional C) Refinancings D) Home Improvement Loans E) Loans on Dwellings For 5+ Families F) Non-occupant Loans on Number Average Value Number Average Value Number Average Value Number Average Value Number Average Value Number Average Value
LOANS ORIGINATED 28 $77,806 64 $61,431 162 $57,505 47 $10,818 1 $133,430 35 $62,522 APPLICATIONS APPROVED, NOT ACCEPTED 0 $0 10 $54,781 45 $56,211 17 $15,444 0 $0 3 $66,280 APPLICATIONS DENIED 4 $80,295 26 $48,962 92 $57,536 23 $13,293 0 $0 14 $53,759 APPLICATIONS WITHDRAWN 0 $0 16 $59,676 62 $68,502 4 $47,358 0 $0 3 $68,943 FILES CLOSED FOR INCOMPLETENESS 1 $114,910 3 $64,290 12 $79,838 0 $0 0 $0 3 $68,060
Detailed HMDA statistics for the following Tracts:
5108.00
, 5109.00
Private Mortgage Insurance Companies Aggregated Statistics For Year 2009(Based on 2 full tracts) A) Conventional B) Refinancings Number Average Value Number Average Value
LOANS ORIGINATED 2 $87,195 5 $97,684 APPLICATIONS APPROVED, NOT ACCEPTED 0 $0 3 $93,667 APPLICATIONS DENIED 1 $94,230 0 $0 APPLICATIONS WITHDRAWN 0 $0 0 $0 FILES CLOSED FOR INCOMPLETENESS 0 $0 0 $0
Aggregated Statistics For Year 2008(Based on 2 full tracts) A) Conventional B) Refinancings C) Non-occupant Loans on Number Average Value Number Average Value Number Average Value
LOANS ORIGINATED 17 $73,182 5 $84,740 5 $72,956 APPLICATIONS APPROVED, NOT ACCEPTED 3 $63,813 6 $84,573 0 $0 APPLICATIONS DENIED 0 $0 3 $111,753 0 $0 APPLICATIONS WITHDRAWN 0 $0 0 $0 0 $0 FILES CLOSED FOR INCOMPLETENESS 0 $0 0 $0 0 $0
Aggregated Statistics For Year 2007(Based on 2 full tracts) A) Conventional B) Refinancings C) Non-occupant Loans on Number Average Value Number Average Value Number Average Value
LOANS ORIGINATED 41 $83,703 15 $100,438 4 $54,960 APPLICATIONS APPROVED, NOT ACCEPTED 4 $89,885 6 $97,833 1 $64,470 APPLICATIONS DENIED 2 $63,715 0 $0 0 $0 APPLICATIONS WITHDRAWN 0 $0 3 $95,290 0 $0 FILES CLOSED FOR INCOMPLETENESS 0 $0 1 $115,000 0 $0
Aggregated Statistics For Year 2006(Based on 2 full tracts) A) Conventional B) Refinancings C) Non-occupant Loans on D) Loans On Manufactured Number Average Value Number Average Value Number Average Value Number Average Value
LOANS ORIGINATED 35 $73,727 10 $88,893 8 $68,675 1 $72,000 APPLICATIONS APPROVED, NOT ACCEPTED 1 $54,000 0 $0 0 $0 0 $0 APPLICATIONS DENIED 0 $0 1 $82,330 0 $0 0 $0 APPLICATIONS WITHDRAWN 1 $62,000 2 $84,805 0 $0 0 $0 FILES CLOSED FOR INCOMPLETENESS 0 $0 0 $0 0 $0 0 $0
Aggregated Statistics For Year 2005(Based on 2 full tracts) A) Conventional B) Refinancings C) Non-occupant Loans on Number Average Value Number Average Value Number Average Value
LOANS ORIGINATED 19 $99,471 11 $88,889 5 $72,416 APPLICATIONS APPROVED, NOT ACCEPTED 4 $103,952 2 $86,295 0 $0 APPLICATIONS DENIED 3 $62,140 0 $0 1 $31,000 APPLICATIONS WITHDRAWN 0 $0 1 $105,140 0 $0 FILES CLOSED FOR INCOMPLETENESS 0 $0 1 $113,000 0 $0
Aggregated Statistics For Year 2004(Based on 2 full tracts) A) Conventional B) Refinancings C) Non-occupant Loans on Number Average Value Number Average Value Number Average Value
LOANS ORIGINATED 22 $87,532 11 $96,495 5 $104,978 APPLICATIONS APPROVED, NOT ACCEPTED 3 $59,780 9 $104,870 2 $49,170 APPLICATIONS DENIED 0 $0 0 $0 0 $0 APPLICATIONS WITHDRAWN 1 $72,410 4 $91,475 0 $0 FILES CLOSED FOR INCOMPLETENESS 0 $0 2 $117,505 0 $0
Aggregated Statistics For Year 2003(Based on 2 full tracts) A) Conventional B) Refinancings C) Non-occupant Loans on Number Average Value Number Average Value Number Average Value
LOANS ORIGINATED 18 $69,474 34 $87,654 8 $51,965 APPLICATIONS APPROVED, NOT ACCEPTED 4 $87,138 13 $100,504 0 $0 APPLICATIONS DENIED 1 $17,000 1 $79,350 2 $48,175 APPLICATIONS WITHDRAWN 3 $53,667 1 $102,000 1 $40,670 FILES CLOSED FOR INCOMPLETENESS 1 $62,000 0 $0 0 $0
Aggregated Statistics For Year 2002(Based on 2 full tracts) A) Conventional B) Refinancings C) Non-occupant Loans on Number Average Value Number Average Value Number Average Value
LOANS ORIGINATED 21 $77,273 19 $94,641 3 $84,000 APPLICATIONS APPROVED, NOT ACCEPTED 6 $103,243 7 $98,463 2 $71,415 APPLICATIONS DENIED 0 $0 0 $0 0 $0 APPLICATIONS WITHDRAWN 1 $88,000 2 $68,935 0 $0 FILES CLOSED FOR INCOMPLETENESS 0 $0 0 $0 0 $0
Aggregated Statistics For Year 2001(Based on 2 full tracts) A) Conventional B) Refinancings C) Non-occupant Loans on Number Average Value Number Average Value Number Average Value
LOANS ORIGINATED 18 $87,464 28 $87,341 3 $60,350 APPLICATIONS APPROVED, NOT ACCEPTED 1 $42,000 4 $105,110 0 $0 APPLICATIONS DENIED 2 $76,755 1 $85,300 1 $85,300 APPLICATIONS WITHDRAWN 0 $0 1 $84,310 0 $0 FILES CLOSED FOR INCOMPLETENESS 0 $0 0 $0 0 $0
Aggregated Statistics For Year 2000(Based on 2 full tracts) A) Conventional B) Refinancings C) Non-occupant Loans on Number Average Value Number Average Value Number Average Value
LOANS ORIGINATED 13 $82,765 14 $77,230 0 $0 APPLICATIONS APPROVED, NOT ACCEPTED 2 $69,000 0 $0 1 $54,000 APPLICATIONS DENIED 0 $0 1 $63,480 0 $0 APPLICATIONS WITHDRAWN 0 $0 0 $0 0 $0 FILES CLOSED FOR INCOMPLETENESS 0 $0 0 $0 0 $0
Aggregated Statistics For Year 1999(Based on 2 full tracts) A) Conventional B) Refinancings C) Non-occupant Loans on Number Average Value Number Average Value Number Average Value
LOANS ORIGINATED 13 $79,039 11 $73,044 0 $0 APPLICATIONS APPROVED, NOT ACCEPTED 2 $71,960 2 $78,580 1 $55,960 APPLICATIONS DENIED 0 $0 1 $76,110 0 $0 APPLICATIONS WITHDRAWN 0 $0 1 $60,290 0 $0 FILES CLOSED FOR INCOMPLETENESS 0 $0 0 $0 0 $0
Detailed PMIC statistics for the following Tracts:
5108.00
, 5109.00 Fire-safe hotels and motels in Martinsville, Indiana:
Hillview Motel, 2600 SR 37 S, Martinsville, Indiana 46151 Phone: (765) 342-6272
Comfort Inn, 50 Bills Blvd, Martinsville, Indiana 46151 Phone: (765) 342-1842
Holiday Inn Express Hotels & Suites, 2233 Burton Ln, Martinsville, Indiana 46151 Phone: (765) 813-3999, Fax: (765) 813-3993
super 8 martinsville, 55 Bills Blvd, Martinsville, Indiana 46151 Phone: (765) 349-2222
All 4 fire-safe hotels and motels in Martinsville, Indiana
Most common first names in Martinsville, IN among deceased individuals Name Count Lived (average)
Mary 227 78.7 years William 193 74.5 years James 170 70.8 years Charles 164 73.8 years John 149 74.3 years Robert 147 70.7 years George 77 72.8 years Betty 75 72.7 years Ruth 70 77.7 years Margaret 67 79.9 years
Most common last names in Martinsville, IN among deceased individuals Last name Count Lived (average)
Smith 60 76.3 years Williams 53 78.6 years Miller 48 76.4 years Baker 42 71.0 years Martin 41 76.5 years Johnson 36 72.2 years Cramer 36 77.9 years Davis 36 72.3 years Moore 36 79.4 years Brown 34 75.0 years
Martinsville compared to Indiana state average:
Unemployed percentage significantly below state average. Black race population percentage significantly below state average. Hispanic race population percentage significantly below state average. Foreign-born population percentage significantly below state average. Institutionalized population percentage above state average. Percentage of population with a bachelor's degree or higher below state average. Martinsville on our top lists :
#52 on the list of "Top 101 cities with largest percentage of females in occupations: food preparation and serving related occupations (population 5,000+)"
#64 on the list of "Top 101 cities with the highest number of thefts per 100,000 residents, excludes tourist destinations and others with a lot of outsiders visiting based on city industries data (population 5,000+)"
#37 on the list of "Top 101 counties with the largest increase in the number of deaths per 1000 residents 2000-2006 to 2007-2013 (pop. 50,000+)"
Top Patent Applicants
John Kresse (13)
John P. Kresse (12)
Isaac Mock (8)
Dan C. Ireland (7)
Vance A. Mahan (5)
Jacque S. Bader (4)
Craig Heathco (4)
Kirk J. Botkin (4)
David V. Toloday (4)
Matthew T. Kush (3)
Total of 127 patent applications in 2008-2024.

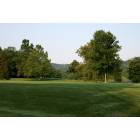
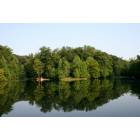


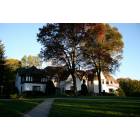
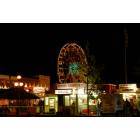

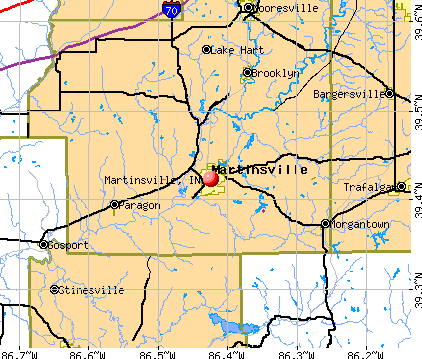


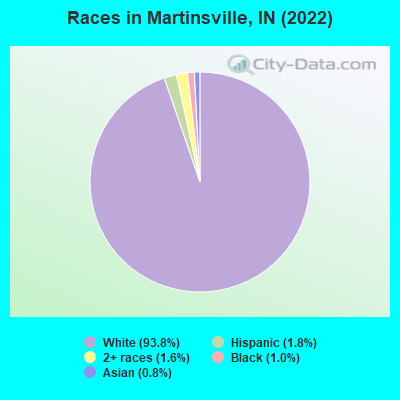
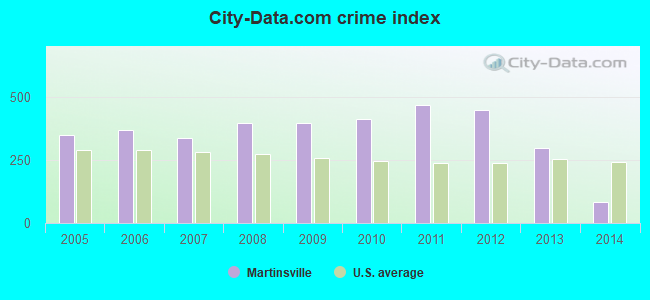
 Recent articles from our blog. Our writers, many of them Ph.D. graduates or candidates, create easy-to-read articles on a wide variety of topics.

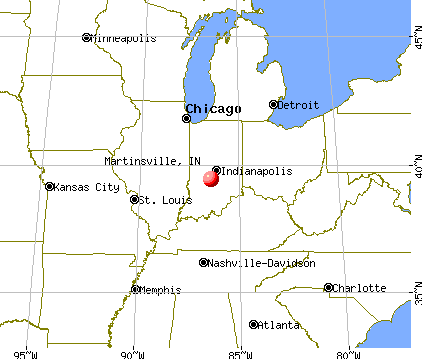
 (18.9 miles
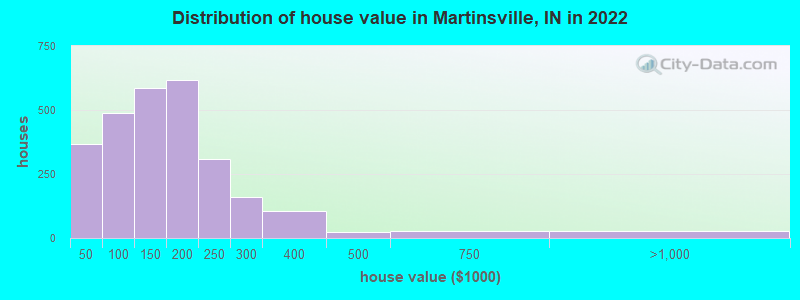

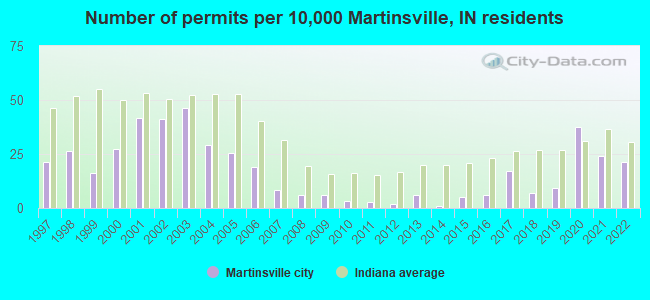
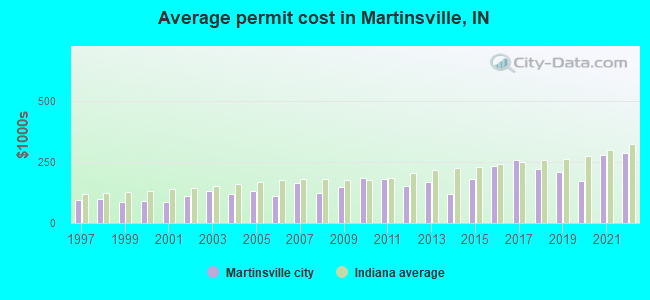
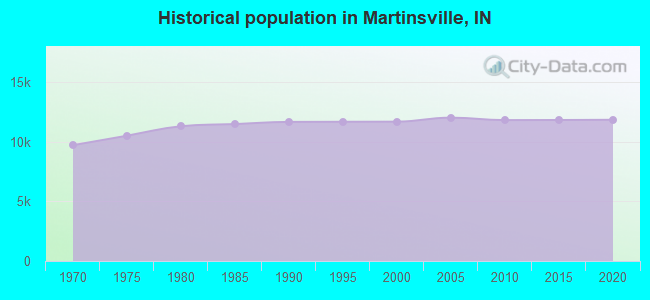
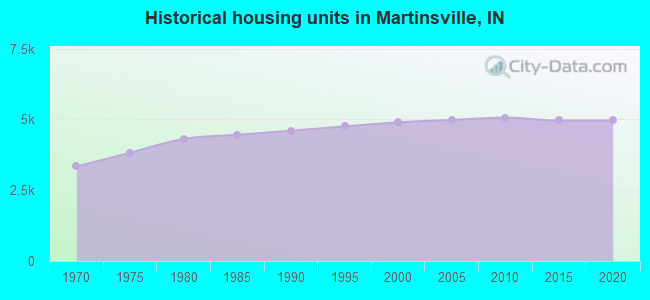
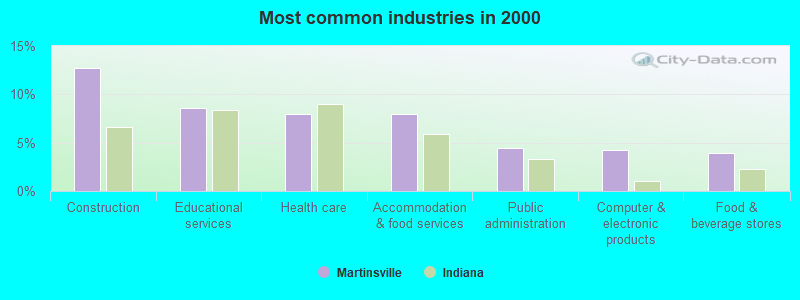

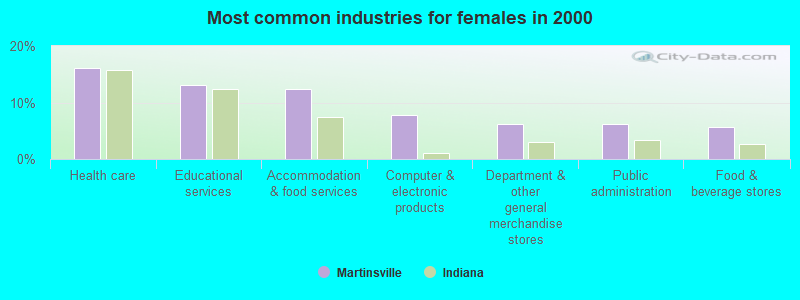
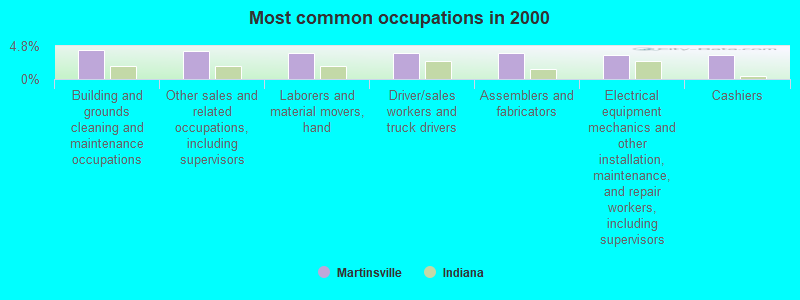
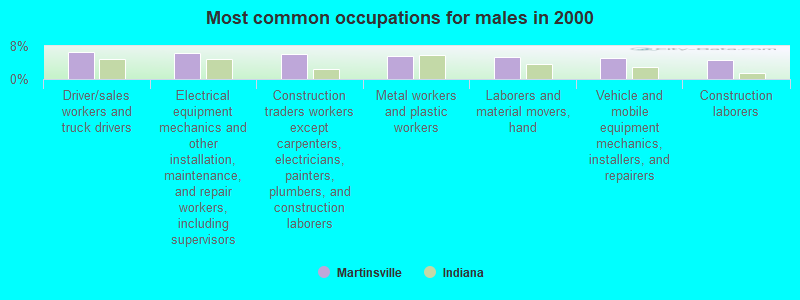
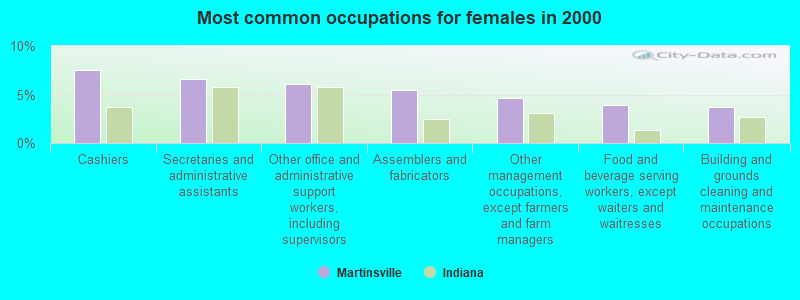


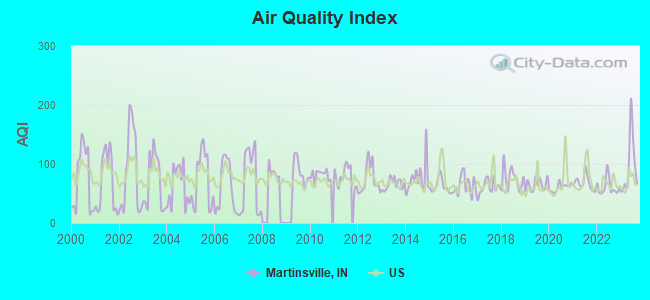
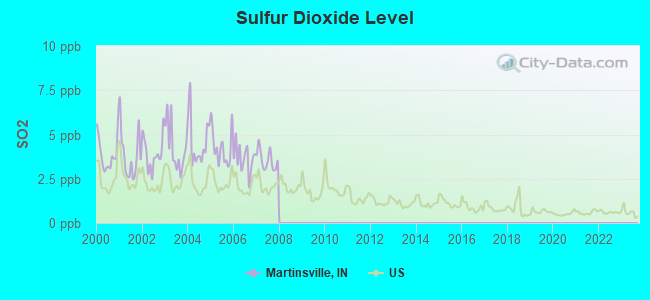
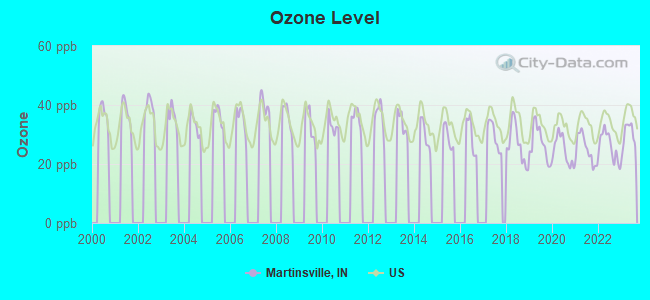
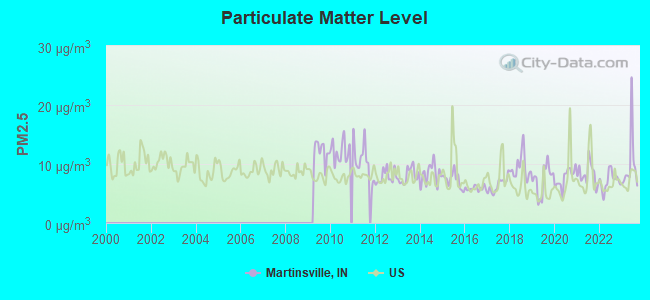
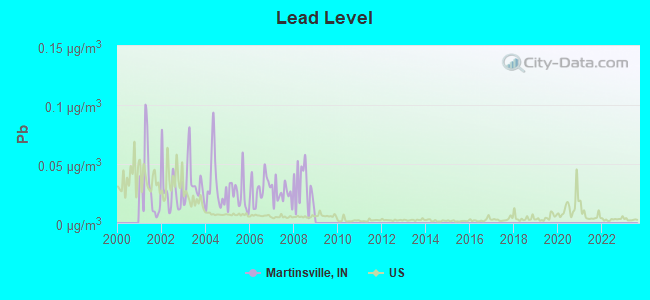
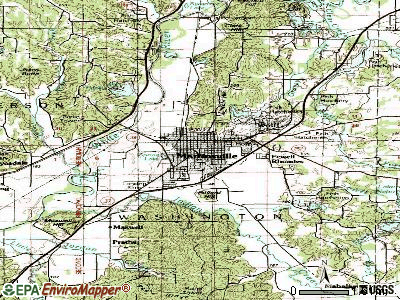
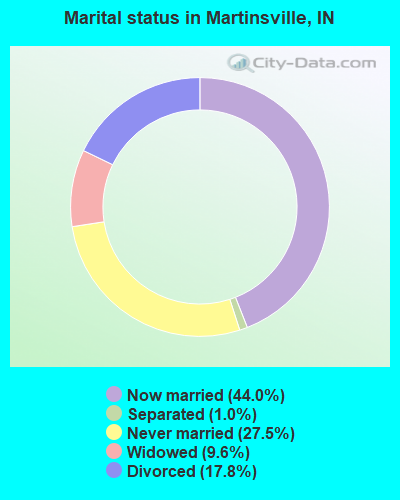
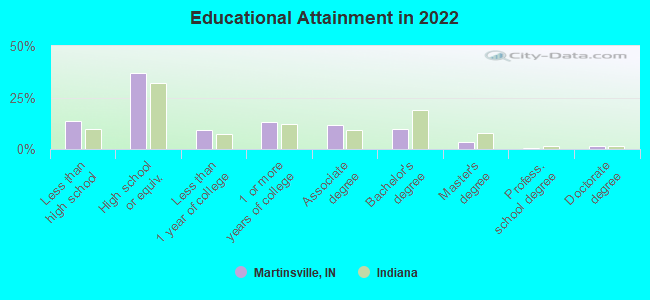
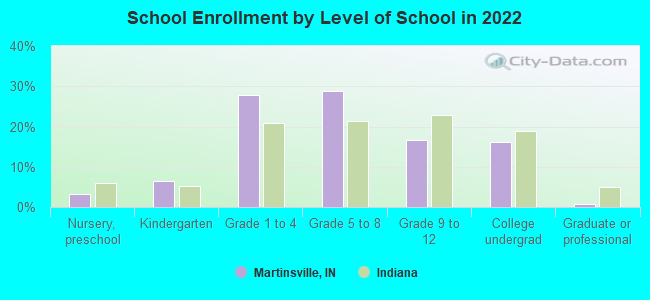
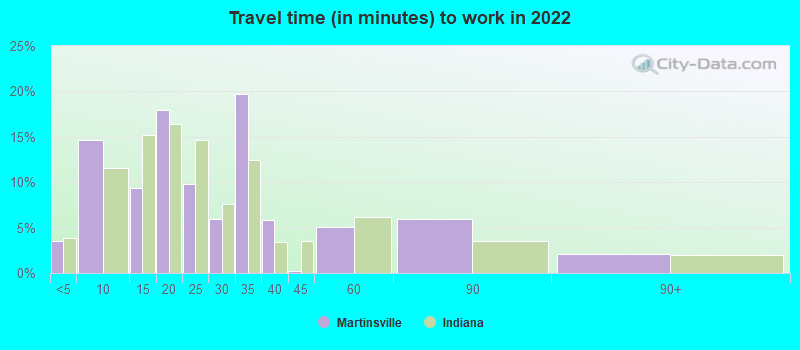
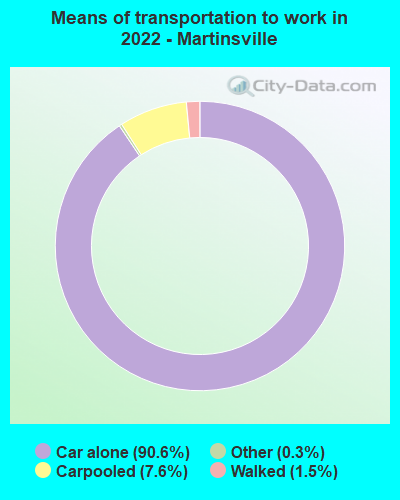
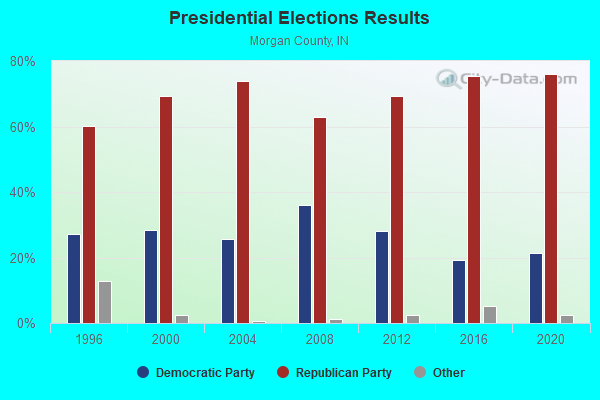
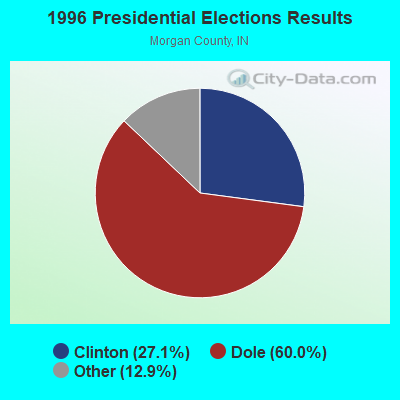

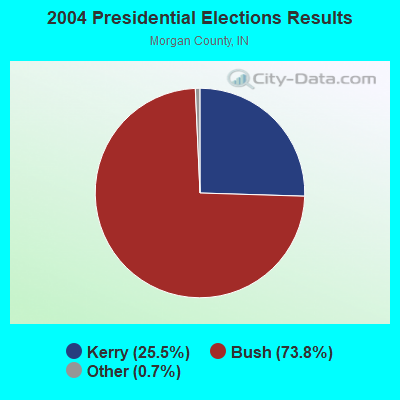
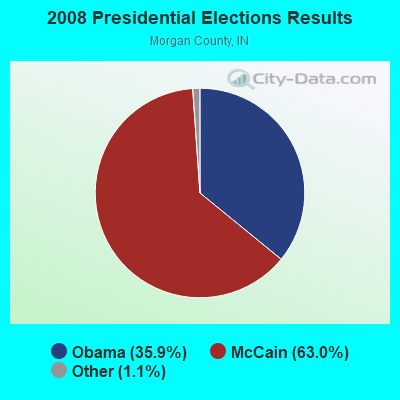
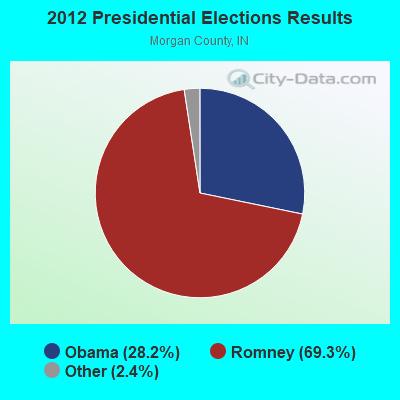
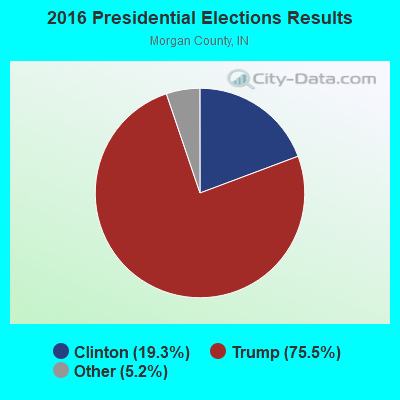
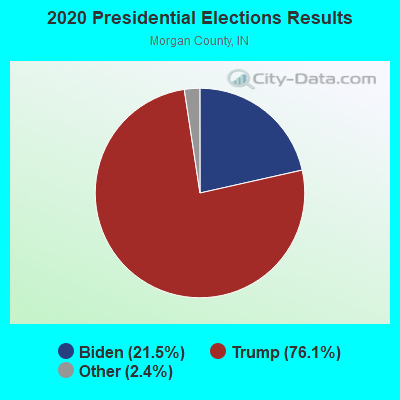
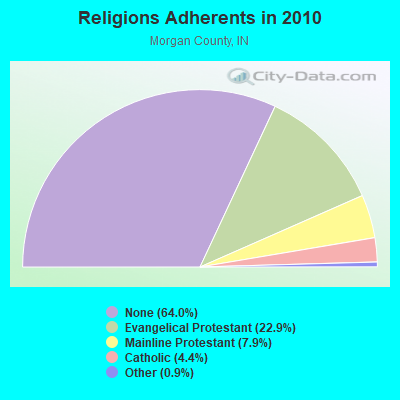
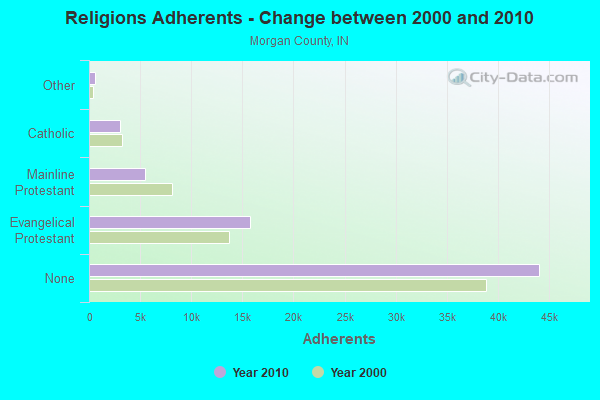
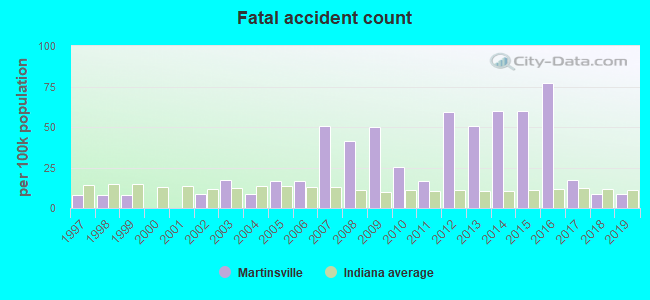
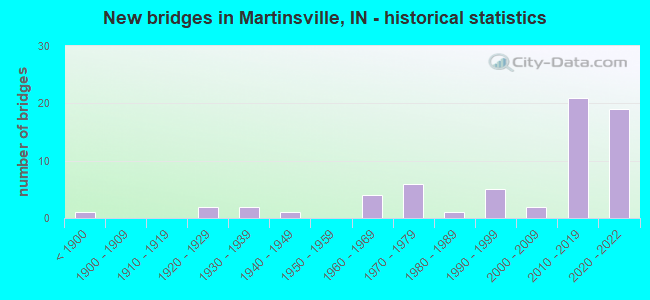
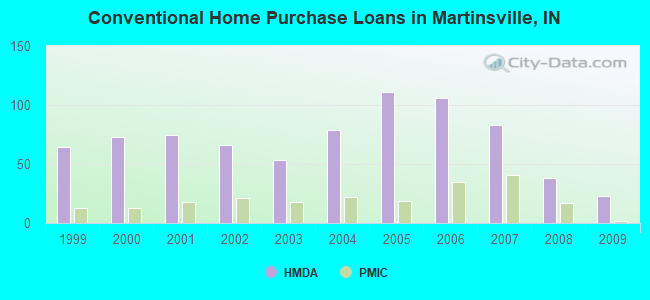
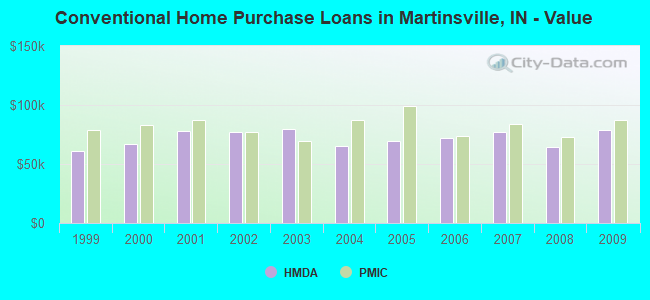
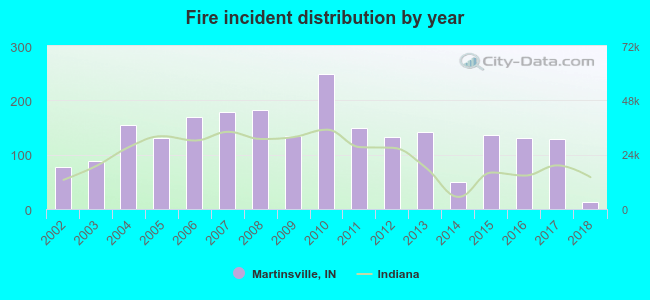 According to the data from the years 2002 - 2018 the average number of fires per year is 132. The highest number of fires - 249 took place in 2010, and the least - 12 in 2018. The data has a decreasing trend.
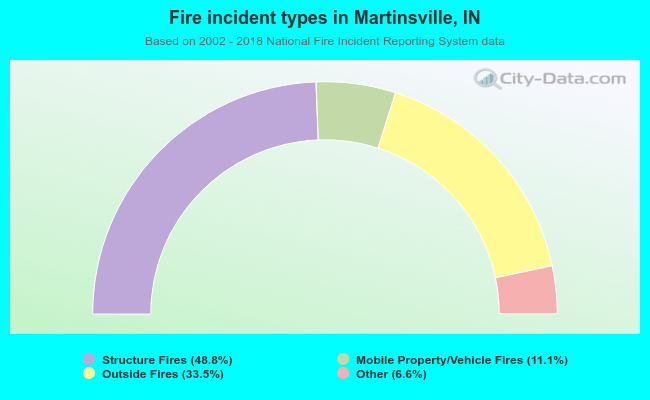 When looking into fire subcategories, the most reports belonged to: Structure Fires (48.8%), and Outside Fires (33.5%).