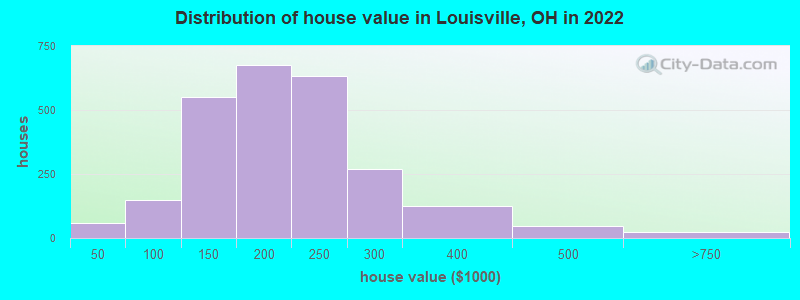
Estimated median house or condo value in 2022: $187,470 (it was $112,400 in 2000)
Louisville:
$187,470
OH:
$204,100
Mean prices in 2022:all housing units: $202,531; detached houses: $202,768; townhouses or other attached units: $142,539; in 2-unit structures: $240,199
Median gross rent in 2022: $822.
March 2022 cost of living index in Louisville: 89.7 (less than average, U.S. average is 100)
Percentage of residents living in poverty in 2022: 8.8%
(8.7% for White Non-Hispanic residents, 20.0% for Black residents, 23.6% for Hispanic or Latino residents, 9.8% for two or more races residents)
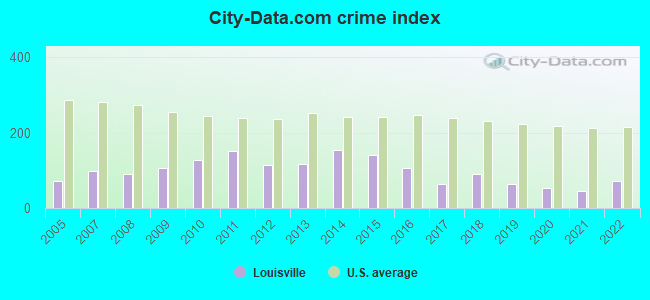
The City-Data.com crime index weighs serious crimes and violent crimes more heavily. Higher means more crime, U.S. average is 246.1. It adjusts for the number of visitors and daily workers commuting into cities.
Latest news from Louisville, OH collected exclusively by city-data.com from local newspapers, TV, and radio stations
Ancestries: German (27.1%), American (13.9%), Irish (12.9%), European (8.5%), Italian (6.6%), English (2.0%).
Current Local Time: EST time zone
Incorporated in 1960
Land area: 5.16 square miles.
Population density: 1,846 people per square mile (low).
102 residents are foreign born
This city:
1.1%
Ohio:
4.9%
Median real estate property taxes paid for housing units with mortgages in 2022: $2,132 (1.0%) Median real estate property taxes paid for housing units with no mortgage in 2022: $2,235 (1.4%)
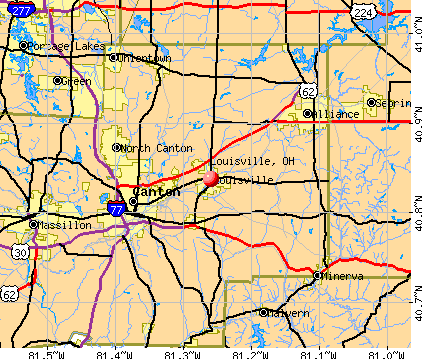
Nearest city with pop. 50,000+: Canton, OH (6.5 miles , pop. 80,806).
Nearest city with pop. 200,000+: Akron, OH (21.2 miles , pop. 217,074).
Nearest city with pop. 1,000,000+: Philadelphia, PA (327.1 miles , pop. 1,517,550).
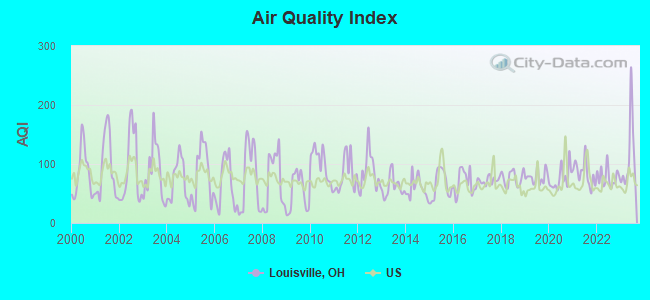
Air Quality Index (AQI) level in 2023 was 112. This is significantly worse than average.
City:
112
U.S.:
73
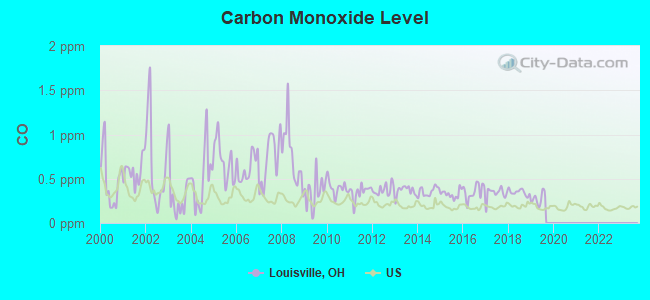
Carbon Monoxide (CO) [ppm] level in 2019 was 0.276. This is about average.Closest monitor was 6.5 miles away from the city center.
City:
0.276
U.S.:
0.251
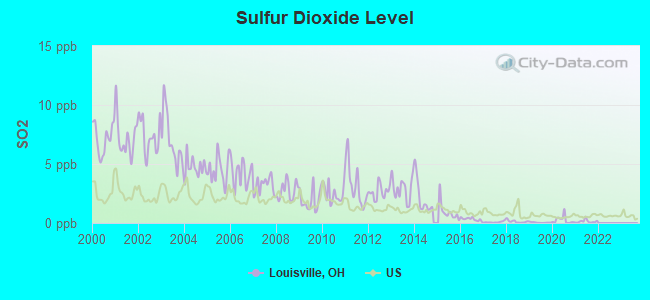
Sulfur Dioxide (SO2) [ppb] level in 2021 was 0.136. This is significantly better than average.Closest monitor was 1.5 miles away from the city center.
City:
0.136
U.S.:
1.515
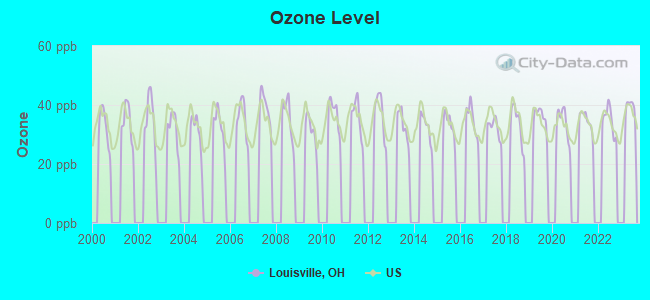
Ozone [ppb] level in 2022 was 34.9. This is about average.Closest monitor was 4.6 miles away from the city center.
City:
34.9
U.S.:
33.3
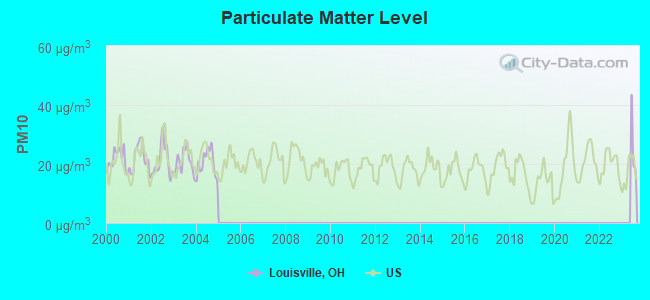
Particulate Matter (PM10) [µg/m3] level in 2004 was 20.4. This is about average.Closest monitor was 6.5 miles away from the city center.
City:
20.4
U.S.:
19.2
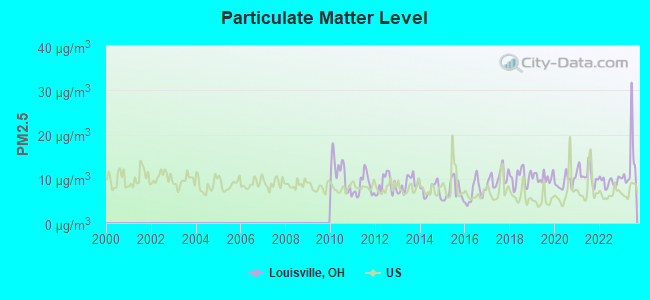
Particulate Matter (PM2.5) [µg/m3] level in 2023 was 13.5. This is significantly worse than average.Closest monitor was 6.5 miles away from the city center.
City:
13.5
U.S.:
8.1
Tornado activity:
Louisville-area historical tornado activity is near Ohio state average. It is 8% greater than the overall U.S. average.
On 5/31/1985, a category F5 (max. wind speeds 261-318 mph) tornado 25.7 miles away from the Louisville city center killed 18 peopleand injured 310 peopleand causedbetween $50,000,000 and $500,000,000 in damages.
On 10/12/1978, a category F3 (max. wind speeds 158-206 mph) tornado 17.9 miles away from the city center injured 4 peopleand causedbetween $500,000 and $5,000,000 in damages.
Earthquake activity:
Louisville-area historical earthquake activity is significantly above Ohio state average. It is 48% smaller than the overall U.S. average.
On 9/25/1998 at 19:52:52, a magnitude 5.2 (4.8 MB, 4.3 MS, 5.2 LG, 4.5 MW, Depth: 3.1 mi, Class: Moderate, Intensity: VI - VII) earthquake occurred 63.8 miles away from Louisville center On 1/31/1986 at 16:46:43, a magnitude 5.0 (5.0 MB) earthquake occurred 53.1 miles away from the city center On 8/23/2011 at 17:51:04, a magnitude 5.8 (5.8 MW, Depth: 3.7 mi) earthquake occurred 269.3 miles away from the city center On 7/27/1980 at 18:52:21, a magnitude 5.2 (5.1 MB, 4.7 MS, 5.0 UK, 5.2 UK) earthquake occurred 231.6 miles away from Louisville center On 12/31/2011 at 20:05:01, a magnitude 4.0 (4.0 ML, Depth: 3.1 mi, Class: Light, Intensity: IV - V) earthquake occurred 35.9 miles away from Louisville center On 6/10/2019 at 14:50:45, a magnitude 4.0 (4.0 MB, Depth: 1.2 mi) earthquake occurred 59.2 miles away from Louisville center Magnitude types: regional Lg-wave magnitude (LG), body-wave magnitude (MB), local magnitude (ML), surface-wave magnitude (MS), moment magnitude (MW)
Natural disasters:
The number of natural disasters in Stark County (10) is smaller than the US average (15). Major Disasters (Presidential) Declared: 6 Emergencies Declared: 3
Causes of natural disasters: Floods: 6, Storms: 5, Tornadoes: 3, Snowstorms: 2, Winds: 2, Blizzard: 1, Hurricane: 1, Mudslide: 1, Winter Storm: 1, Other: 1 (Note: some incidents may be assigned to more than one category).
Hospitals and medical centers in Louisville:
VOCA OF OHIO/LESH-MILLVALE (4230 LESH AVENUE NE)
ALTERCARE OF LOUISVILLE (7121 WEST ST FRANCIS STREET NE)
GREEN MEADOWS HLTH AND WELLNESS CTR (7770 COLUMBUS ROAD NE)
LOUISVILLE CTR FOR REHAB AND NSG CARE INC (7187 ST FRANCIS STREET, NE)
MILLER CARE CENTER INC (11701 LOUISVILLE STREET NE)
OAKHILL MANOR CARE CENTER (4466 LYNNHAVEN AVENUE NE)
SAINT JOSEPH CARE CENTER (2308 RENO DRIVE NE)
ST JOSEPH HOSPICE (2308 RENO DR)
Airports located in Louisville:
Yoder Airport (1OA7) (Runways: 1, Itinerant Ops: 504, Local Ops: 1,584, Military Ops: 20)
Notable locations in Louisville: Louisville Fire Department (A), Nimishillen Township Fire Department Station 1 (B), Louisville City Hall (C), Louisville Public Library (D). Display/hide their locations on the map
Churches in Louisville include: Louisville United Brethren Church (A), Saint Louis Catholic Church (B), First Brethren Church (C), Gospel Tabernacle (D), Paradise United Church of Christ (E). Display/hide their locations on the map
Parks in Louisville include: Constitution Park (1), Wilson Park (2), Wildwood Park (3), Board Street Park (4), Metzger Park (5). Display/hide their locations on the map
Birthplace of: Joseph Gabriel Harner - Navy Medal of Honor recipient.
Stark County has a predicted average indoor radon screening level greater than 4 pCi/L (pico curies per liter) - Highest Potential
Drinking water stations with addresses in Louisville and their reported violations in the past:
THE CHAPEL IN MARLBORO (Population served: 800, Groundwater):
Past health violations:
MCL, Monthly (TCR) - Between OCT-2007 and DEC-2007, Contaminant: Coliform. Follow-up actions: St Public Notif requested (DEC-05-2007), St Violation/Reminder Notice (DEC-05-2007), St Compliance achieved (NOV-13-2008), St Public Notif received (MAY-14-2009)
NORTH PLAZA-HARTVILLE (Address: 1904 W MAIN ST , Population served: 235, Groundwater):
Past health violations:
MCL, Monthly (TCR) - In SEP-2013, Contaminant: Coliform. Follow-up actions: St Violation/Reminder Notice (SEP-11-2013), St Public Notif requested (SEP-11-2013)
MCL, Monthly (TCR) - Between JUL-2010 and SEP-2010, Contaminant: Coliform. Follow-up actions: St Violation/Reminder Notice (SEP-21-2010), St Public Notif requested (SEP-21-2010), St Public Notif received (JUL-12-2011), St Compliance achieved (AUG-16-2011)
MCL, Monthly (TCR) - In JUL-2008, Contaminant: Coliform. Follow-up actions: St Violation/Reminder Notice (JUL-28-2008), St Public Notif requested (JUL-28-2008), St Public Notif received (JUL-12-2011), St Compliance achieved (FEB-09-2012)
MCL, Monthly (TCR) - Between JUL-2011 and SEP-2011, Contaminant: Coliform. Follow-up actions: St Public Notif requested (JUL-20-2011), St Violation/Reminder Notice (JUL-20-2011), St Public Notif received (DEC-05-2011)
Past monitoring violations:
One regular monitoring violation
THOMPSONS DAIRY LAND (Population served: 132, Groundwater):
Past monitoring violations:
One routine major monitoring violation
SACRED HEART OF MARY PARISH (Population served: 130, Groundwater):
Past monitoring violations:
One routine major monitoring violation
One regular monitoring violation
HOT LAPS SPORTS BAR, INC. (Population served: 50, Groundwater):
Past monitoring violations:
One routine major monitoring violation
VFW POST 7490 (Population served: 43, Groundwater):
Past monitoring violations:
6 routine major monitoring violations
One regular monitoring violation
Drinking water stations with addresses in Louisville that have no violations reported:
PELICANS COVE (Population served: 60,Primary Water Source Type: Groundwater)
LAKE PNA SPORTSMAN CLUB PWS (Population served: 30,Primary Water Source Type: Groundwater)
Average household size:
This city:
2.4 people
Ohio:
2.4 people
Percentage of family households:
This city:
67.0%
Whole state:
65.0%
Percentage of households with unmarried partners:
This city:
6.3%
Whole state:
6.8%
Likely homosexual households (counted as self-reported same-sex unmarried-partner households)
Lesbian couples: 0.2% of all households
Gay men: 0.1% of all households
99 people in nursing facilities/skilled-nursing facilities in 2010
2 people in workers' group living quarters and job corps centers in 2010
138 people in nursing homes in 2000
18 people in homes for the mentally retarded in 2000
Banks with branches in Louisville (2011 data):
Consumers National Bank: Louisville Office Branch at 1111 North Chapel Street, branch established on 2000/02/07. Info updated 2006/11/03: Bank assets: $311.4 mil, Deposits: $263.3 mil, headquarters in Minerva, OH, positive income, Commercial Lending Specialization, 11 total offices, Holding Company: Consumers Bancorp, Inc.
Firstmerit Bank, National Association: Louisville Branch at 308 East Gorgas Street, branch established on 1899/01/01. Info updated 2010/05/17: Bank assets: $14,420.6 mil, Deposits: $11,497.6 mil, headquarters in Akron, OH, positive income, Commercial Lending Specialization, 213 total offices, Holding Company: Firstmerit Corporation
RBS Citizens, National Association: Louisville at 315 East Main Street, branch established on 1887/01/01. Info updated 2007/09/19: Bank assets: $106,940.6 mil, Deposits: $75,690.2 mil, headquarters in Providence, RI, positive income, 1135 total offices, Holding Company: Uk Financial Investments Limited
KeyBank National Association: Louisville Branch at 214 South Chapel Boulevard, branch established on 1961/07/17. Info updated 2008/03/03: Bank assets: $86,198.8 mil, Deposits: $64,214.8 mil, headquarters in Cleveland, OH, positive income, Commercial Lending Specialization, 1067 total offices, Holding Company: Keycorp
JPMorgan Chase Bank, National Association: Louisville Branch at 123 West Main Street, branch established on 1969/12/04. Info updated 2011/11/10: Bank assets: $1,811,678.0 mil, Deposits: $1,190,738.0 mil, headquarters in Columbus, OH, positive income, International Specialization, 5577 total offices, Holding Company: Jpmorgan Chase & Co.
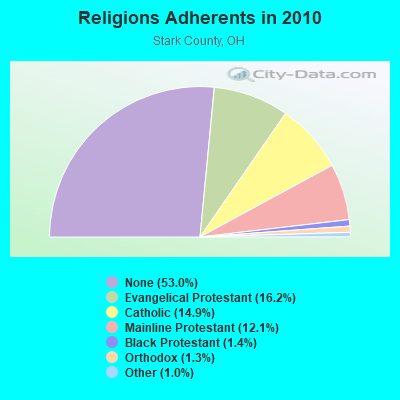
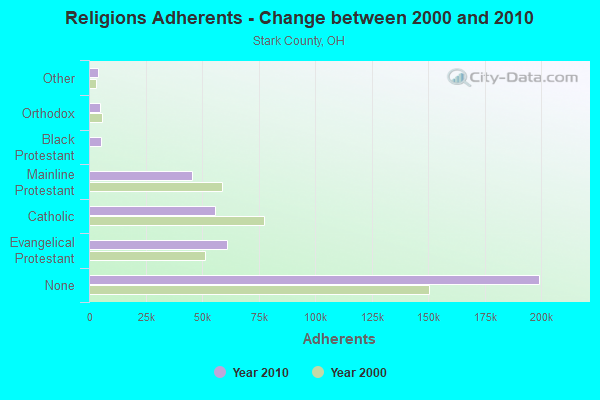
Religion statistics for Louisville, OH (based on Stark County data)
Religion
Adherents
Congregations
Evangelical Protestant
60,957
224
Catholic
55,831
28
Mainline Protestant
45,340
127
Black Protestant
5,327
25
Orthodox
5,014
8
Other
3,929
24
None
199,188
-
Source: Clifford Grammich, Kirk Hadaway, Richard Houseal, Dale E.Jones, Alexei Krindatch, Richie Stanley and Richard H.Taylor. 2012. 2010 U.S.Religion Census: Religious Congregations & Membership Study. Association of Statisticians of American Religious Bodies. Jones, Dale E., et al. 2002. Congregations and Membership in the United States 2000. Nashville, TN: Glenmary Research Center. Graphs represent county-level data
Aircraft: CESSNA 172M (Category: Land, Seats: 4, Weight: Up to 12,499 Pounds, Speed: 108 mph), Engine: LYCOMING 0-320 SERIES (180 HP) (4 Cycle) N-Number: 12556, N12556, N-12556, Serial Number: 17262069, Year manufactured: 1973, Airworthiness Date: 08/29/1973, Certificate Issue Date: 09/20/2016 Registrant (Individual): William T White, 315 Shawnee Cir, Louisville, OH 44641
Aircraft: AVIAN BALLOON SKYHAWK (Category: Land, Seats: 4, Weight: Up to 12,499 Pounds), Engine: AMA/EXPR UNKNOWN ENG (None) N-Number: 2092B, N2092B, N-2092B, Serial Number: 210, Year manufactured: 2000, Airworthiness Date: 05/17/2000, Certificate Issue Date: 09/09/2011 Registrant (LLC): Wind Trek Hot Air Balloon LLC, 525 Buffalo Ridge St, Louisville, OH 44641
Aircraft: CESSNA 172S (Category: Land, Seats: 4, Weight: Up to 12,499 Pounds), Engine: LYCOMING IO-360-L2A (180 HP) (Reciprocating) N-Number: 2121F, N2121F, N-2121F, Serial Number: 172S10437, Year manufactured: 2007, Airworthiness Date: 02/12/2007, Certificate Issue Date: 04/09/2007 Registrant (Individual): Dale W Marks, 6215 California Ave, Louisville, OH 44641
Aircraft: PIPER PA-23-160 (Category: Land, Engines: 2, Seats: 5, Weight: Up to 12,499 Pounds, Speed: 150 mph), Engine: LYCOMING 0-320 SERIES (180 HP) (Reciprocating) N-Number: 4264P, N4264P, N-4264P, Serial Number: 23-1763, Year manufactured: 1961, Airworthiness Date: 09/05/1961, Certificate Issue Date: 07/23/1992 Registrant (Individual): John S Fergason, 11625 Louisville St, Louisville, OH 44641
Aircraft: BALONY KUBICEK SPOL SRO BB26Z (Category: Land, Weight: Up to 12,499 Pounds), Engine: None N-Number: 703FN, N703FN, N-703FN, Serial Number: 942, Year manufactured: 2012, Airworthiness Date: 07/17/2012, Certificate Issue Date: 07/18/2012 Registrant (Individual): Kyle R Farber, 1326 Meese Rd, Louisville, OH 44641
Aircraft: AERONCA 7AC (Category: Land, Seats: 2, Weight: Up to 12,499 Pounds, Speed: 90 mph), Engine: CONT MOTOR A&C65 SERIES (65 HP) (Reciprocating) N-Number: 85590, N85590, N-85590, Serial Number: 7AC-4333, Airworthiness Date: 10/03/1957, Certificate Issue Date: 03/23/2019 Registrant (Individual): Dale H Newton, 8594 Saint Peters Church Rd, Louisville, OH 44641 Deregistered:Cancel Date: 01/26/2018
Aircraft: MATHIE MATTHEW A QUICKSILVER SPORT II (Category: Land, Seats: 2, Weight: Up to 12,499 Pounds), Engine: ROTAX 503 SERIES (52 HP) (2 Cycle) N-Number: 65010, N65010, N-65010, Serial Number: 844, Year manufactured: 2001, Airworthiness Date: 06/16/2007, Certificate Issue Date: 03/19/2007 Registrant (Individual): Matthew A Mathie, 5178 Columbus Rd, Louisville, OH 44641 Deregistered:Cancel Date: 07/10/2020
Home Mortgage Disclosure Act Aggregated Statistics For Year 2009 (Based on 3 partial tracts)
A) FHA, FSA/RHS & VA Home Purchase Loans
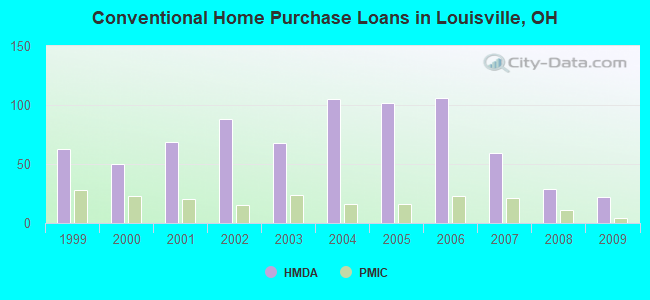
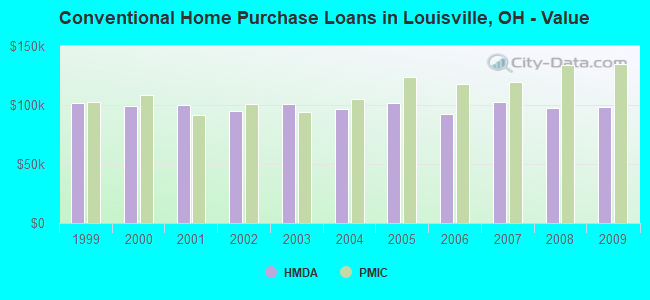
B) Conventional Home Purchase Loans
C) Refinancings
D) Home Improvement Loans
F) Non-occupant Loans on < 5 Family Dwellings (A B C & D)
G) Loans On Manufactured Home Dwelling (A B C & D)
Number
Average Value
Number
Average Value
Number
Average Value
Number
Average Value
Number
Average Value
Number
Average Value
LOANS ORIGINATED
40
$112,392
22
$98,297
90
$128,508
3
$10,770
7
$83,930
1
$43,670
APPLICATIONS APPROVED, NOT ACCEPTED
1
$149,230
1
$104,460
7
$109,833
0
$0
0
$0
0
$0
APPLICATIONS DENIED
2
$53,040
4
$83,442
34
$115,046
6
$11,058
2
$51,685
1
$78,330
APPLICATIONS WITHDRAWN
2
$143,125
2
$169,070
13
$133,478
1
$10,080
0
$0
0
$0
FILES CLOSED FOR INCOMPLETENESS
0
$0
0
$0
4
$87,648
0
$0
0
$0
0
$0
Aggregated Statistics For Year 2008 (Based on 3 partial tracts)
A) FHA, FSA/RHS & VA Home Purchase Loans
B) Conventional Home Purchase Loans
C) Refinancings
D) Home Improvement Loans
E) Loans on Dwellings For 5+ Families
F) Non-occupant Loans on < 5 Family Dwellings (A B C & D)
G) Loans On Manufactured Home Dwelling (A B C & D)
Number
Average Value
Number
Average Value
Number
Average Value
Number
Average Value
Number
Average Value
Number
Average Value
Number
Average Value
LOANS ORIGINATED
28
$104,624
29
$97,661
55
$105,130
5
$25,780
0
$0
9
$65,858
1
$12,840
APPLICATIONS APPROVED, NOT ACCEPTED
1
$89,550
3
$129,510
10
$133,679
2
$12,100
0
$0
0
$0
0
$0
APPLICATIONS DENIED
3
$86,350
5
$75,706
42
$119,874
6
$49,957
0
$0
2
$86,190
0
$0
APPLICATIONS WITHDRAWN
3
$122,997
4
$57,872
12
$136,335
1
$85,620
1
$198,640
2
$73,250
0
$0
FILES CLOSED FOR INCOMPLETENESS
0
$0
1
$112,160
5
$108,466
0
$0
0
$0
2
$91,475
0
$0
Aggregated Statistics For Year 2007 (Based on 3 partial tracts)
A) FHA, FSA/RHS & VA Home Purchase Loans
B) Conventional Home Purchase Loans
C) Refinancings
D) Home Improvement Loans
E) Loans on Dwellings For 5+ Families
F) Non-occupant Loans on < 5 Family Dwellings (A B C & D)
G) Loans On Manufactured Home Dwelling (A B C & D)
Number
Average Value
Number
Average Value
Number
Average Value
Number
Average Value
Number
Average Value
Number
Average Value
Number
Average Value
LOANS ORIGINATED
12
$121,521
59
$102,326
76
$98,822
12
$54,031
1
$200,350
9
$77,391
1
$78,730
APPLICATIONS APPROVED, NOT ACCEPTED
2
$74,815
8
$97,111
25
$103,545
3
$13,920
0
$0
0
$0
0
$0
APPLICATIONS DENIED
2
$72,825
8
$89,661
67
$111,224
27
$51,171
0
$0
5
$63,616
0
$0
APPLICATIONS WITHDRAWN
2
$100,325
5
$117,424
23
$99,682
5
$90,068
1
$164,390
1
$45,440
0
$0
FILES CLOSED FOR INCOMPLETENESS
1
$73,940
0
$0
10
$95,849
1
$110,910
0
$0
2
$35,420
1
$72,600
Aggregated Statistics For Year 2006 (Based on 3 partial tracts)
A) FHA, FSA/RHS & VA Home Purchase Loans
B) Conventional Home Purchase Loans
C) Refinancings
D) Home Improvement Loans
F) Non-occupant Loans on < 5 Family Dwellings (A B C & D)
G) Loans On Manufactured Home Dwelling (A B C & D)
Number
Average Value
Number
Average Value
Number
Average Value
Number
Average Value
Number
Average Value
Number
Average Value
LOANS ORIGINATED
14
$111,446
106
$92,494
86
$92,575
21
$27,502
20
$90,068
0
$0
APPLICATIONS APPROVED, NOT ACCEPTED
2
$82,610
8
$118,286
19
$97,662
3
$13,193
1
$47,090
1
$31,590
APPLICATIONS DENIED
3
$98,847
16
$86,002
82
$93,164
18
$56,751
4
$67,632
1
$30,880
APPLICATIONS WITHDRAWN
1
$49,070
12
$80,688
36
$97,539
4
$37,468
2
$69,785
0
$0
FILES CLOSED FOR INCOMPLETENESS
0
$0
2
$117,500
14
$123,569
2
$66,455
0
$0
0
$0
Aggregated Statistics For Year 2005 (Based on 3 partial tracts)
A) FHA, FSA/RHS & VA Home Purchase Loans
B) Conventional Home Purchase Loans
C) Refinancings
D) Home Improvement Loans
E) Loans on Dwellings For 5+ Families
F) Non-occupant Loans on < 5 Family Dwellings (A B C & D)
G) Loans On Manufactured Home Dwelling (A B C & D)
Number
Average Value
Number
Average Value
Number
Average Value
Number
Average Value
Number
Average Value
Number
Average Value
Number
Average Value
LOANS ORIGINATED
10
$104,786
102
$101,376
120
$100,071
14
$45,809
1
$410,120
15
$70,720
0
$0
APPLICATIONS APPROVED, NOT ACCEPTED
0
$0
9
$74,252
27
$103,226
5
$81,730
0
$0
1
$48,800
2
$34,880
APPLICATIONS DENIED
0
$0
15
$80,377
82
$111,785
19
$47,551
0
$0
5
$47,408
1
$63,280
APPLICATIONS WITHDRAWN
1
$131,960
6
$110,292
60
$110,725
6
$108,693
0
$0
3
$90,423
0
$0
FILES CLOSED FOR INCOMPLETENESS
0
$0
3
$84,690
20
$117,349
0
$0
0
$0
2
$54,795
0
$0
Aggregated Statistics For Year 2004 (Based on 3 partial tracts)
A) FHA, FSA/RHS & VA Home Purchase Loans
B) Conventional Home Purchase Loans
C) Refinancings
D) Home Improvement Loans
E) Loans on Dwellings For 5+ Families
F) Non-occupant Loans on < 5 Family Dwellings (A B C & D)
G) Loans On Manufactured Home Dwelling (A B C & D)
Number
Average Value
Number
Average Value
Number
Average Value
Number
Average Value
Number
Average Value
Number
Average Value
Number
Average Value
LOANS ORIGINATED
12
$113,535
105
$96,562
140
$93,623
13
$34,521
2
$479,950
24
$79,258
1
$42,280
APPLICATIONS APPROVED, NOT ACCEPTED
0
$0
10
$91,668
37
$102,114
3
$8,963
1
$204,630
3
$69,460
0
$0
APPLICATIONS DENIED
0
$0
6
$81,388
76
$95,836
16
$29,533
1
$139,820
1
$80,480
2
$7,460
APPLICATIONS WITHDRAWN
2
$76,965
7
$103,426
50
$106,936
6
$55,280
0
$0
3
$46,913
0
$0
FILES CLOSED FOR INCOMPLETENESS
0
$0
3
$135,113
19
$103,856
1
$16,270
0
$0
0
$0
0
$0
Aggregated Statistics For Year 2003 (Based on 3 partial tracts)
A) FHA, FSA/RHS & VA Home Purchase Loans
B) Conventional Home Purchase Loans
C) Refinancings
D) Home Improvement Loans
E) Loans on Dwellings For 5+ Families
F) Non-occupant Loans on < 5 Family Dwellings (A B C & D)
Number
Average Value
Number
Average Value
Number
Average Value
Number
Average Value
Number
Average Value
Number
Average Value
LOANS ORIGINATED
19
$112,548
68
$100,868
316
$98,619
13
$18,025
0
$0
28
$85,113
APPLICATIONS APPROVED, NOT ACCEPTED
0
$0
3
$58,923
49
$95,530
2
$20,195
0
$0
3
$61,817
APPLICATIONS DENIED
3
$96,490
9
$109,812
106
$94,898
12
$12,291
0
$0
10
$81,453
APPLICATIONS WITHDRAWN
0
$0
5
$128,730
46
$92,125
2
$16,225
1
$147,880
2
$93,100
FILES CLOSED FOR INCOMPLETENESS
0
$0
1
$68,560
14
$102,555
1
$24,110
0
$0
0
$0
Aggregated Statistics For Year 2002 (Based on 3 partial tracts)
A) FHA, FSA/RHS & VA Home Purchase Loans
B) Conventional Home Purchase Loans
C) Refinancings
D) Home Improvement Loans
F) Non-occupant Loans on < 5 Family Dwellings (A B C & D)
Number
Average Value
Number
Average Value
Number
Average Value
Number
Average Value
Number
Average Value
LOANS ORIGINATED
13
$107,758
88
$95,325
206
$100,470
13
$13,744
23
$108,190
APPLICATIONS APPROVED, NOT ACCEPTED
0
$0
4
$120,905
38
$98,907
4
$21,742
2
$88,660
APPLICATIONS DENIED
0
$0
2
$75,105
82
$97,610
8
$11,234
1
$73,590
APPLICATIONS WITHDRAWN
1
$54,450
9
$108,803
52
$109,433
2
$37,640
1
$67,080
FILES CLOSED FOR INCOMPLETENESS
0
$0
2
$112,235
10
$92,197
0
$0
0
$0
Aggregated Statistics For Year 2001 (Based on 3 partial tracts)
A) FHA, FSA/RHS & VA Home Purchase Loans
B) Conventional Home Purchase Loans
C) Refinancings
D) Home Improvement Loans
F) Non-occupant Loans on < 5 Family Dwellings (A B C & D)
Number
Average Value
Number
Average Value
Number
Average Value
Number
Average Value
Number
Average Value
LOANS ORIGINATED
24
$96,612
69
$100,083
193
$96,102
13
$20,446
20
$82,456
APPLICATIONS APPROVED, NOT ACCEPTED
1
$72,600
3
$63,617
34
$87,070
5
$26,240
2
$50,135
APPLICATIONS DENIED
0
$0
8
$92,305
90
$89,435
9
$8,646
2
$36,225
APPLICATIONS WITHDRAWN
2
$93,770
2
$69,355
42
$89,138
0
$0
2
$121,535
FILES CLOSED FOR INCOMPLETENESS
1
$56,460
2
$51,840
8
$111,318
0
$0
0
$0
Aggregated Statistics For Year 2000 (Based on 3 partial tracts)
A) FHA, FSA/RHS & VA Home Purchase Loans
B) Conventional Home Purchase Loans
C) Refinancings
D) Home Improvement Loans
F) Non-occupant Loans on < 5 Family Dwellings (A B C & D)
Number
Average Value
Number
Average Value
Number
Average Value
Number
Average Value
Number
Average Value
LOANS ORIGINATED
16
$88,530
50
$99,052
58
$73,536
15
$14,646
7
$71,054
APPLICATIONS APPROVED, NOT ACCEPTED
0
$0
3
$86,267
22
$64,406
5
$7,764
0
$0
APPLICATIONS DENIED
3
$74,583
10
$86,392
50
$83,830
13
$13,997
1
$117,300
APPLICATIONS WITHDRAWN
2
$88,765
4
$76,200
22
$76,932
2
$41,980
2
$36,785
FILES CLOSED FOR INCOMPLETENESS
0
$0
1
$86,040
9
$92,932
0
$0
1
$84,760
Aggregated Statistics For Year 1999 (Based on 3 partial tracts)
A) FHA, FSA/RHS & VA Home Purchase Loans
B) Conventional Home Purchase Loans
C) Refinancings
D) Home Improvement Loans
F) Non-occupant Loans on < 5 Family Dwellings (A B C & D)
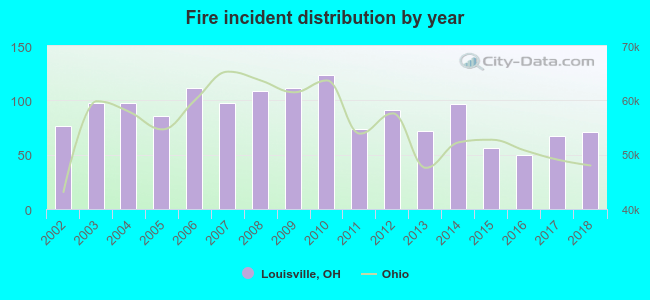
2002 - 2018 National Fire Incident Reporting System (NFIRS) incidents
According to the data from the years 2002 - 2018 the average number of fire incidents per year is 88. The highest number of reported fire incidents - 123 took place in 2010, and the least - 50 in 2016. The data has a dropping trend.
When looking into fire subcategories, the most incidents belonged to: Structure Fires (47.2%), and Outside Fires (38.6%).
Fire incident types reported to NFIRS in Louisville, OH


 Recent articles from our blog. Our writers, many of them Ph.D. graduates or candidates, create easy-to-read articles on a wide variety of topics.

 (6.5 miles
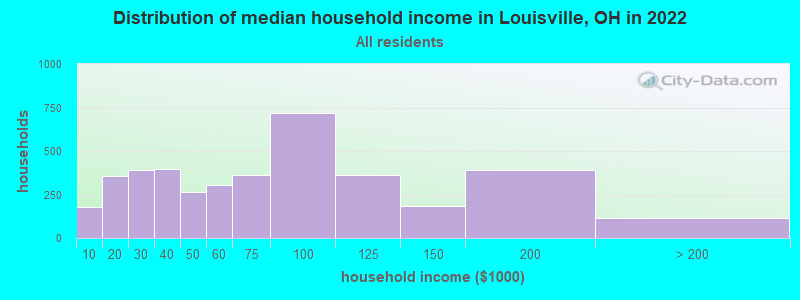


 According to the data from the years 2002 - 2018 the average number of fire incidents per year is 88. The highest number of reported fire incidents - 123 took place in 2010, and the least - 50 in 2016. The data has a dropping trend.
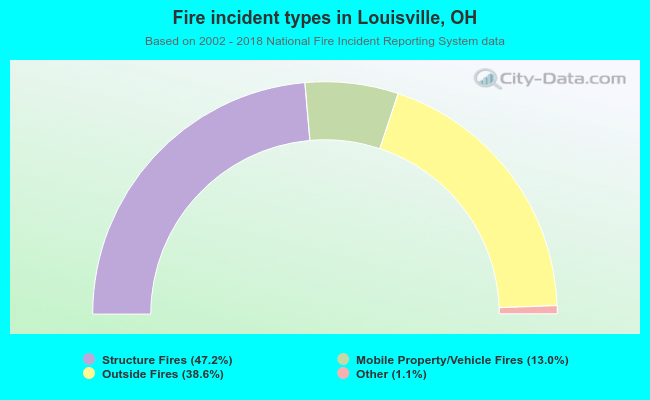 When looking into fire subcategories, the most incidents belonged to: Structure Fires (47.2%), and Outside Fires (38.6%).