Highland Village, Texas Submit your own pictures of this city and show them to the world
OSM Map
General Map
Google Map
MSN Map
OSM Map
General Map
Google Map
MSN Map
OSM Map
General Map
Google Map
MSN Map
OSM Map
General Map
Google Map
MSN Map
Please wait while loading the map...
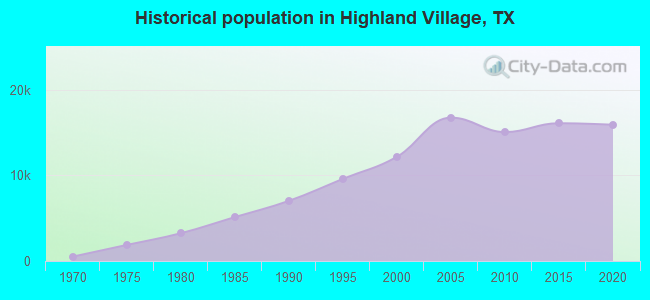
Population in 2022: 16,105 (100% urban, 0% rural). Population change since 2000: +32.3%Males: 8,440 Females: 7,665
March 2022 cost of living index in Highland Village: 97.0 (near average, U.S. average is 100) Percentage of residents living in poverty in 2022: 1.8%for White Non-Hispanic residents , 16.3% for Black residents , 3.3% for Hispanic or Latino residents , 1.9% for two or more races residents )
Profiles of local businesses
Business Search - 14 Million verified businesses
Data:
Median household income ($)
Median household income (% change since 2000)
Household income diversity
Ratio of average income to average house value (%)
Ratio of average income to average rent
Median household income ($) - White
Median household income ($) - Black or African American
Median household income ($) - Asian
Median household income ($) - Hispanic or Latino
Median household income ($) - American Indian and Alaska Native
Median household income ($) - Multirace
Median household income ($) - Other Race
Median household income for houses/condos with a mortgage ($)
Median household income for apartments without a mortgage ($)
Races - White alone (%)
Races - White alone (% change since 2000)
Races - Black alone (%)
Races - Black alone (% change since 2000)
Races - American Indian alone (%)
Races - American Indian alone (% change since 2000)
Races - Asian alone (%)
Races - Asian alone (% change since 2000)
Races - Hispanic (%)
Races - Hispanic (% change since 2000)
Races - Native Hawaiian and Other Pacific Islander alone (%)
Races - Native Hawaiian and Other Pacific Islander alone (% change since 2000)
Races - Two or more races (%)
Races - Two or more races (% change since 2000)
Races - Other race alone (%)
Races - Other race alone (% change since 2000)
Racial diversity
Unemployment (%)
Unemployment (% change since 2000)
Unemployment (%) - White
Unemployment (%) - Black or African American
Unemployment (%) - Asian
Unemployment (%) - Hispanic or Latino
Unemployment (%) - American Indian and Alaska Native
Unemployment (%) - Multirace
Unemployment (%) - Other Race
Population density (people per square mile)
Population - Males (%)
Population - Females (%)
Population - Males (%) - White
Population - Males (%) - Black or African American
Population - Males (%) - Asian
Population - Males (%) - Hispanic or Latino
Population - Males (%) - American Indian and Alaska Native
Population - Males (%) - Multirace
Population - Males (%) - Other Race
Population - Females (%) - White
Population - Females (%) - Black or African American
Population - Females (%) - Asian
Population - Females (%) - Hispanic or Latino
Population - Females (%) - American Indian and Alaska Native
Population - Females (%) - Multirace
Population - Females (%) - Other Race
Coronavirus confirmed cases (May 28, 2024)
Deaths caused by coronavirus (May 28, 2024)
Coronavirus confirmed cases (per 100k population) (May 28, 2024)
Deaths caused by coronavirus (per 100k population) (May 28, 2024)
Daily increase in number of cases (May 28, 2024)
Weekly increase in number of cases (May 28, 2024)
Cases doubled (in days) (May 28, 2024)
Hospitalized patients (Apr 18, 2022)
Negative test results (Apr 18, 2022)
Total test results (Apr 18, 2022)
COVID Vaccine doses distributed (per 100k population) (Sep 19, 2023)
COVID Vaccine doses administered (per 100k population) (Sep 19, 2023)
COVID Vaccine doses distributed (Sep 19, 2023)
COVID Vaccine doses administered (Sep 19, 2023)
Likely homosexual households (%)
Likely homosexual households (% change since 2000)
Likely homosexual households - Lesbian couples (%)
Likely homosexual households - Lesbian couples (% change since 2000)
Likely homosexual households - Gay men (%)
Likely homosexual households - Gay men (% change since 2000)
Cost of living index
Median gross rent ($)
Median contract rent ($)
Median monthly housing costs ($)
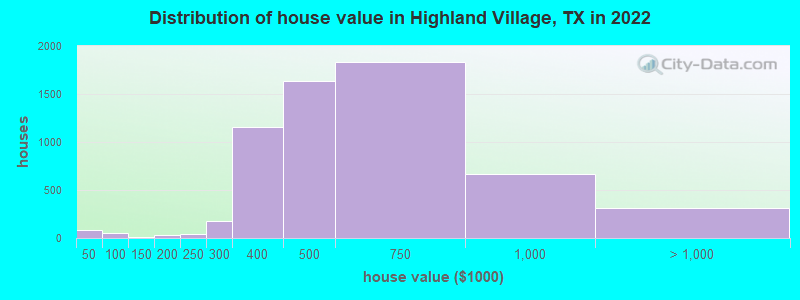
Median house or condo value ($)
Median house or condo value ($ change since 2000)
Mean house or condo value by units in structure - 1, detached ($)
Mean house or condo value by units in structure - 1, attached ($)
Mean house or condo value by units in structure - 2 ($)
Mean house or condo value by units in structure by units in structure - 3 or 4 ($)
Mean house or condo value by units in structure - 5 or more ($)
Mean house or condo value by units in structure - Boat, RV, van, etc. ($)
Mean house or condo value by units in structure - Mobile home ($)
Median house or condo value ($) - White
Median house or condo value ($) - Black or African American
Median house or condo value ($) - Asian
Median house or condo value ($) - Hispanic or Latino
Median house or condo value ($) - American Indian and Alaska Native
Median house or condo value ($) - Multirace
Median house or condo value ($) - Other Race
Median resident age
Resident age diversity
Median resident age - Males
Median resident age - Females
Median resident age - White
Median resident age - Black or African American
Median resident age - Asian
Median resident age - Hispanic or Latino
Median resident age - American Indian and Alaska Native
Median resident age - Multirace
Median resident age - Other Race
Median resident age - Males - White
Median resident age - Males - Black or African American
Median resident age - Males - Asian
Median resident age - Males - Hispanic or Latino
Median resident age - Males - American Indian and Alaska Native
Median resident age - Males - Multirace
Median resident age - Males - Other Race
Median resident age - Females - White
Median resident age - Females - Black or African American
Median resident age - Females - Asian
Median resident age - Females - Hispanic or Latino
Median resident age - Females - American Indian and Alaska Native
Median resident age - Females - Multirace
Median resident age - Females - Other Race
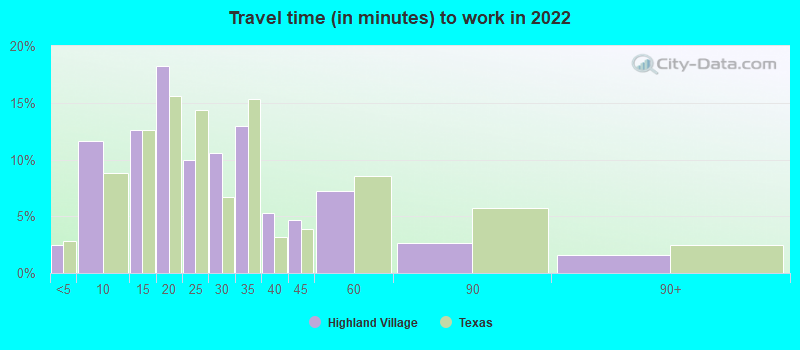
Commute - mean travel time to work (minutes)
Travel time to work - Less than 5 minutes (%)
Travel time to work - Less than 5 minutes (% change since 2000)
Travel time to work - 5 to 9 minutes (%)
Travel time to work - 5 to 9 minutes (% change since 2000)
Travel time to work - 10 to 19 minutes (%)
Travel time to work - 10 to 19 minutes (% change since 2000)
Travel time to work - 20 to 29 minutes (%)
Travel time to work - 20 to 29 minutes (% change since 2000)
Travel time to work - 30 to 39 minutes (%)
Travel time to work - 30 to 39 minutes (% change since 2000)
Travel time to work - 40 to 59 minutes (%)
Travel time to work - 40 to 59 minutes (% change since 2000)
Travel time to work - 60 to 89 minutes (%)
Travel time to work - 60 to 89 minutes (% change since 2000)
Travel time to work - 90 or more minutes (%)
Travel time to work - 90 or more minutes (% change since 2000)
Marital status - Never married (%)
Marital status - Now married (%)
Marital status - Separated (%)
Marital status - Widowed (%)
Marital status - Divorced (%)
Median family income ($)
Median family income (% change since 2000)
Median non-family income ($)
Median non-family income (% change since 2000)
Median per capita income ($)
Median per capita income (% change since 2000)
Median family income ($) - White
Median family income ($) - Black or African American
Median family income ($) - Asian
Median family income ($) - Hispanic or Latino
Median family income ($) - American Indian and Alaska Native
Median family income ($) - Multirace
Median family income ($) - Other Race
Median year house/condo built
Median year apartment built
Year house built - Built 2005 or later (%)
Year house built - Built 2000 to 2004 (%)
Year house built - Built 1990 to 1999 (%)
Year house built - Built 1980 to 1989 (%)
Year house built - Built 1970 to 1979 (%)
Year house built - Built 1960 to 1969 (%)
Year house built - Built 1950 to 1959 (%)
Year house built - Built 1940 to 1949 (%)
Year house built - Built 1939 or earlier (%)
Average household size
Household density (households per square mile)
Average household size - White
Average household size - Black or African American
Average household size - Asian
Average household size - Hispanic or Latino
Average household size - American Indian and Alaska Native
Average household size - Multirace
Average household size - Other Race
Occupied housing units (%)
Vacant housing units (%)
Owner occupied housing units (%)
Renter occupied housing units (%)
Vacancy status - For rent (%)
Vacancy status - For sale only (%)
Vacancy status - Rented or sold, not occupied (%)
Vacancy status - For seasonal, recreational, or occasional use (%)
Vacancy status - For migrant workers (%)
Vacancy status - Other vacant (%)
Residents with income below the poverty level (%)
Residents with income below 50% of the poverty level (%)
Children below poverty level (%)
Poor families by family type - Married-couple family (%)
Poor families by family type - Male, no wife present (%)
Poor families by family type - Female, no husband present (%)
Poverty status for native-born residents (%)
Poverty status for foreign-born residents (%)
Poverty among high school graduates not in families (%)
Poverty among people who did not graduate high school not in families (%)
Residents with income below the poverty level (%) - White
Residents with income below the poverty level (%) - Black or African American
Residents with income below the poverty level (%) - Asian
Residents with income below the poverty level (%) - Hispanic or Latino
Residents with income below the poverty level (%) - American Indian and Alaska Native
Residents with income below the poverty level (%) - Multirace
Residents with income below the poverty level (%) - Other Race
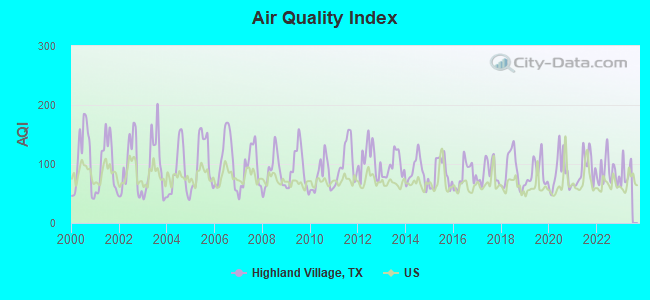
Air pollution - Air Quality Index (AQI)
Air pollution - CO
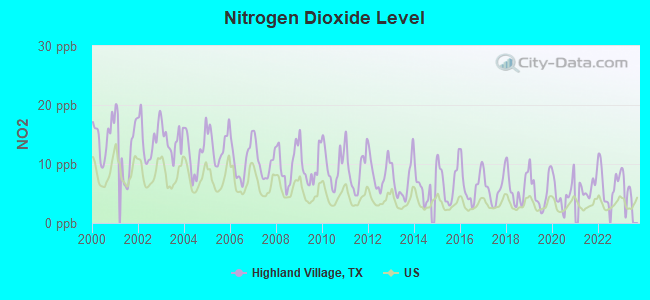
Air pollution - NO2
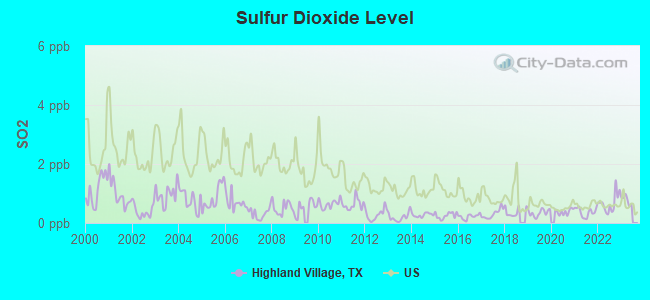
Air pollution - SO2
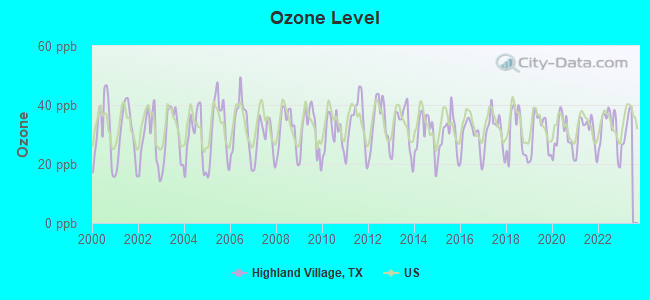
Air pollution - Ozone
Air pollution - PM10
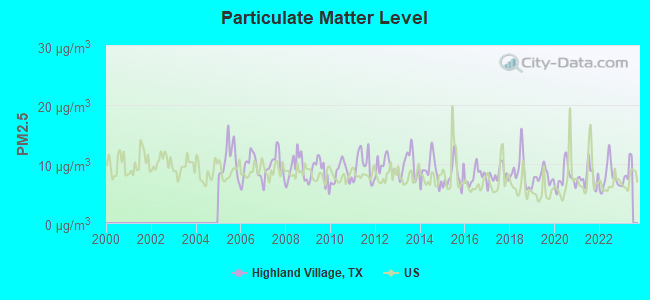
Air pollution - PM25
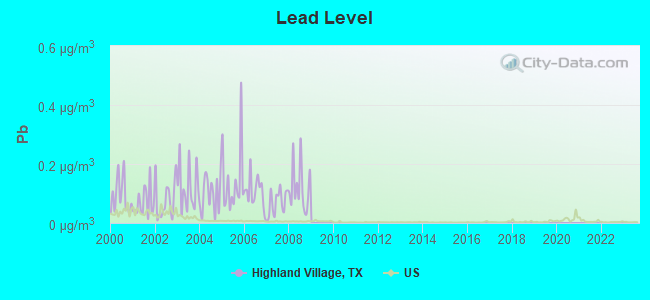
Air pollution - Pb
Crime - Murders per 100,000 population
Crime - Rapes per 100,000 population
Crime - Robberies per 100,000 population
Crime - Assaults per 100,000 population
Crime - Burglaries per 100,000 population
Crime - Thefts per 100,000 population
Crime - Auto thefts per 100,000 population
Crime - Arson per 100,000 population
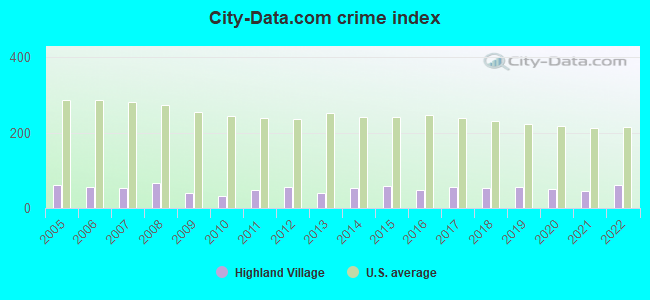
Crime - City-data.com crime index
Crime - Violent crime index
Crime - Property crime index
Crime - Murders per 100,000 population (5 year average)
Crime - Rapes per 100,000 population (5 year average)
Crime - Robberies per 100,000 population (5 year average)
Crime - Assaults per 100,000 population (5 year average)
Crime - Burglaries per 100,000 population (5 year average)
Crime - Thefts per 100,000 population (5 year average)
Crime - Auto thefts per 100,000 population (5 year average)
Crime - Arson per 100,000 population (5 year average)
Crime - City-data.com crime index (5 year average)
Crime - Violent crime index (5 year average)
Crime - Property crime index (5 year average)
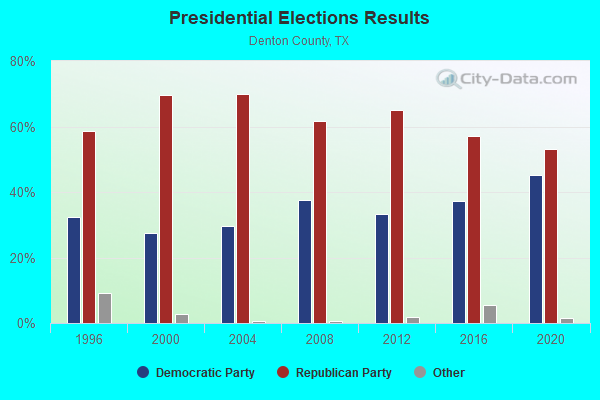
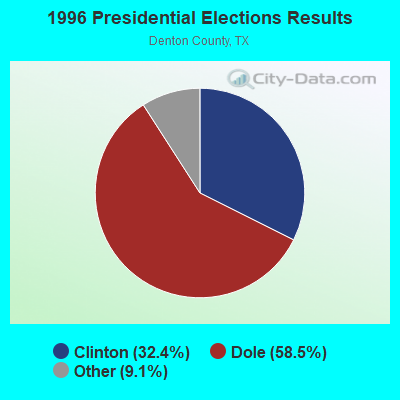
1996 Presidential Elections Results (%) - Democratic Party (Clinton)
1996 Presidential Elections Results (%) - Republican Party (Dole)
1996 Presidential Elections Results (%) - Other
2000 Presidential Elections Results (%) - Democratic Party (Gore)
2000 Presidential Elections Results (%) - Republican Party (Bush)
2000 Presidential Elections Results (%) - Other
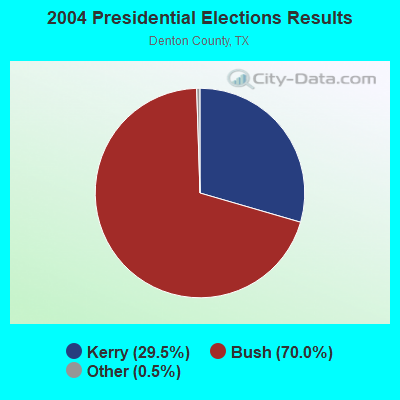
2004 Presidential Elections Results (%) - Democratic Party (Kerry)
2004 Presidential Elections Results (%) - Republican Party (Bush)
2004 Presidential Elections Results (%) - Other
2008 Presidential Elections Results (%) - Democratic Party (Obama)
2008 Presidential Elections Results (%) - Republican Party (McCain)
2008 Presidential Elections Results (%) - Other
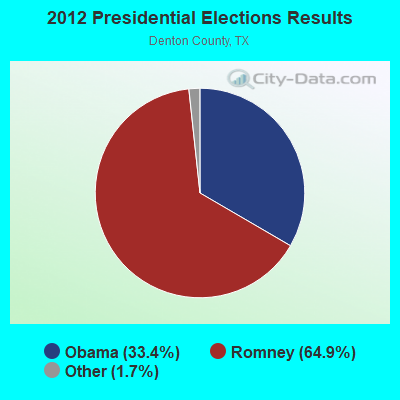
2012 Presidential Elections Results (%) - Democratic Party (Obama)
2012 Presidential Elections Results (%) - Republican Party (Romney)
2012 Presidential Elections Results (%) - Other
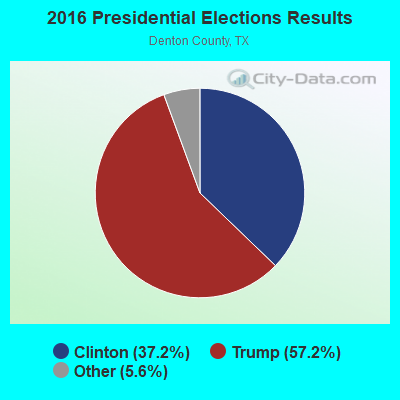
2016 Presidential Elections Results (%) - Democratic Party (Clinton)
2016 Presidential Elections Results (%) - Republican Party (Trump)
2016 Presidential Elections Results (%) - Other
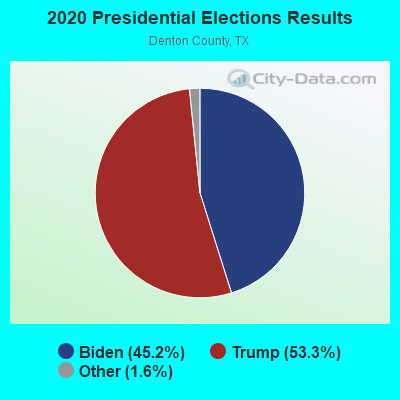
2020 Presidential Elections Results (%) - Democratic Party (Biden)
2020 Presidential Elections Results (%) - Republican Party (Trump)
2020 Presidential Elections Results (%) - Other
Ancestries Reported - Arab (%)
Ancestries Reported - Czech (%)
Ancestries Reported - Danish (%)
Ancestries Reported - Dutch (%)
Ancestries Reported - English (%)
Ancestries Reported - French (%)
Ancestries Reported - French Canadian (%)
Ancestries Reported - German (%)
Ancestries Reported - Greek (%)
Ancestries Reported - Hungarian (%)
Ancestries Reported - Irish (%)
Ancestries Reported - Italian (%)
Ancestries Reported - Lithuanian (%)
Ancestries Reported - Norwegian (%)
Ancestries Reported - Polish (%)
Ancestries Reported - Portuguese (%)
Ancestries Reported - Russian (%)
Ancestries Reported - Scotch-Irish (%)
Ancestries Reported - Scottish (%)
Ancestries Reported - Slovak (%)
Ancestries Reported - Subsaharan African (%)
Ancestries Reported - Swedish (%)
Ancestries Reported - Swiss (%)
Ancestries Reported - Ukrainian (%)
Ancestries Reported - United States (%)
Ancestries Reported - Welsh (%)
Ancestries Reported - West Indian (%)
Ancestries Reported - Other (%)
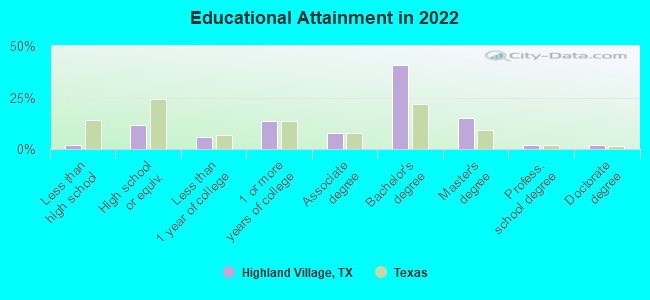
Educational Attainment - No schooling completed (%)
Educational Attainment - Less than high school (%)
Educational Attainment - High school or equivalent (%)
Educational Attainment - Less than 1 year of college (%)
Educational Attainment - 1 or more years of college (%)
Educational Attainment - Associate degree (%)
Educational Attainment - Bachelor's degree (%)
Educational Attainment - Master's degree (%)
Educational Attainment - Professional school degree (%)
Educational Attainment - Doctorate degree (%)
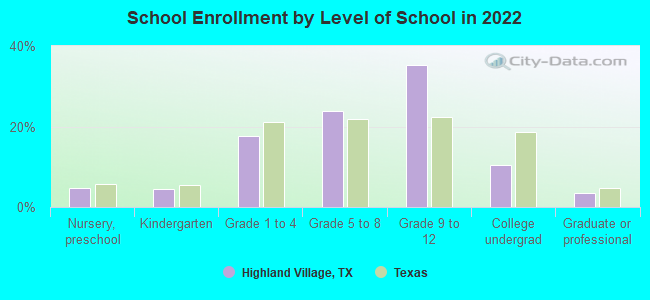
School Enrollment - Nursery, preschool (%)
School Enrollment - Kindergarten (%)
School Enrollment - Grade 1 to 4 (%)
School Enrollment - Grade 5 to 8 (%)
School Enrollment - Grade 9 to 12 (%)
School Enrollment - College undergrad (%)
School Enrollment - Graduate or professional (%)
School Enrollment - Not enrolled in school (%)
School enrollment - Public schools (%)
School enrollment - Private schools (%)
School enrollment - Not enrolled (%)
Median number of rooms in houses and condos
Median number of rooms in apartments
Housing units lacking complete plumbing facilities (%)
Housing units lacking complete kitchen facilities (%)
Density of houses
Urban houses (%)
Rural houses (%)
Households with people 60 years and over (%)
Households with people 65 years and over (%)
Households with people 75 years and over (%)
Households with one or more nonrelatives (%)
Households with no nonrelatives (%)
Population in households (%)
Family households (%)
Nonfamily households (%)
Population in families (%)
Family households with own children (%)
Median number of bedrooms in owner occupied houses
Mean number of bedrooms in owner occupied houses
Median number of bedrooms in renter occupied houses
Mean number of bedrooms in renter occupied houses
Median number of vehichles in owner occupied houses
Mean number of vehichles in owner occupied houses
Median number of vehichles in renter occupied houses
Mean number of vehichles in renter occupied houses
Mortgage status - with mortgage (%)
Mortgage status - with second mortgage (%)
Mortgage status - with home equity loan (%)
Mortgage status - with both second mortgage and home equity loan (%)
Mortgage status - without a mortgage (%)
Average family size
Average family size - White
Average family size - Black or African American
Average family size - Asian
Average family size - Hispanic or Latino
Average family size - American Indian and Alaska Native
Average family size - Multirace
Average family size - Other Race
Geographical mobility - Same house 1 year ago (%)
Geographical mobility - Moved within same county (%)
Geographical mobility - Moved from different county within same state (%)
Geographical mobility - Moved from different state (%)
Geographical mobility - Moved from abroad (%)
Place of birth - Born in state of residence (%)
Place of birth - Born in other state (%)
Place of birth - Native, outside of US (%)
Place of birth - Foreign born (%)
Housing units in structures - 1, detached (%)
Housing units in structures - 1, attached (%)
Housing units in structures - 2 (%)
Housing units in structures - 3 or 4 (%)
Housing units in structures - 5 to 9 (%)
Housing units in structures - 10 to 19 (%)
Housing units in structures - 20 to 49 (%)
Housing units in structures - 50 or more (%)
Housing units in structures - Mobile home (%)
Housing units in structures - Boat, RV, van, etc. (%)
House/condo owner moved in on average (years ago)
Renter moved in on average (years ago)
Year householder moved into unit - Moved in 1999 to March 2000 (%)
Year householder moved into unit - Moved in 1995 to 1998 (%)
Year householder moved into unit - Moved in 1990 to 1994 (%)
Year householder moved into unit - Moved in 1980 to 1989 (%)
Year householder moved into unit - Moved in 1970 to 1979 (%)
Year householder moved into unit - Moved in 1969 or earlier (%)
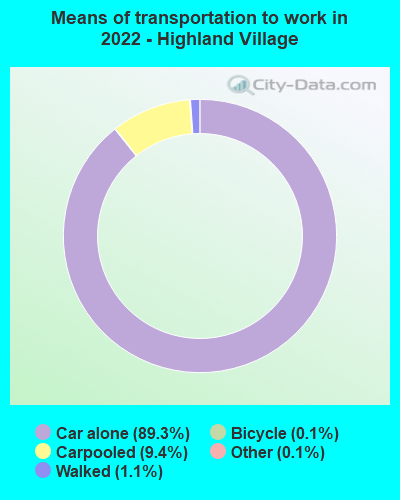
Means of transportation to work - Drove car alone (%)
Means of transportation to work - Carpooled (%)
Means of transportation to work - Public transportation (%)
Means of transportation to work - Bus or trolley bus (%)
Means of transportation to work - Streetcar or trolley car (%)
Means of transportation to work - Subway or elevated (%)
Means of transportation to work - Railroad (%)
Means of transportation to work - Ferryboat (%)
Means of transportation to work - Taxicab (%)
Means of transportation to work - Motorcycle (%)
Means of transportation to work - Bicycle (%)
Means of transportation to work - Walked (%)
Means of transportation to work - Other means (%)
Working at home (%)
Industry diversity
Most Common Industries - Agriculture, forestry, fishing and hunting, and mining (%)
Most Common Industries - Agriculture, forestry, fishing and hunting (%)
Most Common Industries - Mining, quarrying, and oil and gas extraction (%)
Most Common Industries - Construction (%)
Most Common Industries - Manufacturing (%)
Most Common Industries - Wholesale trade (%)
Most Common Industries - Retail trade (%)
Most Common Industries - Transportation and warehousing, and utilities (%)
Most Common Industries - Transportation and warehousing (%)
Most Common Industries - Utilities (%)
Most Common Industries - Information (%)
Most Common Industries - Finance and insurance, and real estate and rental and leasing (%)
Most Common Industries - Finance and insurance (%)
Most Common Industries - Real estate and rental and leasing (%)
Most Common Industries - Professional, scientific, and management, and administrative and waste management services (%)
Most Common Industries - Professional, scientific, and technical services (%)
Most Common Industries - Management of companies and enterprises (%)
Most Common Industries - Administrative and support and waste management services (%)
Most Common Industries - Educational services, and health care and social assistance (%)
Most Common Industries - Educational services (%)
Most Common Industries - Health care and social assistance (%)
Most Common Industries - Arts, entertainment, and recreation, and accommodation and food services (%)
Most Common Industries - Arts, entertainment, and recreation (%)
Most Common Industries - Accommodation and food services (%)
Most Common Industries - Other services, except public administration (%)
Most Common Industries - Public administration (%)
Occupation diversity
Most Common Occupations - Management, business, science, and arts occupations (%)
Most Common Occupations - Management, business, and financial occupations (%)
Most Common Occupations - Management occupations (%)
Most Common Occupations - Business and financial operations occupations (%)
Most Common Occupations - Computer, engineering, and science occupations (%)
Most Common Occupations - Computer and mathematical occupations (%)
Most Common Occupations - Architecture and engineering occupations (%)
Most Common Occupations - Life, physical, and social science occupations (%)
Most Common Occupations - Education, legal, community service, arts, and media occupations (%)
Most Common Occupations - Community and social service occupations (%)
Most Common Occupations - Legal occupations (%)
Most Common Occupations - Education, training, and library occupations (%)
Most Common Occupations - Arts, design, entertainment, sports, and media occupations (%)
Most Common Occupations - Healthcare practitioners and technical occupations (%)
Most Common Occupations - Health diagnosing and treating practitioners and other technical occupations (%)
Most Common Occupations - Health technologists and technicians (%)
Most Common Occupations - Service occupations (%)
Most Common Occupations - Healthcare support occupations (%)
Most Common Occupations - Protective service occupations (%)
Most Common Occupations - Fire fighting and prevention, and other protective service workers including supervisors (%)
Most Common Occupations - Law enforcement workers including supervisors (%)
Most Common Occupations - Food preparation and serving related occupations (%)
Most Common Occupations - Building and grounds cleaning and maintenance occupations (%)
Most Common Occupations - Personal care and service occupations (%)
Most Common Occupations - Sales and office occupations (%)
Most Common Occupations - Sales and related occupations (%)
Most Common Occupations - Office and administrative support occupations (%)
Most Common Occupations - Natural resources, construction, and maintenance occupations (%)
Most Common Occupations - Farming, fishing, and forestry occupations (%)
Most Common Occupations - Construction and extraction occupations (%)
Most Common Occupations - Installation, maintenance, and repair occupations (%)
Most Common Occupations - Production, transportation, and material moving occupations (%)
Most Common Occupations - Production occupations (%)
Most Common Occupations - Transportation occupations (%)
Most Common Occupations - Material moving occupations (%)
People in Group quarters - Institutionalized population (%)
People in Group quarters - Correctional institutions (%)
People in Group quarters - Federal prisons and detention centers (%)
People in Group quarters - Halfway houses (%)
People in Group quarters - Local jails and other confinement facilities (including police lockups) (%)
People in Group quarters - Military disciplinary barracks (%)
People in Group quarters - State prisons (%)
People in Group quarters - Other types of correctional institutions (%)
People in Group quarters - Nursing homes (%)
People in Group quarters - Hospitals/wards, hospices, and schools for the handicapped (%)
People in Group quarters - Hospitals/wards and hospices for chronically ill (%)
People in Group quarters - Hospices or homes for chronically ill (%)
People in Group quarters - Military hospitals or wards for chronically ill (%)
People in Group quarters - Other hospitals or wards for chronically ill (%)
People in Group quarters - Hospitals or wards for drug/alcohol abuse (%)
People in Group quarters - Mental (Psychiatric) hospitals or wards (%)
People in Group quarters - Schools, hospitals, or wards for the mentally retarded (%)
People in Group quarters - Schools, hospitals, or wards for the physically handicapped (%)
People in Group quarters - Institutions for the deaf (%)
People in Group quarters - Institutions for the blind (%)
People in Group quarters - Orthopedic wards and institutions for the physically handicapped (%)
People in Group quarters - Wards in general hospitals for patients who have no usual home elsewhere (%)
People in Group quarters - Wards in military hospitals for patients who have no usual home elsewhere (%)
People in Group quarters - Juvenile institutions (%)
People in Group quarters - Long-term care (%)
People in Group quarters - Homes for abused, dependent, and neglected children (%)
People in Group quarters - Residential treatment centers for emotionally disturbed children (%)
People in Group quarters - Training schools for juvenile delinquents (%)
People in Group quarters - Short-term care, detention or diagnostic centers for delinquent children (%)
People in Group quarters - Type of juvenile institution unknown (%)
People in Group quarters - Noninstitutionalized population (%)
People in Group quarters - College dormitories (includes college quarters off campus) (%)
People in Group quarters - Military quarters (%)
People in Group quarters - On base (%)
People in Group quarters - Barracks, unaccompanied personnel housing (UPH), (Enlisted/Officer), ;and similar group living quarters for military personnel (%)
People in Group quarters - Transient quarters for temporary residents (%)
People in Group quarters - Military ships (%)
People in Group quarters - Group homes (%)
People in Group quarters - Homes or halfway houses for drug/alcohol abuse (%)
People in Group quarters - Homes for the mentally ill (%)
People in Group quarters - Homes for the mentally retarded (%)
People in Group quarters - Homes for the physically handicapped (%)
People in Group quarters - Other group homes (%)
People in Group quarters - Religious group quarters (%)
People in Group quarters - Dormitories (%)
People in Group quarters - Agriculture workers' dormitories on farms (%)
People in Group quarters - Job Corps and vocational training facilities (%)
People in Group quarters - Other workers' dormitories (%)
People in Group quarters - Crews of maritime vessels (%)
People in Group quarters - Other nonhousehold living situations (%)
People in Group quarters - Other noninstitutional group quarters (%)
Residents speaking English at home (%)
Residents speaking English at home - Born in the United States (%)
Residents speaking English at home - Native, born elsewhere (%)
Residents speaking English at home - Foreign born (%)
Residents speaking Spanish at home (%)
Residents speaking Spanish at home - Born in the United States (%)
Residents speaking Spanish at home - Native, born elsewhere (%)
Residents speaking Spanish at home - Foreign born (%)
Residents speaking other language at home (%)
Residents speaking other language at home - Born in the United States (%)
Residents speaking other language at home - Native, born elsewhere (%)
Residents speaking other language at home - Foreign born (%)
Class of Workers - Employee of private company (%)
Class of Workers - Self-employed in own incorporated business (%)
Class of Workers - Private not-for-profit wage and salary workers (%)
Class of Workers - Local government workers (%)
Class of Workers - State government workers (%)
Class of Workers - Federal government workers (%)
Class of Workers - Self-employed workers in own not incorporated business and Unpaid family workers (%)
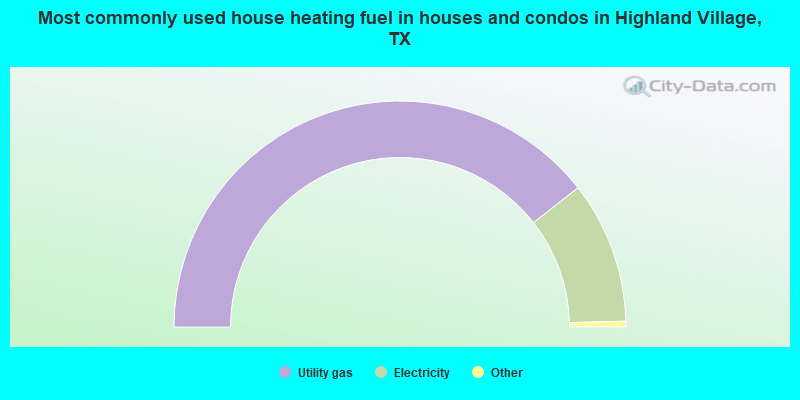
House heating fuel used in houses and condos - Utility gas (%)
House heating fuel used in houses and condos - Bottled, tank, or LP gas (%)
House heating fuel used in houses and condos - Electricity (%)
House heating fuel used in houses and condos - Fuel oil, kerosene, etc. (%)
House heating fuel used in houses and condos - Coal or coke (%)
House heating fuel used in houses and condos - Wood (%)
House heating fuel used in houses and condos - Solar energy (%)
House heating fuel used in houses and condos - Other fuel (%)
House heating fuel used in houses and condos - No fuel used (%)
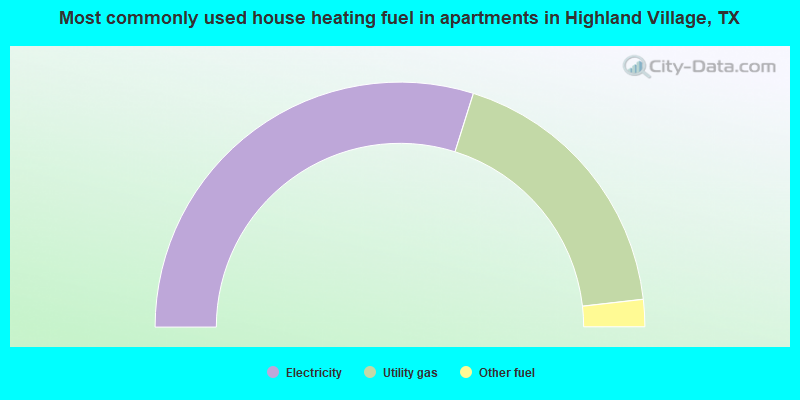
House heating fuel used in apartments - Utility gas (%)
House heating fuel used in apartments - Bottled, tank, or LP gas (%)
House heating fuel used in apartments - Electricity (%)
House heating fuel used in apartments - Fuel oil, kerosene, etc. (%)
House heating fuel used in apartments - Coal or coke (%)
House heating fuel used in apartments - Wood (%)
House heating fuel used in apartments - Solar energy (%)
House heating fuel used in apartments - Other fuel (%)
House heating fuel used in apartments - No fuel used (%)
Armed forces status - In Armed Forces (%)
Armed forces status - Civilian (%)
Armed forces status - Civilian - Veteran (%)
Armed forces status - Civilian - Nonveteran (%)
Fatal accidents locations in years 2005-2021
Fatal accidents locations in 2005
Fatal accidents locations in 2006
Fatal accidents locations in 2007
Fatal accidents locations in 2008
Fatal accidents locations in 2009
Fatal accidents locations in 2010
Fatal accidents locations in 2011
Fatal accidents locations in 2012
Fatal accidents locations in 2013
Fatal accidents locations in 2014
Fatal accidents locations in 2015
Fatal accidents locations in 2016
Fatal accidents locations in 2017
Fatal accidents locations in 2018
Fatal accidents locations in 2019
Fatal accidents locations in 2020
Fatal accidents locations in 2021
Alcohol use - People drinking some alcohol every month (%)
Alcohol use - People not drinking at all (%)
Alcohol use - Average days/month drinking alcohol
Alcohol use - Average drinks/week
Alcohol use - Average days/year people drink much
Audiometry - Average condition of hearing (%)
Audiometry - People that can hear a whisper from across a quiet room (%)
Audiometry - People that can hear normal voice from across a quiet room (%)
Audiometry - Ears ringing, roaring, buzzing (%)
Audiometry - Had a job exposure to loud noise (%)
Audiometry - Had off-work exposure to loud noise (%)
Blood Pressure & Cholesterol - Has high blood pressure (%)
Blood Pressure & Cholesterol - Checking blood pressure at home (%)
Blood Pressure & Cholesterol - Frequently checking blood cholesterol (%)
Blood Pressure & Cholesterol - Has high cholesterol level (%)
Consumer Behavior - Money monthly spent on food at supermarket/grocery store
Consumer Behavior - Money monthly spent on food at other stores
Consumer Behavior - Money monthly spent on eating out
Consumer Behavior - Money monthly spent on carryout/delivered foods
Consumer Behavior - Income spent on food at supermarket/grocery store (%)
Consumer Behavior - Income spent on food at other stores (%)
Consumer Behavior - Income spent on eating out (%)
Consumer Behavior - Income spent on carryout/delivered foods (%)
Current Health Status - General health condition (%)
Current Health Status - Blood donors (%)
Current Health Status - Has blood ever tested for HIV virus (%)
Current Health Status - Left-handed people (%)
Dermatology - People using sunscreen (%)
Diabetes - Diabetics (%)
Diabetes - Had a blood test for high blood sugar (%)
Diabetes - People taking insulin (%)
Diet Behavior & Nutrition - Diet health (%)
Diet Behavior & Nutrition - Milk product consumption (# of products/month)
Diet Behavior & Nutrition - Meals not home prepared (#/week)
Diet Behavior & Nutrition - Meals from fast food or pizza place (#/week)
Diet Behavior & Nutrition - Ready-to-eat foods (#/month)
Diet Behavior & Nutrition - Frozen meals/pizza (#/month)
Drug Use - People that ever used marijuana or hashish (%)
Drug Use - Ever used hard drugs (%)
Drug Use - Ever used any form of cocaine (%)
Drug Use - Ever used heroin (%)
Drug Use - Ever used methamphetamine (%)
Health Insurance - People covered by health insurance (%)
Kidney Conditions-Urology - Avg. # of times urinating at night
Medical Conditions - People with asthma (%)
Medical Conditions - People with anemia (%)
Medical Conditions - People with psoriasis (%)
Medical Conditions - People with overweight (%)
Medical Conditions - Elderly people having difficulties in thinking or remembering (%)
Medical Conditions - People who ever received blood transfusion (%)
Medical Conditions - People having trouble seeing even with glass/contacts (%)
Medical Conditions - People with arthritis (%)
Medical Conditions - People with gout (%)
Medical Conditions - People with congestive heart failure (%)
Medical Conditions - People with coronary heart disease (%)
Medical Conditions - People with angina pectoris (%)
Medical Conditions - People who ever had heart attack (%)
Medical Conditions - People who ever had stroke (%)
Medical Conditions - People with emphysema (%)
Medical Conditions - People with thyroid problem (%)
Medical Conditions - People with chronic bronchitis (%)
Medical Conditions - People with any liver condition (%)
Medical Conditions - People who ever had cancer or malignancy (%)
Mental Health - People who have little interest in doing things (%)
Mental Health - People feeling down, depressed, or hopeless (%)
Mental Health - People who have trouble sleeping or sleeping too much (%)
Mental Health - People feeling tired or having little energy (%)
Mental Health - People with poor appetite or overeating (%)
Mental Health - People feeling bad about themself (%)
Mental Health - People who have trouble concentrating on things (%)
Mental Health - People moving or speaking slowly or too fast (%)
Mental Health - People having thoughts they would be better off dead (%)
Oral Health - Average years since last visit a dentist
Oral Health - People embarrassed because of mouth (%)
Oral Health - People with gum disease (%)
Oral Health - General health of teeth and gums (%)
Oral Health - Average days a week using dental floss/device
Oral Health - Average days a week using mouthwash for dental problem
Oral Health - Average number of teeth
Pesticide Use - Households using pesticides to control insects (%)
Pesticide Use - Households using pesticides to kill weeds (%)
Physical Activity - People doing vigorous-intensity work activities (%)
Physical Activity - People doing moderate-intensity work activities (%)
Physical Activity - People walking or bicycling (%)
Physical Activity - People doing vigorous-intensity recreational activities (%)
Physical Activity - People doing moderate-intensity recreational activities (%)
Physical Activity - Average hours a day doing sedentary activities
Physical Activity - Average hours a day watching TV or videos
Physical Activity - Average hours a day using computer
Physical Functioning - People having limitations keeping them from working (%)
Physical Functioning - People limited in amount of work they can do (%)
Physical Functioning - People that need special equipment to walk (%)
Physical Functioning - People experiencing confusion/memory problems (%)
Physical Functioning - People requiring special healthcare equipment (%)
Prescription Medications - Average number of prescription medicines taking
Preventive Aspirin Use - Adults 40+ taking low-dose aspirin (%)
Reproductive Health - Vaginal deliveries (%)
Reproductive Health - Cesarean deliveries (%)
Reproductive Health - Deliveries resulted in a live birth (%)
Reproductive Health - Pregnancies resulted in a delivery (%)
Reproductive Health - Women breastfeeding newborns (%)
Reproductive Health - Women that had a hysterectomy (%)
Reproductive Health - Women that had both ovaries removed (%)
Reproductive Health - Women that have ever taken birth control pills (%)
Reproductive Health - Women taking birth control pills (%)
Reproductive Health - Women that have ever used Depo-Provera or injectables (%)
Reproductive Health - Women that have ever used female hormones (%)
Sexual Behavior - People 18+ that ever had sex (vaginal, anal, or oral) (%)
Sexual Behavior - Males 18+ that ever had vaginal sex with a woman (%)
Sexual Behavior - Males 18+ that ever performed oral sex on a woman (%)
Sexual Behavior - Males 18+ that ever had anal sex with a woman (%)
Sexual Behavior - Males 18+ that ever had any sex with a man (%)
Sexual Behavior - Females 18+ that ever had vaginal sex with a man (%)
Sexual Behavior - Females 18+ that ever performed oral sex on a man (%)
Sexual Behavior - Females 18+ that ever had anal sex with a man (%)
Sexual Behavior - Females 18+ that ever had any kind of sex with a woman (%)
Sexual Behavior - Average age people first had sex
Sexual Behavior - Average number of female sex partners in lifetime (males 18+)
Sexual Behavior - Average number of female vaginal sex partners in lifetime (males 18+)
Sexual Behavior - Average age people first performed oral sex on a woman (18+)
Sexual Behavior - Average number of woman performed oral sex on in lifetime (18+)
Sexual Behavior - Average number of male sex partners in lifetime (males 18+)
Sexual Behavior - Average number of male anal sex partners in lifetime (males 18+)
Sexual Behavior - Average age people first performed oral sex on a man (18+)
Sexual Behavior - Average number of male oral sex partners in lifetime (18+)
Sexual Behavior - People using protection when performing oral sex (%)
Sexual Behavior - Average number of times people have vaginal or anal sex a year
Sexual Behavior - People having sex without condom (%)
Sexual Behavior - Average number of male sex partners in lifetime (females 18+)
Sexual Behavior - Average number of male vaginal sex partners in lifetime (females 18+)
Sexual Behavior - Average number of female sex partners in lifetime (females 18+)
Sexual Behavior - Circumcised males 18+ (%)
Sleep Disorders - Average hours sleeping at night
Sleep Disorders - People that has trouble sleeping (%)
Smoking-Cigarette Use - People smoking cigarettes (%)
Taste & Smell - People 40+ having problems with smell (%)
Taste & Smell - People 40+ having problems with taste (%)
Taste & Smell - People 40+ that ever had wisdom teeth removed (%)
Taste & Smell - People 40+ that ever had tonsils teeth removed (%)
Taste & Smell - People 40+ that ever had a loss of consciousness because of a head injury (%)
Taste & Smell - People 40+ that ever had a broken nose or other serious injury to face or skull (%)
Taste & Smell - People 40+ that ever had two or more sinus infections (%)
Weight - Average height (inches)
Weight - Average weight (pounds)
Weight - Average BMI
Weight - People that are obese (%)
Weight - People that ever were obese (%)
Weight - People trying to lose weight (%)
According to our research of Texas and other state lists, there were 2 registered sex offenders living in Highland Village, Texas as of May 28, 2024 . The ratio of all residents to sex offenders in Highland Village is 8,557 to 1.The ratio of registered sex offenders to all residents in this city is much lower than the state average.
Officers per 1,000 residents here:
1.70Texas average:
2.07
Latest news from Highland Village, TX collected exclusively by city-data.com from local newspapers, TV, and radio stations
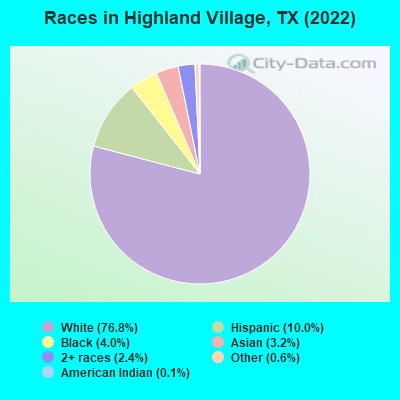
Ancestries: English (18.2%), American (13.4%), German (12.7%), European (7.1%), Irish (6.9%), Scottish (2.5%).
Current Local Time:
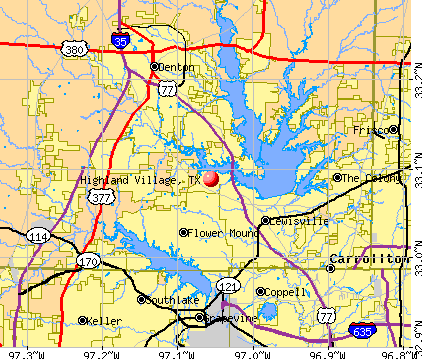
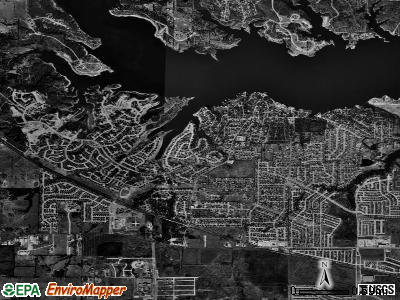
Land area: 5.52 square miles.
Population density: 2,919 people per square mile (average).
1,094 residents are foreign born (2.2% Asia , 2.0% Europe , 1.5% Latin America , 0.8% Africa ).
This city:
6.4%Texas:
17.1%
Median real estate property taxes paid for housing units with mortgages in 2022: $8,560 (1.6%)Median real estate property taxes paid for housing units with no mortgage in 2022: $7,299 (1.5%)
Nearest city with pop. 50,000+: Flower Mound, TX
Nearest city with pop. 200,000+: Northeast Tarrant, TX (16.7 miles
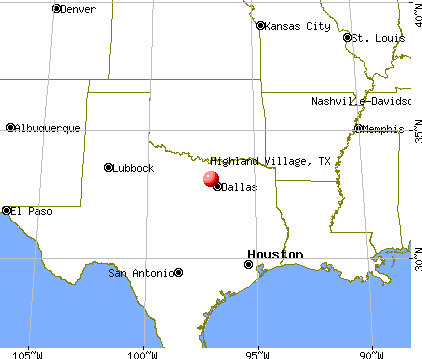
Nearest city with pop. 1,000,000+: Dallas, TX
Nearest cities:
Latitude: 33.09 N, Longitude: 97.06 W
Daytime population change due to commuting: -666 (-3.9%)Workers who live and work in this city: 3,357 (37.9%)
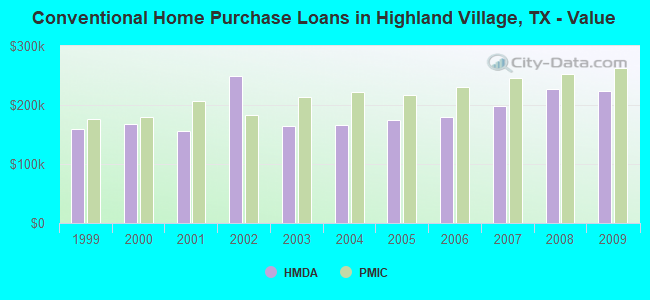
Property values in Highland Village, TX
Unemployment in December 2023:
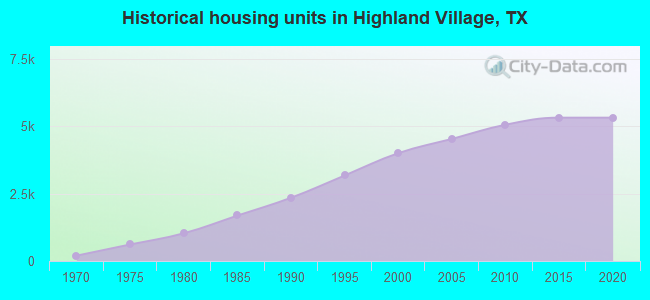
Population change in the 1990s: +5,010 (+69.9%).
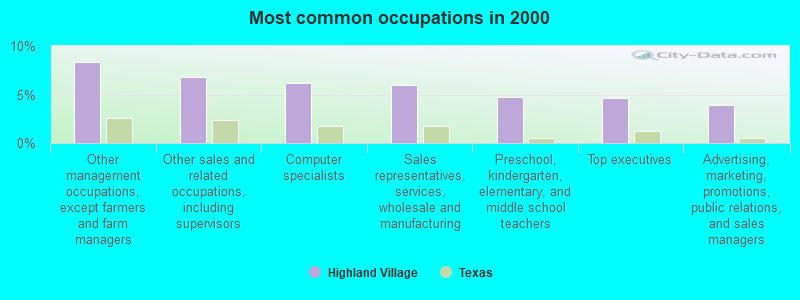
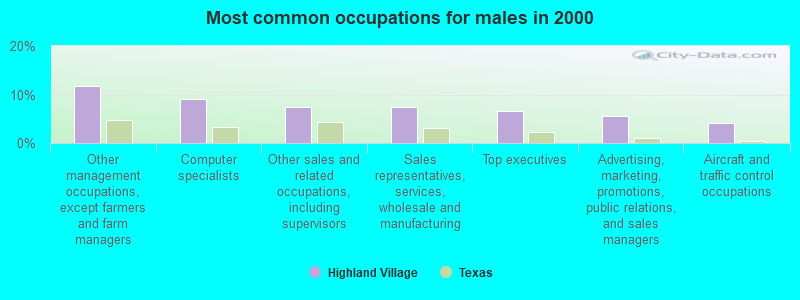
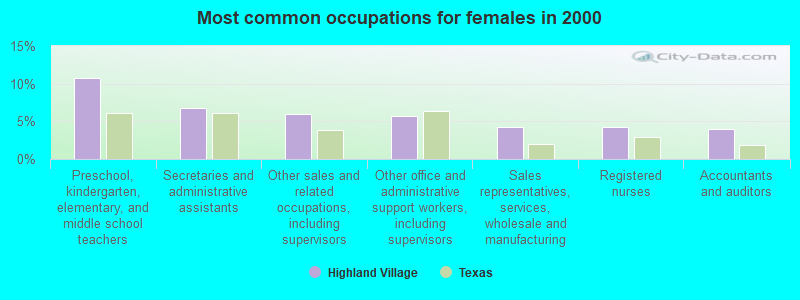
Most common occupations in Highland Village, TX (%)
Both Males Females
Other management occupations, except farmers and farm managers (8.3%)
Other sales and related occupations, including supervisors (6.8%)
Computer specialists (6.1%)
Sales representatives, services, wholesale and manufacturing (6.0%)
Preschool, kindergarten, elementary, and middle school teachers (4.7%)
Top executives (4.6%)
Advertising, marketing, promotions, public relations, and sales managers (3.9%)
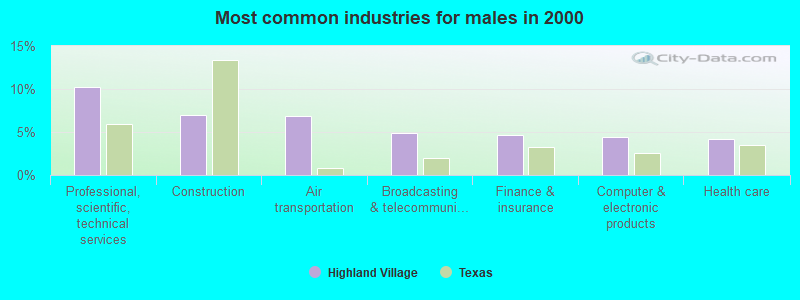
Other management occupations, except farmers and farm managers (11.7%)
Computer specialists (9.1%)
Other sales and related occupations, including supervisors (7.5%)
Sales representatives, services, wholesale and manufacturing (7.4%)
Top executives (6.5%)
Advertising, marketing, promotions, public relations, and sales managers (5.5%)
Aircraft and traffic control occupations (4.2%)
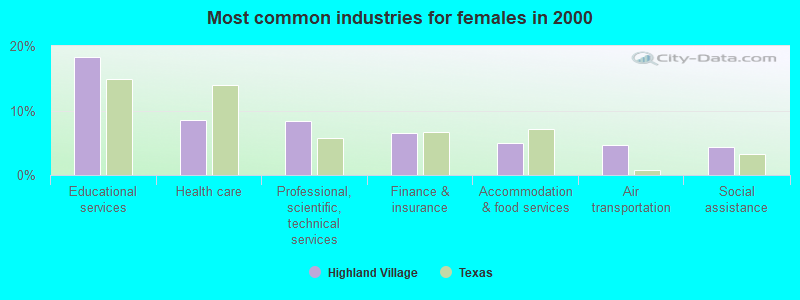
Preschool, kindergarten, elementary, and middle school teachers (10.8%)
Secretaries and administrative assistants (6.8%)
Other sales and related occupations, including supervisors (6.0%)
Other office and administrative support workers, including supervisors (5.7%)
Sales representatives, services, wholesale and manufacturing (4.3%)
Registered nurses (4.3%)
Accountants and auditors (3.9%)
Tornado activity:
Highland Village-area historical tornado activity is above Texas state average. It is 151% greater than the overall U.S. average.
On 4/2/1957, a category F3 (max. wind speeds 158-206 mph) tornado 13.1 miles away from the Highland Village city center killed 10 people and injured 200 people and caused between $500,000 and $5,000,000 in damages.
On 4/25/1994, a category F4 (max. wind speeds 207-260 mph) tornado 36.6 miles away from the city center killed 3 people and injured 48 people and caused between $50,000,000 and $500,000,000 in damages.
Earthquake activity:
Highland Village-area historical earthquake activity is significantly above Texas state average. It is 505% greater than the overall U.S. average. On 11/6/2011 at 03:53:10, a magnitude 5.7 (5.7 MW, Depth: 3.2 mi, Class: Moderate, Intensity: VI - VII) earthquake occurred 169.9 miles away from the city center On 9/3/2016 at 12:02:44, a magnitude 5.8 (5.8 MW, Depth: 3.5 mi) earthquake occurred 230.9 miles away from the city center On 6/16/1978 at 11:46:54, a magnitude 5.3 (4.4 MB, 4.6 UK, 5.3 ML) earthquake occurred 215.1 miles away from the city center On 11/7/2016 at 01:44:24, a magnitude 5.0 (5.0 MW, Depth: 2.8 mi) earthquake occurred 201.3 miles away from Highland Village center On 11/8/2011 at 02:46:57, a magnitude 4.8 (4.8 MW, Depth: 3.1 mi, Class: Light, Intensity: IV - V) earthquake occurred 169.7 miles away from Highland Village center On 11/5/2011 at 07:12:45, a magnitude 4.8 (4.8 MW, Depth: 1.9 mi) earthquake occurred 171.1 miles away from Highland Village center Magnitude types: body-wave magnitude (MB), local magnitude (ML), moment magnitude (MW) Natural disasters: The number of natural disasters in Denton County (18) is near the US average (15).Major Disasters (Presidential) Declared: 7Emergencies Declared: 9Storms: 6, Fires: 5, Floods: 5, Hurricanes: 5, Tornadoes: 5, Wind: 1, Other: 2 (Note: some incidents may be assigned to more than one category). Hospitals and medical centers in Highland Village: RAMBLING OAKS COURTYARD EXTENSIVE CARE COMMUNITY (112 BARNETT BLVD)
Other hospitals and medical centers near Highland Village: GLOW HEALTHCARE SOLUTIONS INCORPORATED (Home Health Center, about 2 miles away; LEWISVILLE, TX)
CORNERSTONE HOME HEALTH AGENCY (Home Health Center, about 3 miles away; LEWISVILLE, TX)
LAKE PARK NURSING AND REHAB CENTER (Nursing Home, about 3 miles away; LEWISVILLE, TX)
LAKE VILLAGE INC DBA LAKE VILLAGE NURSING AND REHA (Nursing Home, about 3 miles away; LEWISVILLE, TX)
COUNTRY HOME (Hospital, about 3 miles away; DOUBLE OAK, TX)
GOSHEN HEALTHCARE SERVICES LLC (Home Health Center, about 3 miles away; LEWISVILLE, TX)
TEXAS HEALTH PRESBYTERIAN HOSPITAL FLOWER MOUND (about 3 miles away; FLOWER MOUND, TX)
Colleges/universities with over 2000 students nearest to Highland Village:
University of North Texas (about 11 miles; Denton, TX ; Full-time enrollment: 31,694)
Texas Woman's University (about 11 miles; Denton, TX ; FT enrollment: 11,837)
DeVry University-Texas (about 11 miles; Irving, TX ; FT enrollment: 4,098)
North Lake College (about 16 miles; Irving, TX ; FT enrollment: 6,191)
Brookhaven College (about 17 miles; Farmers Branch, TX ; FT enrollment: 6,868)
University of Dallas (about 19 miles; Irving, TX ; FT enrollment: 2,192)
The University of Texas at Dallas (about 20 miles; Richardson, TX ; FT enrollment: 16,777)
Public elementary/middle schools in Highland Village: BRIARHILL MIDDLE Students: 971, Location: 2100 BRIARHILL BLVD, Grades: 6-8)MCAULIFFE EL Students: 477, Location: 2300 BRIARHILL BLVD, Grades: PK-5)HIGHLAND VILLAGE EL Students: 397, Location: 301 BRAZOS BLVD, Grades: PK-5)HERITAGE EL Location: 100 BARNETT BLVD, Grades: KG-5)
See full list of schools located in Highland Village Denton County has a predicted average indoor radon screening level less than 2 pCi/L (pico curies per liter) - Low Potential Average household size: This city:
3.0 peopleTexas:
2.8 people
Percentage of family households: This city:
88.3%Whole state:
69.9%
Percentage of households with unmarried partners: This city:
2.9%Whole state:
6.0%
Likely homosexual households (counted as self-reported same-sex unmarried-partner households)
Lesbian couples: 0.3% of all households Gay men: 0.3% of all households
42 people in nursing facilities/skilled-nursing facilities in 2010people in local jails and other confinement facilities (including police lockups) in 2000
Banks with branches in Highland Village (2011 data):
JPMorgan Chase Bank, National Association: Highland Village Branch Center at 2370 Fm 407, branch established on 2002/03/26. Info updated 2011/11/10: Bank assets: $1,811,678.0 mil, Deposits: $1,190,738.0 mil, headquarters in Columbus, OH, positive income , International Specialization, 5577 total offices , Holding Company: Jpmorgan Chase & Co.
United Community Bank, National Association: at 2100 Fm Road 407, branch established on 1998/05/27. Info updated 2006/11/03: Bank assets: $106.1 mil, Deposits: $95.4 mil, local headquarters , positive income , Commercial Lending Specialization, 4 total offices , Holding Company: Community Group, Inc., The
Citibank, National Association: Highland Village at 1100 Village Pkwy, branch established on 2007/01/26. Info updated 2012/01/10: Bank assets: $1,288,658.0 mil, Deposits: $882,541.0 mil, headquarters in Sioux Falls, SD, positive income , International Specialization, 1048 total offices , Holding Company: Citigroup Inc.
Wells Fargo Bank, National Association: Highland Village Branch at 1900 Fm 407, branch established on 1986/12/01. Info updated 2011/04/05: Bank assets: $1,161,490.0 mil, Deposits: $905,653.0 mil, headquarters in Sioux Falls, SD, positive income , 6395 total offices , Holding Company: Wells Fargo & Company
First National Bank Texas: Highland Village Banking Center - Rc at 3060 Fm 407, branch established on 2009/02/26. Info updated 2006/11/03: Bank assets: $944.3 mil, Deposits: $815.9 mil, headquarters in Killeen, TX, positive income , Mortgage Lending Specialization, 250 total offices , Holding Company: First Community Bancshares, Inc.
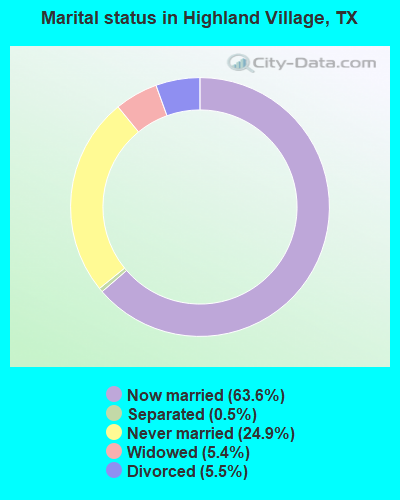
For population 15 years and over in Highland Village:
Never married: 24.9%Now married: 63.6%Separated: 0.5%Widowed: 5.4%Divorced: 5.5% For population 25 years and over in Highland Village:
High school or higher: 98.1%Bachelor's degree or higher: 57.6%Graduate or professional degree: 16.6%Unemployed: 1.9%Mean travel time to work (commute): 19.4 minutes
Education Gini index (Inequality in education) Here:
8.1Texas average:
14.0
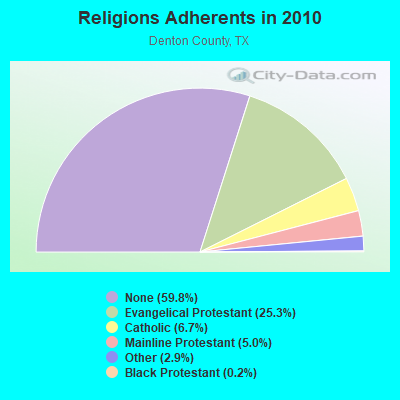
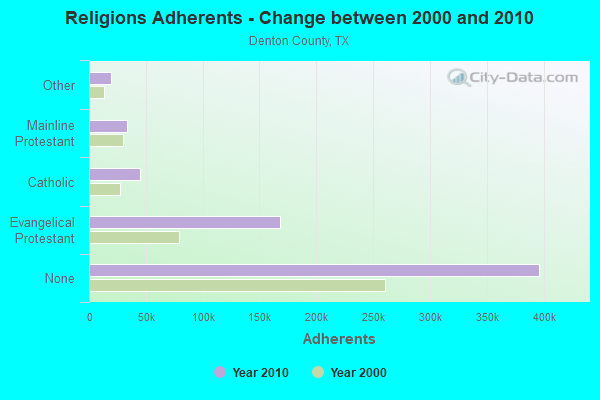
Religion statistics for Highland Village, TX (based on Denton County data)
Religion Adherents Congregations Evangelical Protestant 167,945 321 Catholic 44,615 8 Mainline Protestant 33,340 56 Other 18,928 42 Black Protestant 1,354 8 Orthodox 120 1 None 396,312 -
Source: Clifford Grammich, Kirk Hadaway, Richard Houseal, Dale E.Jones, Alexei Krindatch, Richie Stanley and Richard H.Taylor. 2012. 2010 U.S.Religion Census: Religious Congregations & Membership Study. Association of Statisticians of American Religious Bodies. Jones, Dale E., et al. 2002. Congregations and Membership in the United States 2000. Nashville, TN: Glenmary Research Center. Graphs represent county-level data
Food Environment Statistics: Number of grocery stores : 52Denton County :
0.85 / 10,000 pop.Texas :
1.47 / 10,000 pop.
Number of supercenters and club stores : 10This county :
0.16 / 10,000 pop.State :
0.14 / 10,000 pop.
Number of convenience stores (no gas) : 35This county :
0.57 / 10,000 pop.State :
1.11 / 10,000 pop.
Number of convenience stores (with gas) : 164Here :
2.67 / 10,000 pop.Texas :
3.95 / 10,000 pop.
Number of full-service restaurants : 301This county :
4.90 / 10,000 pop.Texas :
6.13 / 10,000 pop.
Adult diabetes rate : This county :
8.5%State :
8.9%
Adult obesity rate : This county :
28.4%Texas :
26.6%
Low-income preschool obesity rate : Denton County :
13.8%Texas :
15.7%
Health and Nutrition:
Average overall health of teeth and gums : This city:
56.5%Texas:
47.4%
Average BMI : Highland Village:
28.3Texas:
28.5
People feeling badly about themselves : People not drinking alcohol at all : Average hours sleeping at night : Highland Village:
6.9State:
6.8
Overweight people : Highland Village:
35.4%Texas:
33.1%
General health condition : Highland Village:
62.4%State:
56.2%
Average condition of hearing : Highland Village:
82.3%Texas:
80.7%
More about Health and Nutrition of Highland Village, TX Residents
Local government employment and payroll (March 2022)
Function
Full-time employees
Monthly full-time payroll
Average yearly full-time wage
Part-time employees
Monthly part-time payroll
Police Protection - Officers
27 $180,383 $80,170 0 $0 Firefighters
18 $131,333 $87,555 0 $0 Water Supply
17 $71,212 $50,267 0 $0 Parks and Recreation
16 $87,778 $65,834 7 $3,320 Financial Administration
13 $87,002 $80,310 0 $0 Other and Unallocable
11 $59,672 $65,097 0 $0 Police - Other
11 $64,662 $70,540 10 $8,964 Other Government Administration
10 $76,884 $92,261 0 $0 Streets and Highways
10 $43,510 $52,212 0 $0 Fire - Other
4 $35,479 $106,437 0 $0 Natural Resources
4 $19,631 $58,893 0 $0 Judicial and Legal
2 $9,566 $57,396 2 $3,660 Health
1 $4,624 $55,488 0 $0
Totals for Government
144 $871,737 $72,645 19 $15,943
Highland Village government finances - Expenditure in 2017 (per resident):
Construction - Parks and Recreation: $70,000 ($4.35)
Current Operations - Police Protection: $4,261,000 ($264.58)
Water Utilities: $3,951,000 ($245.33)Sewerage: $3,034,000 ($188.39)Parks and Recreation: $2,898,000 ($179.94)Local Fire Protection: $2,280,000 ($141.57)Financial Administration: $1,784,000 ($110.77)Central Staff Services: $1,690,000 ($104.94)General Public Buildings: $992,000 ($61.60)Regular Highways: $980,000 ($60.85)Protective Inspection and Regulation - Other: $377,000 ($23.41)General - Interest on Debt: $797,000 ($49.49)
Other Capital Outlay - Regular Highways: $348,000 ($21.61)
Police Protection: $117,000 ($7.26)Parks and Recreation: $81,000 ($5.03)Financial Administration: $30,000 ($1.86)Local Fire Protection: $11,000 ($0.68)Water Utilities: $8,000 ($0.50)Total Salaries and Wages: $10,535,000 ($654.14)
Water Utilities - Interest on Debt: $499,000 ($30.98)
Highland Village government finances - Revenue in 2017 (per resident):
Charges - Sewerage: $3,841,000 ($238.50)
Parks and Recreation: $493,000 ($30.61)Federal Intergovernmental - Other: $105,000 ($6.52)
Miscellaneous - General Revenue - Other: $317,000 ($19.68)
Fines and Forfeits: $217,000 ($13.47)Interest Earnings: $81,000 ($5.03)Revenue - Water Utilities: $5,641,000 ($350.26)
State Intergovernmental - General Local Government Support: $58,000 ($3.60)
Tax - Property: $11,179,000 ($694.13)
General Sales and Gross Receipts: $3,524,000 ($218.81)Public Utilities Sales: $1,692,000 ($105.06)Other License: $385,000 ($23.91)Occupation and Business License - Other: $5,000 ($0.31)Alcoholic Beverage License: $5,000 ($0.31)
Highland Village government finances - Debt in 2017 (per resident):
Long Term Debt - Beginning Outstanding - Unspecified Public Purpose: $32,726,000 ($2032.04)
Outstanding Unspecified Public Purpose: $30,071,000 ($1867.18)Retired Unspecified Public Purpose: $2,655,000 ($164.86)
Highland Village government finances - Cash and Securities in 2017 (per resident):
Bond Funds - Cash and Securities: $6,117,000 ($379.82)
Other Funds - Cash and Securities: $9,211,000 ($571.93)
Sinking Funds - Cash and Securities: $470,000 ($29.18)
12.39% of this county's 2021 resident taxpayers lived in other counties in 2020 ($93,158 average adjusted gross income )
Here:
12.39%Texas average:
8.12%
0.01% of residents moved from foreign countries ($94 average AGI )Denton County:
0.01%Texas average:
0.04%
Top counties from which taxpayers relocated into this county between 2020 and 2021:
10.07% of this county's 2020 resident taxpayers moved to other counties in 2021 ($79,464 average adjusted gross income )
Here:
10.07%Texas average:
7.40%
0.01% of residents moved to foreign countries ($63 average AGI )Denton County:
0.01%Texas average:
0.03%
Top counties to which taxpayers relocated from this county between 2020 and 2021:
Businesses in Highland Village, TX
Name Count Name Count
AT&T 1 Jamba Juice 1 Aeropostale 1 JoS. A. Bank 1 American Eagle Outfitters 1 Justice 1 Ann Taylor 1 Kroger 1 Banana Republic 1 LA Fitness 1 Barnes & Noble 1 New York & Co 1 Bath & Body Works 1 Nike 1 Ben & Jerry's 1 Office Depot 1 Chico's 1 Soma Intimates 1 Coldwater Creek 2 Sprint Nextel 1 Domino's Pizza 1 T-Mobile 2 Dunkin Donuts 1 Talbots 1 Eddie Bauer 1 UPS 1 FedEx 2 Vans 1 Gymboree 1 Victoria's Secret 1 H&R Block 1 Walgreens 1 IHOP 1 Walmart 1
Strongest AM radio stations in Highland Village:
KTNO (1440 AM; 12 kW; DENTON, TX; Owner: MORTENSON BROADCASTING COMPANY)
KBIS (1150 AM; 25 kW; HIGHLAND PARK, TX; Owner: DALLAS AM RADIO PARTNERS, L.P.)
KZMP (1540 AM; 50 kW; UNIVERSITY PARK, TX; Owner: ENTRAVISION HOLDINGS, LLC)
KLIF (570 AM; 5 kW; DALLAS, TX; Owner: KLIF LICO, INC.)
KRLD (1080 AM; 50 kW; DALLAS, TX; Owner: TEXAS INFINITY BROADCASTING L.P.)
KESS (1270 AM; 50 kW; FORT WORTH, TX; Owner: KESS-AM LICENSE CORP.)
WBAP (820 AM; 50 kW; FORT WORTH, TX; Owner: WBAP-KSCS OPERATING, LTD.)
KTCK (1310 AM; 9 kW; DALLAS, TX; Owner: KRBE LICO, INC.)
KAHZ (1360 AM; 50 kW; HURST, TX)
KSKY (660 AM; 20 kW; BALCH SPRINGS, TX; Owner: BISON MEDIA, INC.)
KFXR (1190 AM; 50 kW; DALLAS, TX; Owner: CLEAR CHANNEL BROADCASTING LICENSES, INC.)
KHVN (970 AM; 10 kW; FORT WORTH, TX; Owner: MORTENSON BROADCASTING COMPANY)
KNAX (1630 AM; 10 kW; FT. WORTH, TX; Owner: MORTENSON BROADCASTING COMPANY)
Strongest FM radio stations in Highland Village:
KPLX (99.5 FM; FORT WORTH, TX; Owner: KPLX LICO, INC.)
KLUV-FM (98.7 FM; DALLAS, TX; Owner: INFINITY BROADCASTING CORPORATION OF DALLAS)
WRR (101.1 FM; DALLAS, TX; Owner: CITY OF DALLAS, TEXAS)
KESN (103.3 FM; ALLEN, TX; Owner: WBAP-KSCS OPERATING, LTD.)
KNOR (93.7 FM; HEALDTON, OK; Owner: AM & PM BROADCASTERS, LLC)
KSOC (94.5 FM; GAINESVILLE, TX; Owner: RADIO ONE LICENSES, LLC)
KMEO (96.7 FM; FLOWER MOUND, TX; Owner: ABC, INC.)
KKDL (106.7 FM; MUENSTER, TX; Owner: ENTRAVISION HOLDINGS, LLC)
KZMP-FM (101.7 FM; AZLE, TX; Owner: ENTRAVISION HOLDINGS, LLC)
KTPW (89.7 FM; SANGER, TX; Owner: RESEARCH EDUCATIONAL FOUNDATION, INC)
KLLI (105.3 FM; DALLAS, TX; Owner: INFINITY BROADCASTING CORPORATION OF DALLAS)
KRNB (105.7 FM; DECATUR, TX; Owner: SERVICE BROADCASTING I, LTD.)
KDKR (91.3 FM; DECATUR, TX; Owner: CSN INTERNATIONAL)
KZPS (92.5 FM; DALLAS, TX; Owner: AMFM TEXAS LICENSES LIMITED PARTNERSHIP)
KHKS (106.1 FM; DENTON, TX; Owner: AMFM TEXAS LICENSES LIMITED PARTNERSHIP)
KKDA-FM (104.5 FM; DALLAS, TX; Owner: SERVICE BROADCASTING I, LTD.)
KVIL-FM (103.7 FM; HIGHLAND PARK-DALLAS, TX; Owner: INFINITY BROADCASTING CORPORATION OF TEXAS)
KHCK-FM (99.1 FM; DENTON, TX; Owner: KHCK-FM LICENSE CORP.)
KOAI (107.5 FM; FORT WORTH, TX; Owner: INFINITY KOAI-FM, INC.)
KEGL (97.1 FM; FORT WORTH, TX; Owner: CITICASTERS LICENSES, L.P.)
TV broadcast stations around Highland Village:
KLDT (Channel 55; LAKE DALLAS, TX; Owner: JOHNSON BROADCASTING OF DALLAS, INC.)
KTVT (Channel 11; FORT WORTH, TX; Owner: CBS STATIONS GROUP OF TEXAS L.P.)
KXAS-TV (Channel 5; FORT WORTH, TX; Owner: STATION VENTURE OPERATIONS, LP)
KDTN (Channel 2; DENTON, TX; Owner: NORTH TEXAS PUBLIC BROADCASTING, INC.)
KSTR-TV (Channel 49; IRVING, TX; Owner: TELEFUTURA DALLAS LLC)
KTXA (Channel 21; FORT WORTH, TX; Owner: VIACOM TELEVISION STATIONS GROUP OF DALLAS/FORT WORTH L.P.)
KUVN (Channel 23; GARLAND, TX; Owner: KUVN LICENSE PARTNERSHIP, L.P.)
KMPX (Channel 29; DECATUR, TX; Owner: WORD OF GOD FELLOWSHIP, INC.)
KPXD (Channel 68; ARLINGTON, TX; Owner: PAXSON DALLAS LICENSE, INC.)
KLEG-LP (Channel 44; DALLAS, TX; Owner: DILIP VISWANATH)
WFAA-TV (Channel 8; DALLAS, TX; Owner: WFAA-TV, L.P.)
KERA-TV (Channel 13; DALLAS, TX; Owner: NORTH TEXAS PUBLIC BROADCASTING, INC.)
KDFW (Channel 4; DALLAS, TX; Owner: KDFW LICENSE, INC.)
KXTX-TV (Channel 39; DALLAS, TX; Owner: TELEMUNDO OF TEXAS PARTNERSHIP, LP)
KDTX-TV (Channel 58; DALLAS, TX; Owner: TRINITY BROADCASTING OF TEXAS, INC.)
KDAF (Channel 33; DALLAS, TX; Owner: TRIBUNE TELEVISION COMPANY)
KDFI (Channel 27; DALLAS, TX; Owner: NEW DMIC, INC.)
KFWD (Channel 52; FORT WORTH, TX; Owner: HIC BROADCAST, INC.)
K26HF (Channel 26; BRITTON, TX; Owner: MAKO COMMUNICATIONS, LLC)
KHPK-LP (Channel 28; DE SOTO, TX; Owner: MAKO COMMUNICATIONS, LLC)
KJJM-LP (Channel 46; DALLAS/MESQUITE, TX; Owner: JANE McGINNIS)
K25FW (Channel 25; CORSICANA, TX; Owner: VENTANA TELEVISION, INC.)
KATA-LP (Channel 60; MESQUITE, TX; Owner: JANE McGINNIS)
KTAQ (Channel 47; GREENVILLE, TX; Owner: MIKE SIMONS)
KVFW-LP (Channel 65; FORT WORTH, TX; Owner: GERALD BENAVIDES)
Highland Village fatal accident list:
Jun 12, 2020 09:16 PM, Highland Village Rd, Lat: 33.078369, Lon: -97.057283, Vehicles: 1, Persons: 1, Fatalities: 1Lat: 33.071542, Lon: -97.057608, Vehicles: 2, Persons: 3, Fatalities: 1Lat: 33.071983, Lon: -97.083497, Vehicles: 2, Persons: 3, Fatalities: 1Lat: 33.084083, Lon: -97.078181, Vehicles: 1, Persons: 1, Pedestrians: 1, Fatalities: 1Lat: 33.089642, Lon: -97.051647, Vehicles: 1, Persons: 2, Fatalities: 1Vehicles: 1, Persons: 2, Fatalities: 1
National Bridge Inventory (NBI) Statistics 4 Number of bridges256ft / 77.6m Total length22,660 Total average daily traffic462 Total average daily truck traffic36,075 Total future (year 2030) average daily traffic
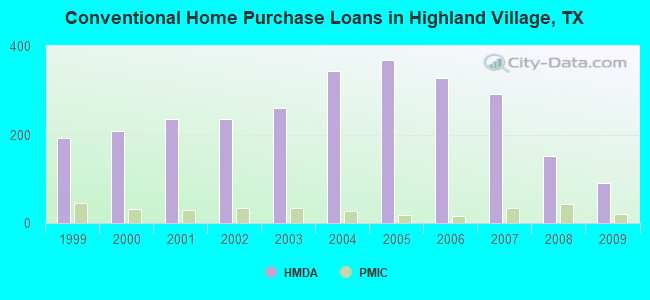
Home Mortgage Disclosure Act Aggregated Statistics For Year 2009(Based on 2 partial tracts) A) FHA, FSA/RHS & VA B) Conventional C) Refinancings D) Home Improvement Loans F) Non-occupant Loans on Number Average Value Number Average Value Number Average Value Number Average Value Number Average Value
LOANS ORIGINATED 31 $216,973 90 $224,216 312 $225,078 12 $70,459 6 $170,333 APPLICATIONS APPROVED, NOT ACCEPTED 2 $201,180 8 $195,856 24 $248,292 5 $28,984 1 $202,560 APPLICATIONS DENIED 4 $236,220 8 $295,778 78 $232,507 12 $74,988 2 $119,760 APPLICATIONS WITHDRAWN 5 $227,188 10 $296,042 62 $225,063 4 $77,852 1 $218,710 FILES CLOSED FOR INCOMPLETENESS 1 $160,080 1 $200,400 9 $251,091 2 $45,645 0 $0
Aggregated Statistics For Year 2008(Based on 2 partial tracts) A) FHA, FSA/RHS & VA B) Conventional C) Refinancings D) Home Improvement Loans F) Non-occupant Loans on G) Loans On Manufactured Number Average Value Number Average Value Number Average Value Number Average Value Number Average Value Number Average Value
LOANS ORIGINATED 33 $216,556 151 $227,015 113 $212,989 29 $65,975 9 $204,032 0 $0 APPLICATIONS APPROVED, NOT ACCEPTED 4 $170,428 14 $248,026 21 $228,578 5 $40,182 1 $177,820 0 $0 APPLICATIONS DENIED 4 $166,738 29 $186,553 52 $219,342 18 $63,456 4 $143,605 1 $128,540 APPLICATIONS WITHDRAWN 4 $228,368 25 $215,056 38 $237,969 4 $85,438 3 $182,347 0 $0 FILES CLOSED FOR INCOMPLETENESS 0 $0 3 $177,180 7 $250,037 1 $66,330 0 $0 0 $0
Aggregated Statistics For Year 2007(Based on 2 partial tracts) A) FHA, FSA/RHS & VA B) Conventional C) Refinancings D) Home Improvement Loans F) Non-occupant Loans on Number Average Value Number Average Value Number Average Value Number Average Value Number Average Value
LOANS ORIGINATED 10 $199,910 291 $198,608 106 $215,786 37 $60,991 15 $216,520 APPLICATIONS APPROVED, NOT ACCEPTED 0 $0 35 $182,138 23 $200,076 12 $49,475 3 $177,610 APPLICATIONS DENIED 3 $201,363 54 $192,682 52 $216,333 27 $66,638 6 $206,273 APPLICATIONS WITHDRAWN 1 $201,770 23 $240,131 33 $200,447 4 $93,502 2 $263,310 FILES CLOSED FOR INCOMPLETENESS 0 $0 12 $218,744 12 $239,496 2 $62,640 0 $0
Aggregated Statistics For Year 2006(Based on 2 partial tracts) A) FHA, FSA/RHS & VA B) Conventional C) Refinancings D) Home Improvement Loans F) Non-occupant Loans on G) Loans On Manufactured Number Average Value Number Average Value Number Average Value Number Average Value Number Average Value Number Average Value
LOANS ORIGINATED 8 $213,556 328 $179,917 94 $222,295 33 $59,266 23 $197,467 1 $61,860 APPLICATIONS APPROVED, NOT ACCEPTED 1 $105,400 43 $188,885 13 $174,739 10 $44,509 3 $213,240 1 $29,530 APPLICATIONS DENIED 1 $284,530 61 $221,655 63 $205,128 23 $57,400 9 $261,656 2 $113,000 APPLICATIONS WITHDRAWN 1 $142,770 27 $200,600 42 $233,747 6 $71,852 3 $244,297 0 $0 FILES CLOSED FOR INCOMPLETENESS 1 $147,250 9 $273,501 12 $209,948 0 $0 2 $166,965 0 $0
Aggregated Statistics For Year 2005(Based on 2 partial tracts) A) FHA, FSA/RHS & VA B) Conventional C) Refinancings D) Home Improvement Loans F) Non-occupant Loans on G) Loans On Manufactured Number Average Value Number Average Value Number Average Value Number Average Value Number Average Value Number Average Value
LOANS ORIGINATED 6 $187,058 369 $175,020 136 $192,584 33 $65,881 18 $176,953 0 $0 APPLICATIONS APPROVED, NOT ACCEPTED 0 $0 51 $188,551 20 $181,440 10 $100,592 3 $211,327 2 $38,175 APPLICATIONS DENIED 1 $157,220 76 $192,043 78 $199,099 21 $46,686 12 $264,809 2 $27,960 APPLICATIONS WITHDRAWN 1 $258,420 46 $190,114 48 $223,862 9 $319,119 3 $186,520 0 $0 FILES CLOSED FOR INCOMPLETENESS 0 $0 12 $196,019 33 $203,762 0 $0 2 $194,985 0 $0
Aggregated Statistics For Year 2004(Based on 2 partial tracts) A) FHA, FSA/RHS & VA B) Conventional C) Refinancings D) Home Improvement Loans F) Non-occupant Loans on G) Loans On Manufactured Number Average Value Number Average Value Number Average Value Number Average Value Number Average Value Number Average Value
LOANS ORIGINATED 5 $161,832 343 $166,319 214 $192,860 32 $61,606 19 $165,918 0 $0 APPLICATIONS APPROVED, NOT ACCEPTED 0 $0 39 $140,799 30 $151,693 6 $45,605 4 $165,845 0 $0 APPLICATIONS DENIED 0 $0 48 $159,135 84 $185,895 20 $58,302 9 $172,359 0 $0 APPLICATIONS WITHDRAWN 0 $0 38 $168,278 60 $160,905 3 $58,503 5 $125,174 1 $96,620 FILES CLOSED FOR INCOMPLETENESS 0 $0 7 $207,137 35 $205,514 1 $54,530 0 $0 0 $0
Aggregated Statistics For Year 2003(Based on 2 partial tracts) A) FHA, FSA/RHS & VA B) Conventional C) Refinancings D) Home Improvement Loans F) Non-occupant Loans on Number Average Value Number Average Value Number Average Value Number Average Value Number Average Value
LOANS ORIGINATED 12 $168,106 261 $164,226 619 $181,533 31 $41,278 18 $138,676 APPLICATIONS APPROVED, NOT ACCEPTED 0 $0 24 $205,444 61 $174,519 8 $49,531 2 $212,510 APPLICATIONS DENIED 1 $141,540 31 $159,395 125 $185,409 17 $40,754 5 $153,078 APPLICATIONS WITHDRAWN 1 $176,190 30 $204,993 78 $175,576 4 $80,555 2 $95,280 FILES CLOSED FOR INCOMPLETENESS 0 $0 9 $209,939 19 $200,206 1 $34,390 1 $90,790
Aggregated Statistics For Year 2002(Based on 2 partial tracts) A) FHA, FSA/RHS & VA B) Conventional C) Refinancings D) Home Improvement Loans F) Non-occupant Loans on Number Average Value Number Average Value Number Average Value Number Average Value Number Average Value
LOANS ORIGINATED 7 $162,356 236 $249,129 398 $187,317 36 $38,224 8 $126,441 APPLICATIONS APPROVED, NOT ACCEPTED 0 $0 23 $126,980 51 $156,728 15 $34,581 2 $147,910 APPLICATIONS DENIED 1 $172,940 26 $117,047 75 $179,504 14 $42,319 3 $139,030 APPLICATIONS WITHDRAWN 0 $0 18 $228,163 51 $213,968 3 $51,020 1 $188,170 FILES CLOSED FOR INCOMPLETENESS 1 $131,180 6 $158,567 20 $249,879 0 $0 0 $0
Aggregated Statistics For Year 2001(Based on 2 partial tracts) A) FHA, FSA/RHS & VA B) Conventional C) Refinancings D) Home Improvement Loans F) Non-occupant Loans on Number Average Value Number Average Value Number Average Value Number Average Value Number Average Value
LOANS ORIGINATED 17 $139,698 236 $155,896 241 $177,418 38 $43,466 6 $175,298 APPLICATIONS APPROVED, NOT ACCEPTED 0 $0 22 $155,026 28 $169,708 12 $33,325 2 $63,955 APPLICATIONS DENIED 0 $0 18 $170,924 46 $177,995 17 $42,051 2 $99,225 APPLICATIONS WITHDRAWN 2 $78,805 16 $178,231 43 $175,723 5 $40,090 0 $0 FILES CLOSED FOR INCOMPLETENESS 0 $0 4 $186,395 11 $192,295 0 $0 1 $130,600
Aggregated Statistics For Year 2000(Based on 2 partial tracts) A) FHA, FSA/RHS & VA B) Conventional C) Refinancings D) Home Improvement Loans F) Non-occupant Loans on Number Average Value Number Average Value Number Average Value Number Average Value Number Average Value
LOANS ORIGINATED 12 $136,242 207 $168,504 42 $146,746 35 $39,105 4 $94,780 APPLICATIONS APPROVED, NOT ACCEPTED 0 $0 20 $164,961 9 $148,567 8 $96,242 1 $43,690 APPLICATIONS DENIED 2 $118,780 29 $133,408 9 $134,066 11 $32,509 1 $34,500 APPLICATIONS WITHDRAWN 0 $0 17 $155,423 7 $167,761 3 $50,877 1 $36,240 FILES CLOSED FOR INCOMPLETENESS 0 $0 4 $234,805 4 $151,718 0 $0 0 $0
Aggregated Statistics For Year 1999(Based on 2 partial tracts) A) FHA, FSA/RHS & VA B) Conventional C) Refinancings D) Home Improvement Loans F) Non-occupant Loans on Number Average Value Number Average Value Number Average Value Number Average Value Number Average Value
LOANS ORIGINATED 16 $136,021 192 $159,110 106 $144,344 39 $37,756 5 $107,502 APPLICATIONS APPROVED, NOT ACCEPTED 0 $0 25 $114,310 20 $97,464 8 $29,848 2 $87,930 APPLICATIONS DENIED 2 $106,940 29 $118,611 22 $112,448 12 $27,029 1 $72,400 APPLICATIONS WITHDRAWN 1 $80,110 19 $201,198 16 $162,755 0 $0 1 $161,690 FILES CLOSED FOR INCOMPLETENESS 1 $116,750 5 $270,054 7 $144,234 2 $17,715 0 $0
Detailed HMDA statistics for the following Tracts:
0215.04
, 0217.05
Private Mortgage Insurance Companies Aggregated Statistics For Year 2009(Based on 2 partial tracts) A) Conventional B) Refinancings Number Average Value Number Average Value
LOANS ORIGINATED 20 $262,226 11 $264,856 APPLICATIONS APPROVED, NOT ACCEPTED 2 $442,645 5 $274,928 APPLICATIONS DENIED 0 $0 2 $328,390 APPLICATIONS WITHDRAWN 1 $387,040 3 $265,923 FILES CLOSED FOR INCOMPLETENESS 0 $0 1 $131,510
Aggregated Statistics For Year 2008(Based on 2 partial tracts) A) Conventional B) Refinancings C) Non-occupant Loans on Number Average Value Number Average Value Number Average Value
LOANS ORIGINATED 42 $252,464 10 $259,412 2 $144,915 APPLICATIONS APPROVED, NOT ACCEPTED 9 $270,040 7 $243,943 1 $175,890 APPLICATIONS DENIED 1 $525,870 1 $175,530 1 $203,890 APPLICATIONS WITHDRAWN 2 $194,420 0 $0 0 $0 FILES CLOSED FOR INCOMPLETENESS 1 $114,190 0 $0 0 $0
Aggregated Statistics For Year 2007(Based on 2 partial tracts) A) Conventional B) Refinancings C) Non-occupant Loans on Number Average Value Number Average Value Number Average Value
LOANS ORIGINATED 33 $245,041 6 $267,463 2 $224,465 APPLICATIONS APPROVED, NOT ACCEPTED 3 $311,677 2 $265,000 0 $0 APPLICATIONS DENIED 0 $0 0 $0 0 $0 APPLICATIONS WITHDRAWN 1 $234,970 0 $0 0 $0 FILES CLOSED FOR INCOMPLETENESS 0 $0 0 $0 0 $0
Aggregated Statistics For Year 2006(Based on 2 partial tracts) A) Conventional B) Refinancings C) Non-occupant Loans on Number Average Value Number Average Value Number Average Value
LOANS ORIGINATED 16 $229,915 1 $429,230 1 $128,980 APPLICATIONS APPROVED, NOT ACCEPTED 5 $250,286 1 $281,700 1 $214,850 APPLICATIONS DENIED 0 $0 0 $0 0 $0 APPLICATIONS WITHDRAWN 0 $0 0 $0 0 $0 FILES CLOSED FOR INCOMPLETENESS 0 $0 0 $0 0 $0
Aggregated Statistics For Year 2005(Based on 2 partial tracts) A) Conventional B) Refinancings C) Non-occupant Loans on Number Average Value Number Average Value Number Average Value
LOANS ORIGINATED 19 $217,605 6 $193,685 3 $128,687 APPLICATIONS APPROVED, NOT ACCEPTED 3 $369,900 2 $215,045 0 $0 APPLICATIONS DENIED 0 $0 0 $0 0 $0 APPLICATIONS WITHDRAWN 1 $131,650 0 $0 0 $0 FILES CLOSED FOR INCOMPLETENESS 0 $0 0 $0 0 $0
Aggregated Statistics For Year 2004(Based on 2 partial tracts) A) Conventional B) Refinancings C) Non-occupant Loans on Number Average Value Number Average Value Number Average Value
LOANS ORIGINATED 27 $221,227 8 $221,188 2 $263,675 APPLICATIONS APPROVED, NOT ACCEPTED 4 $240,242 8 $197,672 0 $0 APPLICATIONS DENIED 0 $0 0 $0 0 $0 APPLICATIONS WITHDRAWN 3 $236,263 0 $0 1 $364,590 FILES CLOSED FOR INCOMPLETENESS 1 $237,170 0 $0 0 $0
Aggregated Statistics For Year 2003(Based on 2 partial tracts) A) Conventional B) Refinancings C) Non-occupant Loans on Number Average Value Number Average Value Number Average Value
LOANS ORIGINATED 33 $212,932 27 $189,266 1 $150,700 APPLICATIONS APPROVED, NOT ACCEPTED 7 $261,196 7 $199,876 2 $180,555 APPLICATIONS DENIED 0 $0 0 $0 0 $0 APPLICATIONS WITHDRAWN 3 $244,150 2 $165,075 0 $0 FILES CLOSED FOR INCOMPLETENESS 0 $0 0 $0 0 $0
Aggregated Statistics For Year 2002(Based on 2 partial tracts) A) Conventional B) Refinancings C) Non-occupant Loans on Number Average Value Number Average Value Number Average Value
LOANS ORIGINATED 34 $183,156 15 $197,400 4 $137,688 APPLICATIONS APPROVED, NOT ACCEPTED 4 $220,298 4 $217,332 0 $0 APPLICATIONS DENIED 0 $0 1 $235,330 0 $0 APPLICATIONS WITHDRAWN 2 $300,165 1 $107,200 0 $0 FILES CLOSED FOR INCOMPLETENESS 1 $123,810 0 $0 0 $0
Aggregated Statistics For Year 2001(Based on 2 partial tracts) A) Conventional B) Refinancings Number Average Value Number Average Value
LOANS ORIGINATED 29 $206,652 7 $188,796 APPLICATIONS APPROVED, NOT ACCEPTED 5 $170,162 3 $226,427 APPLICATIONS DENIED 0 $0 0 $0 APPLICATIONS WITHDRAWN 0 $0 0 $0 FILES CLOSED FOR INCOMPLETENESS 1 $110,210 0 $0
Aggregated Statistics For Year 2000(Based on 2 partial tracts) A) Conventional B) Refinancings C) Non-occupant Loans on Number Average Value Number Average Value Number Average Value
LOANS ORIGINATED 32 $179,071 4 $173,210 1 $184,240 APPLICATIONS APPROVED, NOT ACCEPTED 3 $194,710 0 $0 0 $0 APPLICATIONS DENIED 3 $171,653 0 $0 0 $0 APPLICATIONS WITHDRAWN 1 $131,980 0 $0 0 $0 FILES CLOSED FOR INCOMPLETENESS 0 $0 0 $0 0 $0
Aggregated Statistics For Year 1999(Based on 2 partial tracts) A) Conventional B) Refinancings C) Non-occupant Loans on Number Average Value Number Average Value Number Average Value
LOANS ORIGINATED 46 $175,522 13 $165,027 0 $0 APPLICATIONS APPROVED, NOT ACCEPTED 3 $136,087 5 $133,708 0 $0 APPLICATIONS DENIED 5 $145,866 0 $0 1 $105,030 APPLICATIONS WITHDRAWN 2 $211,395 0 $0 0 $0 FILES CLOSED FOR INCOMPLETENESS 1 $378,090 0 $0 0 $0
Detailed PMIC statistics for the following Tracts:
0215.04
, 0217.05 Highland Village compared to Texas state average:
Median household income above state average. Median house value above state average. Unemployed percentage significantly below state average. Black race population percentage below state average. Hispanic race population percentage significantly below state average. Median age significantly above state average. Foreign-born population percentage below state average. Renting percentage significantly below state average. Length of stay since moving in significantly above state average. Number of rooms per house significantly above state average. House age below state average. Percentage of population with a bachelor's degree or higher significantly above state average. Highland Village on our top lists :
#16 on the list of "Top 101 cities with the largest percentage of one, detached housing units in structures (2,000+ housing units)"
#40 on the list of "Top 101 cities with the lowest number of burglaries per 100,000 residents (population 5,000+)"
#68 on the list of "Top 101 cities with the highest percentage of family households, population 10,000+"
#100 on the list of "Top 100 cities with biggest houses (pop. 5,000+)"
#9 on the list of "Top 101 counties with the lowest number of deaths per 1000 residents 2007-2013 (pop. 50,000+)"
#11 on the list of "Top 101 counties with the highest surface withdrawal of fresh water for public supply"
#15 on the list of "Top 101 counties with the highest total withdrawal of fresh water for public supply"
#19 on the list of "Top 101 counties with the largest number of children under 18 without health insurance coverage in 2000 (pop. 50,000+)"
#33 on the list of "Top 101 counties with the most Evangelical Protestant adherents"
Top Patent Applicants
Tony Quisenberry (33)
Steven D. Roemerman (22)
Steven Gail Johnson (11)
Richard A. Dunipace (10)
Elli Makrides-Saravanos (9)
Michael P. Duffy (8)
Venket Kandanala (6)
Donald Vaughn Neel (6)
David A. Felio (6)
Scott L. Miller (5)
Total of 284 patent applications in 2008-2024.


 Recent articles from our blog. Our writers, many of them Ph.D. graduates or candidates, create easy-to-read articles on a wide variety of topics.

 (4.1 miles
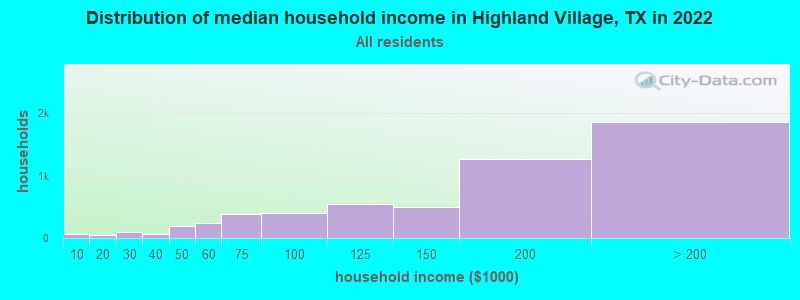


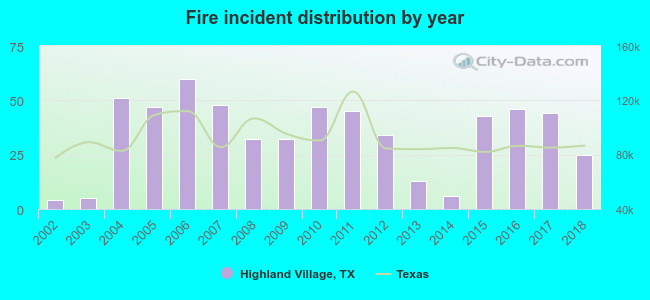 According to the data from the years 2002 - 2018 the average number of fire incidents per year is 34. The highest number of reported fire incidents - 60 took place in 2006, and the least - 4 in 2002. The data has a rising trend.
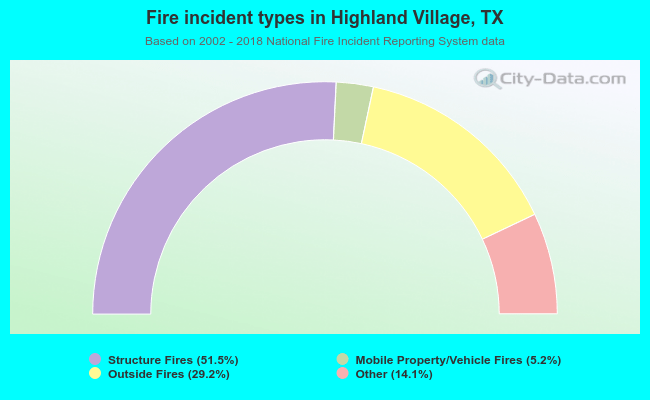 When looking into fire subcategories, the most reports belonged to: Structure Fires (51.5%), and Outside Fires (29.2%).