Donora, Pennsylvania Submit your own pictures of this borough and show them to the world
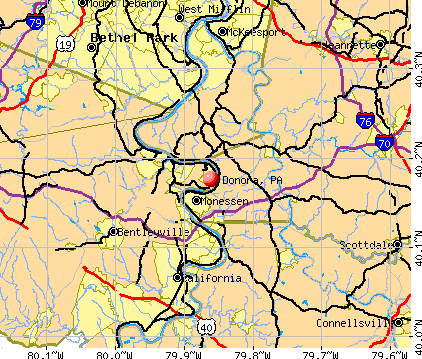
OSM Map
General Map
Google Map
MSN Map
OSM Map
General Map
Google Map
MSN Map
OSM Map
General Map
Google Map
MSN Map
OSM Map
General Map
Google Map
MSN Map
Please wait while loading the map...
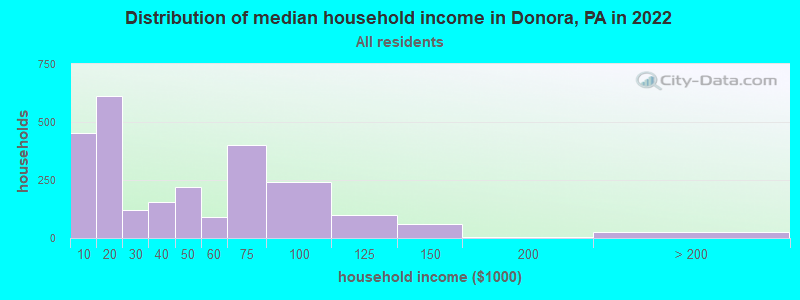
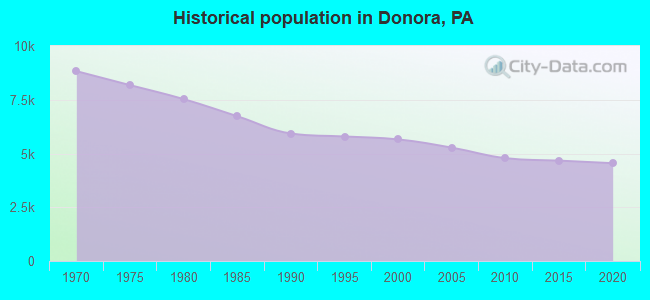
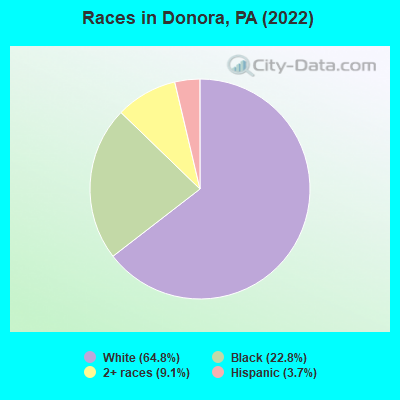
Population in 2022: 4,517 (100% urban, 0% rural). Population change since 2000: -20.1%Males: 2,194 Females: 2,323
March 2022 cost of living index in Donora: 88.2 (less than average, U.S. average is 100) Percentage of residents living in poverty in 2022: 36.0%for White Non-Hispanic residents , 52.4% for Black residents , 76.7% for Hispanic or Latino residents , 74.7% for two or more races residents )Business Search - 14 Million verified businesses
Data:
Median household income ($)
Median household income (% change since 2000)
Household income diversity
Ratio of average income to average house value (%)
Ratio of average income to average rent
Median household income ($) - White
Median household income ($) - Black or African American
Median household income ($) - Asian
Median household income ($) - Hispanic or Latino
Median household income ($) - American Indian and Alaska Native
Median household income ($) - Multirace
Median household income ($) - Other Race
Median household income for houses/condos with a mortgage ($)
Median household income for apartments without a mortgage ($)
Races - White alone (%)
Races - White alone (% change since 2000)
Races - Black alone (%)
Races - Black alone (% change since 2000)
Races - American Indian alone (%)
Races - American Indian alone (% change since 2000)
Races - Asian alone (%)
Races - Asian alone (% change since 2000)
Races - Hispanic (%)
Races - Hispanic (% change since 2000)
Races - Native Hawaiian and Other Pacific Islander alone (%)
Races - Native Hawaiian and Other Pacific Islander alone (% change since 2000)
Races - Two or more races (%)
Races - Two or more races (% change since 2000)
Races - Other race alone (%)
Races - Other race alone (% change since 2000)
Racial diversity
Unemployment (%)
Unemployment (% change since 2000)
Unemployment (%) - White
Unemployment (%) - Black or African American
Unemployment (%) - Asian
Unemployment (%) - Hispanic or Latino
Unemployment (%) - American Indian and Alaska Native
Unemployment (%) - Multirace
Unemployment (%) - Other Race
Population density (people per square mile)
Population - Males (%)
Population - Females (%)
Population - Males (%) - White
Population - Males (%) - Black or African American
Population - Males (%) - Asian
Population - Males (%) - Hispanic or Latino
Population - Males (%) - American Indian and Alaska Native
Population - Males (%) - Multirace
Population - Males (%) - Other Race
Population - Females (%) - White
Population - Females (%) - Black or African American
Population - Females (%) - Asian
Population - Females (%) - Hispanic or Latino
Population - Females (%) - American Indian and Alaska Native
Population - Females (%) - Multirace
Population - Females (%) - Other Race
Coronavirus confirmed cases (Jun 10, 2024)
Deaths caused by coronavirus (Jun 10, 2024)
Coronavirus confirmed cases (per 100k population) (Jun 10, 2024)
Deaths caused by coronavirus (per 100k population) (Jun 10, 2024)
Daily increase in number of cases (Jun 10, 2024)
Weekly increase in number of cases (Jun 10, 2024)
Cases doubled (in days) (Jun 10, 2024)
Hospitalized patients (Apr 18, 2022)
Negative test results (Apr 18, 2022)
Total test results (Apr 18, 2022)
COVID Vaccine doses distributed (per 100k population) (Sep 19, 2023)
COVID Vaccine doses administered (per 100k population) (Sep 19, 2023)
COVID Vaccine doses distributed (Sep 19, 2023)
COVID Vaccine doses administered (Sep 19, 2023)
Likely homosexual households (%)
Likely homosexual households (% change since 2000)
Likely homosexual households - Lesbian couples (%)
Likely homosexual households - Lesbian couples (% change since 2000)
Likely homosexual households - Gay men (%)
Likely homosexual households - Gay men (% change since 2000)
Cost of living index
Median gross rent ($)
Median contract rent ($)
Median monthly housing costs ($)
Median house or condo value ($)
Median house or condo value ($ change since 2000)
Mean house or condo value by units in structure - 1, detached ($)
Mean house or condo value by units in structure - 1, attached ($)
Mean house or condo value by units in structure - 2 ($)
Mean house or condo value by units in structure by units in structure - 3 or 4 ($)
Mean house or condo value by units in structure - 5 or more ($)
Mean house or condo value by units in structure - Boat, RV, van, etc. ($)
Mean house or condo value by units in structure - Mobile home ($)
Median house or condo value ($) - White
Median house or condo value ($) - Black or African American
Median house or condo value ($) - Asian
Median house or condo value ($) - Hispanic or Latino
Median house or condo value ($) - American Indian and Alaska Native
Median house or condo value ($) - Multirace
Median house or condo value ($) - Other Race
Median resident age
Resident age diversity
Median resident age - Males
Median resident age - Females
Median resident age - White
Median resident age - Black or African American
Median resident age - Asian
Median resident age - Hispanic or Latino
Median resident age - American Indian and Alaska Native
Median resident age - Multirace
Median resident age - Other Race
Median resident age - Males - White
Median resident age - Males - Black or African American
Median resident age - Males - Asian
Median resident age - Males - Hispanic or Latino
Median resident age - Males - American Indian and Alaska Native
Median resident age - Males - Multirace
Median resident age - Males - Other Race
Median resident age - Females - White
Median resident age - Females - Black or African American
Median resident age - Females - Asian
Median resident age - Females - Hispanic or Latino
Median resident age - Females - American Indian and Alaska Native
Median resident age - Females - Multirace
Median resident age - Females - Other Race
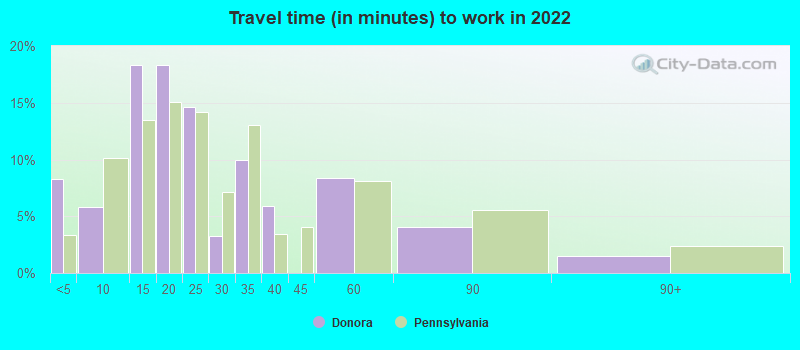
Commute - mean travel time to work (minutes)
Travel time to work - Less than 5 minutes (%)
Travel time to work - Less than 5 minutes (% change since 2000)
Travel time to work - 5 to 9 minutes (%)
Travel time to work - 5 to 9 minutes (% change since 2000)
Travel time to work - 10 to 19 minutes (%)
Travel time to work - 10 to 19 minutes (% change since 2000)
Travel time to work - 20 to 29 minutes (%)
Travel time to work - 20 to 29 minutes (% change since 2000)
Travel time to work - 30 to 39 minutes (%)
Travel time to work - 30 to 39 minutes (% change since 2000)
Travel time to work - 40 to 59 minutes (%)
Travel time to work - 40 to 59 minutes (% change since 2000)
Travel time to work - 60 to 89 minutes (%)
Travel time to work - 60 to 89 minutes (% change since 2000)
Travel time to work - 90 or more minutes (%)
Travel time to work - 90 or more minutes (% change since 2000)
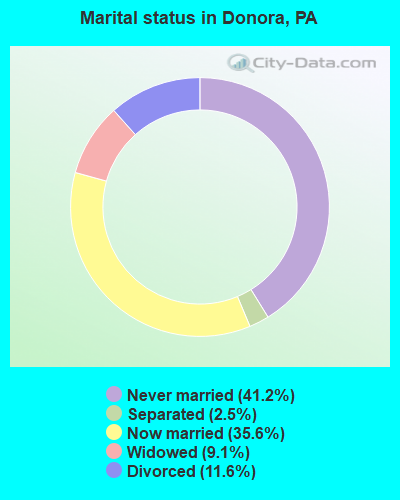
Marital status - Never married (%)
Marital status - Now married (%)
Marital status - Separated (%)
Marital status - Widowed (%)
Marital status - Divorced (%)
Median family income ($)
Median family income (% change since 2000)
Median non-family income ($)
Median non-family income (% change since 2000)
Median per capita income ($)
Median per capita income (% change since 2000)
Median family income ($) - White
Median family income ($) - Black or African American
Median family income ($) - Asian
Median family income ($) - Hispanic or Latino
Median family income ($) - American Indian and Alaska Native
Median family income ($) - Multirace
Median family income ($) - Other Race
Median year house/condo built
Median year apartment built
Year house built - Built 2005 or later (%)
Year house built - Built 2000 to 2004 (%)
Year house built - Built 1990 to 1999 (%)
Year house built - Built 1980 to 1989 (%)
Year house built - Built 1970 to 1979 (%)
Year house built - Built 1960 to 1969 (%)
Year house built - Built 1950 to 1959 (%)
Year house built - Built 1940 to 1949 (%)
Year house built - Built 1939 or earlier (%)
Average household size
Household density (households per square mile)
Average household size - White
Average household size - Black or African American
Average household size - Asian
Average household size - Hispanic or Latino
Average household size - American Indian and Alaska Native
Average household size - Multirace
Average household size - Other Race
Occupied housing units (%)
Vacant housing units (%)
Owner occupied housing units (%)
Renter occupied housing units (%)
Vacancy status - For rent (%)
Vacancy status - For sale only (%)
Vacancy status - Rented or sold, not occupied (%)
Vacancy status - For seasonal, recreational, or occasional use (%)
Vacancy status - For migrant workers (%)
Vacancy status - Other vacant (%)
Residents with income below the poverty level (%)
Residents with income below 50% of the poverty level (%)
Children below poverty level (%)
Poor families by family type - Married-couple family (%)
Poor families by family type - Male, no wife present (%)
Poor families by family type - Female, no husband present (%)
Poverty status for native-born residents (%)
Poverty status for foreign-born residents (%)
Poverty among high school graduates not in families (%)
Poverty among people who did not graduate high school not in families (%)
Residents with income below the poverty level (%) - White
Residents with income below the poverty level (%) - Black or African American
Residents with income below the poverty level (%) - Asian
Residents with income below the poverty level (%) - Hispanic or Latino
Residents with income below the poverty level (%) - American Indian and Alaska Native
Residents with income below the poverty level (%) - Multirace
Residents with income below the poverty level (%) - Other Race
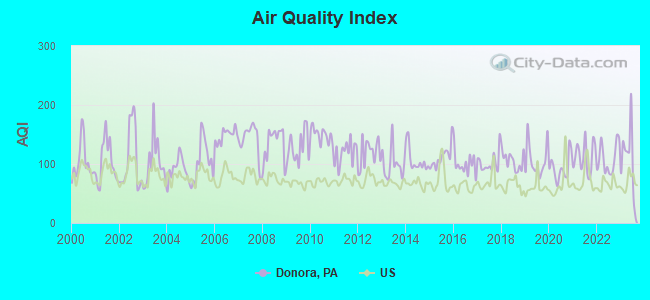
Air pollution - Air Quality Index (AQI)
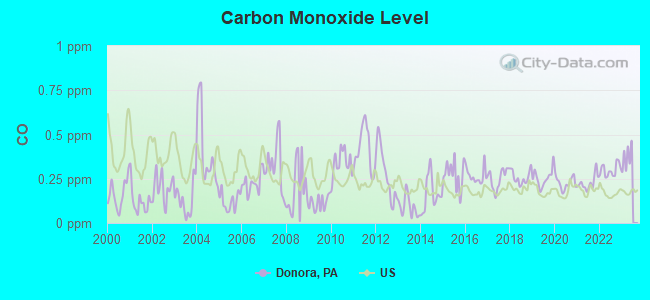
Air pollution - CO
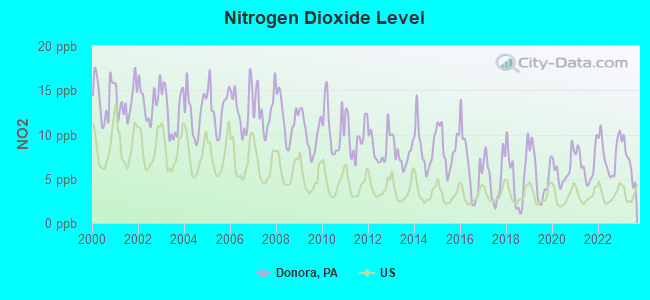
Air pollution - NO2
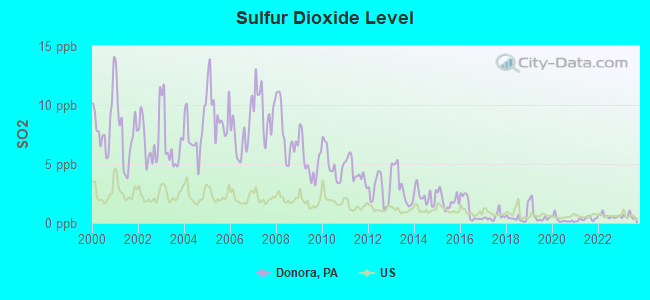
Air pollution - SO2
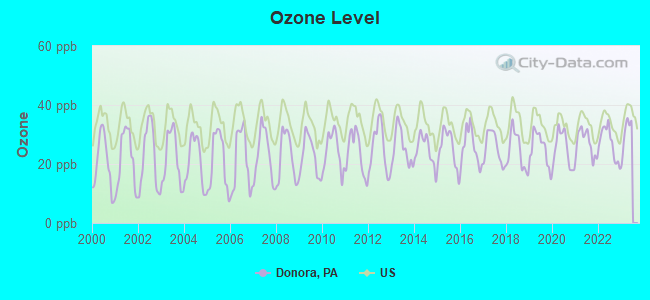
Air pollution - Ozone
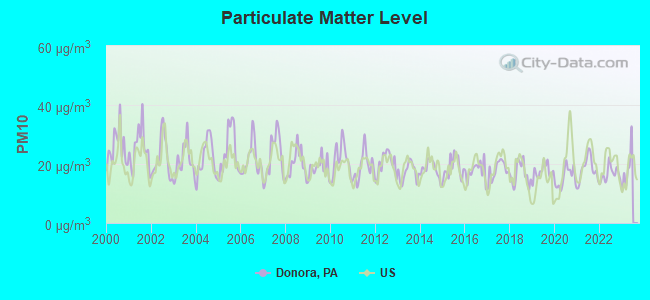
Air pollution - PM10
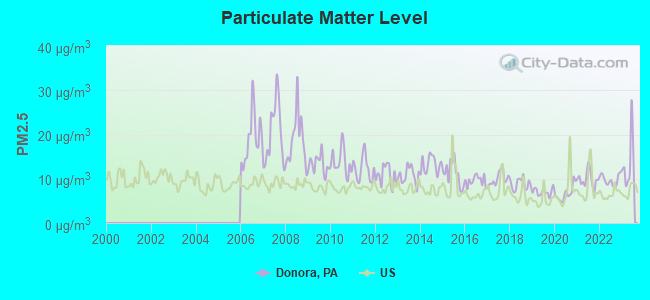
Air pollution - PM25
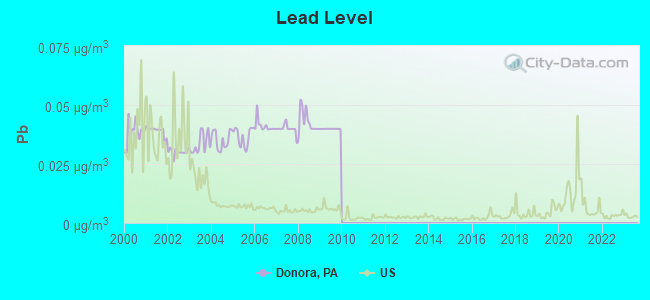
Air pollution - Pb
Crime - Murders per 100,000 population
Crime - Rapes per 100,000 population
Crime - Robberies per 100,000 population
Crime - Assaults per 100,000 population
Crime - Burglaries per 100,000 population
Crime - Thefts per 100,000 population
Crime - Auto thefts per 100,000 population
Crime - Arson per 100,000 population
Crime - City-data.com crime index
Crime - Violent crime index
Crime - Property crime index
Crime - Murders per 100,000 population (5 year average)
Crime - Rapes per 100,000 population (5 year average)
Crime - Robberies per 100,000 population (5 year average)
Crime - Assaults per 100,000 population (5 year average)
Crime - Burglaries per 100,000 population (5 year average)
Crime - Thefts per 100,000 population (5 year average)
Crime - Auto thefts per 100,000 population (5 year average)
Crime - Arson per 100,000 population (5 year average)
Crime - City-data.com crime index (5 year average)
Crime - Violent crime index (5 year average)
Crime - Property crime index (5 year average)
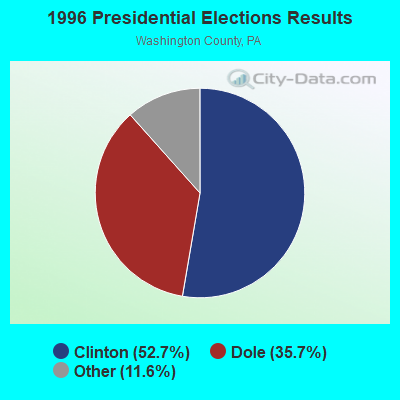
1996 Presidential Elections Results (%) - Democratic Party (Clinton)
1996 Presidential Elections Results (%) - Republican Party (Dole)
1996 Presidential Elections Results (%) - Other
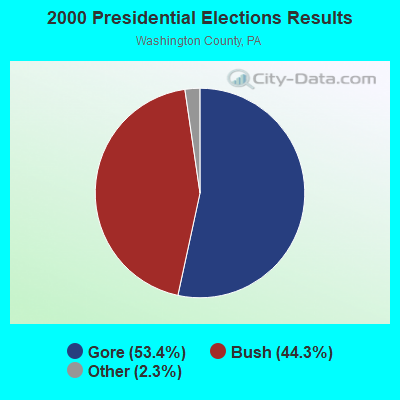
2000 Presidential Elections Results (%) - Democratic Party (Gore)
2000 Presidential Elections Results (%) - Republican Party (Bush)
2000 Presidential Elections Results (%) - Other
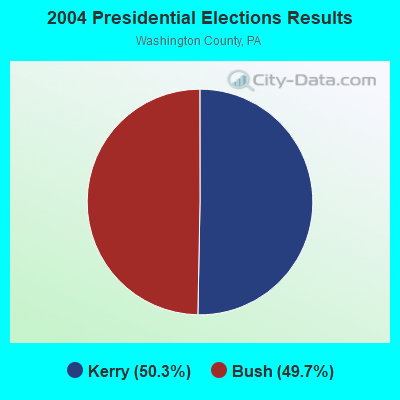
2004 Presidential Elections Results (%) - Democratic Party (Kerry)
2004 Presidential Elections Results (%) - Republican Party (Bush)
2004 Presidential Elections Results (%) - Other
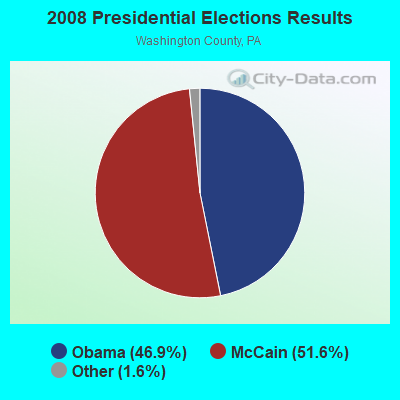
2008 Presidential Elections Results (%) - Democratic Party (Obama)
2008 Presidential Elections Results (%) - Republican Party (McCain)
2008 Presidential Elections Results (%) - Other
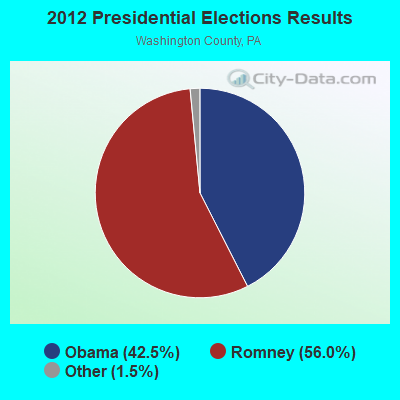
2012 Presidential Elections Results (%) - Democratic Party (Obama)
2012 Presidential Elections Results (%) - Republican Party (Romney)
2012 Presidential Elections Results (%) - Other
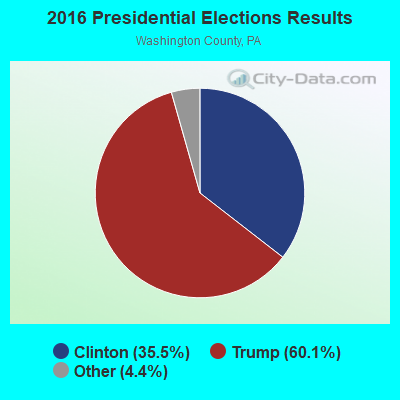
2016 Presidential Elections Results (%) - Democratic Party (Clinton)
2016 Presidential Elections Results (%) - Republican Party (Trump)
2016 Presidential Elections Results (%) - Other
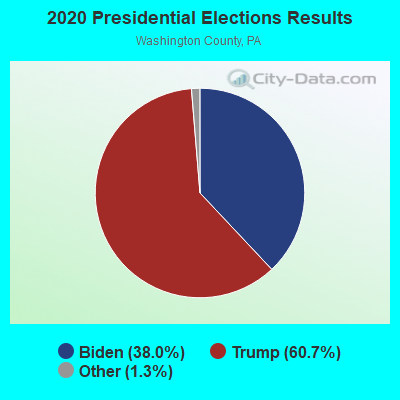
2020 Presidential Elections Results (%) - Democratic Party (Biden)
2020 Presidential Elections Results (%) - Republican Party (Trump)
2020 Presidential Elections Results (%) - Other
Ancestries Reported - Arab (%)
Ancestries Reported - Czech (%)
Ancestries Reported - Danish (%)
Ancestries Reported - Dutch (%)
Ancestries Reported - English (%)
Ancestries Reported - French (%)
Ancestries Reported - French Canadian (%)
Ancestries Reported - German (%)
Ancestries Reported - Greek (%)
Ancestries Reported - Hungarian (%)
Ancestries Reported - Irish (%)
Ancestries Reported - Italian (%)
Ancestries Reported - Lithuanian (%)
Ancestries Reported - Norwegian (%)
Ancestries Reported - Polish (%)
Ancestries Reported - Portuguese (%)
Ancestries Reported - Russian (%)
Ancestries Reported - Scotch-Irish (%)
Ancestries Reported - Scottish (%)
Ancestries Reported - Slovak (%)
Ancestries Reported - Subsaharan African (%)
Ancestries Reported - Swedish (%)
Ancestries Reported - Swiss (%)
Ancestries Reported - Ukrainian (%)
Ancestries Reported - United States (%)
Ancestries Reported - Welsh (%)
Ancestries Reported - West Indian (%)
Ancestries Reported - Other (%)
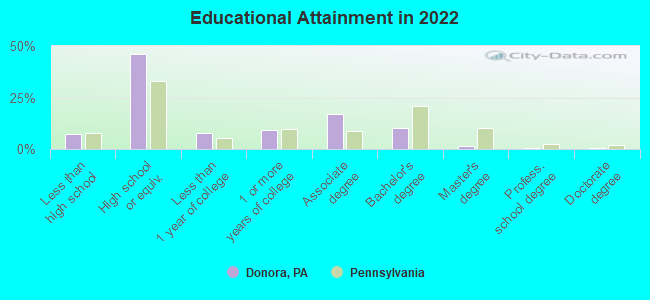
Educational Attainment - No schooling completed (%)
Educational Attainment - Less than high school (%)
Educational Attainment - High school or equivalent (%)
Educational Attainment - Less than 1 year of college (%)
Educational Attainment - 1 or more years of college (%)
Educational Attainment - Associate degree (%)
Educational Attainment - Bachelor's degree (%)
Educational Attainment - Master's degree (%)
Educational Attainment - Professional school degree (%)
Educational Attainment - Doctorate degree (%)
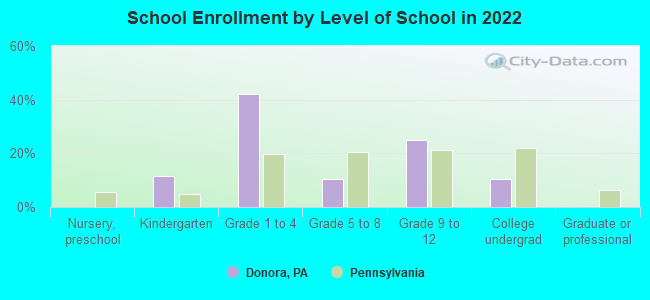
School Enrollment - Nursery, preschool (%)
School Enrollment - Kindergarten (%)
School Enrollment - Grade 1 to 4 (%)
School Enrollment - Grade 5 to 8 (%)
School Enrollment - Grade 9 to 12 (%)
School Enrollment - College undergrad (%)
School Enrollment - Graduate or professional (%)
School Enrollment - Not enrolled in school (%)
School enrollment - Public schools (%)
School enrollment - Private schools (%)
School enrollment - Not enrolled (%)
Median number of rooms in houses and condos
Median number of rooms in apartments
Housing units lacking complete plumbing facilities (%)
Housing units lacking complete kitchen facilities (%)
Density of houses
Urban houses (%)
Rural houses (%)
Households with people 60 years and over (%)
Households with people 65 years and over (%)
Households with people 75 years and over (%)
Households with one or more nonrelatives (%)
Households with no nonrelatives (%)
Population in households (%)
Family households (%)
Nonfamily households (%)
Population in families (%)
Family households with own children (%)
Median number of bedrooms in owner occupied houses
Mean number of bedrooms in owner occupied houses
Median number of bedrooms in renter occupied houses
Mean number of bedrooms in renter occupied houses
Median number of vehichles in owner occupied houses
Mean number of vehichles in owner occupied houses
Median number of vehichles in renter occupied houses
Mean number of vehichles in renter occupied houses
Mortgage status - with mortgage (%)
Mortgage status - with second mortgage (%)
Mortgage status - with home equity loan (%)
Mortgage status - with both second mortgage and home equity loan (%)
Mortgage status - without a mortgage (%)
Average family size
Average family size - White
Average family size - Black or African American
Average family size - Asian
Average family size - Hispanic or Latino
Average family size - American Indian and Alaska Native
Average family size - Multirace
Average family size - Other Race
Geographical mobility - Same house 1 year ago (%)
Geographical mobility - Moved within same county (%)
Geographical mobility - Moved from different county within same state (%)
Geographical mobility - Moved from different state (%)
Geographical mobility - Moved from abroad (%)
Place of birth - Born in state of residence (%)
Place of birth - Born in other state (%)
Place of birth - Native, outside of US (%)
Place of birth - Foreign born (%)
Housing units in structures - 1, detached (%)
Housing units in structures - 1, attached (%)
Housing units in structures - 2 (%)
Housing units in structures - 3 or 4 (%)
Housing units in structures - 5 to 9 (%)
Housing units in structures - 10 to 19 (%)
Housing units in structures - 20 to 49 (%)
Housing units in structures - 50 or more (%)
Housing units in structures - Mobile home (%)
Housing units in structures - Boat, RV, van, etc. (%)
House/condo owner moved in on average (years ago)
Renter moved in on average (years ago)
Year householder moved into unit - Moved in 1999 to March 2000 (%)
Year householder moved into unit - Moved in 1995 to 1998 (%)
Year householder moved into unit - Moved in 1990 to 1994 (%)
Year householder moved into unit - Moved in 1980 to 1989 (%)
Year householder moved into unit - Moved in 1970 to 1979 (%)
Year householder moved into unit - Moved in 1969 or earlier (%)
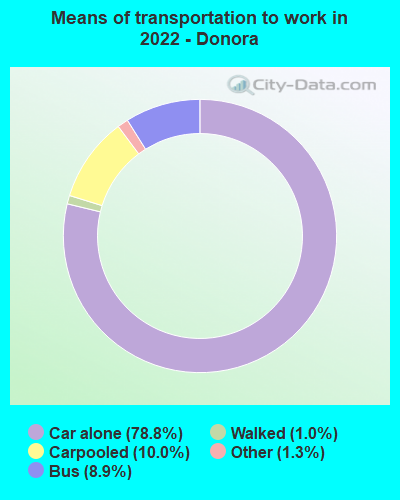
Means of transportation to work - Drove car alone (%)
Means of transportation to work - Carpooled (%)
Means of transportation to work - Public transportation (%)
Means of transportation to work - Bus or trolley bus (%)
Means of transportation to work - Streetcar or trolley car (%)
Means of transportation to work - Subway or elevated (%)
Means of transportation to work - Railroad (%)
Means of transportation to work - Ferryboat (%)
Means of transportation to work - Taxicab (%)
Means of transportation to work - Motorcycle (%)
Means of transportation to work - Bicycle (%)
Means of transportation to work - Walked (%)
Means of transportation to work - Other means (%)
Working at home (%)
Industry diversity
Most Common Industries - Agriculture, forestry, fishing and hunting, and mining (%)
Most Common Industries - Agriculture, forestry, fishing and hunting (%)
Most Common Industries - Mining, quarrying, and oil and gas extraction (%)
Most Common Industries - Construction (%)
Most Common Industries - Manufacturing (%)
Most Common Industries - Wholesale trade (%)
Most Common Industries - Retail trade (%)
Most Common Industries - Transportation and warehousing, and utilities (%)
Most Common Industries - Transportation and warehousing (%)
Most Common Industries - Utilities (%)
Most Common Industries - Information (%)
Most Common Industries - Finance and insurance, and real estate and rental and leasing (%)
Most Common Industries - Finance and insurance (%)
Most Common Industries - Real estate and rental and leasing (%)
Most Common Industries - Professional, scientific, and management, and administrative and waste management services (%)
Most Common Industries - Professional, scientific, and technical services (%)
Most Common Industries - Management of companies and enterprises (%)
Most Common Industries - Administrative and support and waste management services (%)
Most Common Industries - Educational services, and health care and social assistance (%)
Most Common Industries - Educational services (%)
Most Common Industries - Health care and social assistance (%)
Most Common Industries - Arts, entertainment, and recreation, and accommodation and food services (%)
Most Common Industries - Arts, entertainment, and recreation (%)
Most Common Industries - Accommodation and food services (%)
Most Common Industries - Other services, except public administration (%)
Most Common Industries - Public administration (%)
Occupation diversity
Most Common Occupations - Management, business, science, and arts occupations (%)
Most Common Occupations - Management, business, and financial occupations (%)
Most Common Occupations - Management occupations (%)
Most Common Occupations - Business and financial operations occupations (%)
Most Common Occupations - Computer, engineering, and science occupations (%)
Most Common Occupations - Computer and mathematical occupations (%)
Most Common Occupations - Architecture and engineering occupations (%)
Most Common Occupations - Life, physical, and social science occupations (%)
Most Common Occupations - Education, legal, community service, arts, and media occupations (%)
Most Common Occupations - Community and social service occupations (%)
Most Common Occupations - Legal occupations (%)
Most Common Occupations - Education, training, and library occupations (%)
Most Common Occupations - Arts, design, entertainment, sports, and media occupations (%)
Most Common Occupations - Healthcare practitioners and technical occupations (%)
Most Common Occupations - Health diagnosing and treating practitioners and other technical occupations (%)
Most Common Occupations - Health technologists and technicians (%)
Most Common Occupations - Service occupations (%)
Most Common Occupations - Healthcare support occupations (%)
Most Common Occupations - Protective service occupations (%)
Most Common Occupations - Fire fighting and prevention, and other protective service workers including supervisors (%)
Most Common Occupations - Law enforcement workers including supervisors (%)
Most Common Occupations - Food preparation and serving related occupations (%)
Most Common Occupations - Building and grounds cleaning and maintenance occupations (%)
Most Common Occupations - Personal care and service occupations (%)
Most Common Occupations - Sales and office occupations (%)
Most Common Occupations - Sales and related occupations (%)
Most Common Occupations - Office and administrative support occupations (%)
Most Common Occupations - Natural resources, construction, and maintenance occupations (%)
Most Common Occupations - Farming, fishing, and forestry occupations (%)
Most Common Occupations - Construction and extraction occupations (%)
Most Common Occupations - Installation, maintenance, and repair occupations (%)
Most Common Occupations - Production, transportation, and material moving occupations (%)
Most Common Occupations - Production occupations (%)
Most Common Occupations - Transportation occupations (%)
Most Common Occupations - Material moving occupations (%)
People in Group quarters - Institutionalized population (%)
People in Group quarters - Correctional institutions (%)
People in Group quarters - Federal prisons and detention centers (%)
People in Group quarters - Halfway houses (%)
People in Group quarters - Local jails and other confinement facilities (including police lockups) (%)
People in Group quarters - Military disciplinary barracks (%)
People in Group quarters - State prisons (%)
People in Group quarters - Other types of correctional institutions (%)
People in Group quarters - Nursing homes (%)
People in Group quarters - Hospitals/wards, hospices, and schools for the handicapped (%)
People in Group quarters - Hospitals/wards and hospices for chronically ill (%)
People in Group quarters - Hospices or homes for chronically ill (%)
People in Group quarters - Military hospitals or wards for chronically ill (%)
People in Group quarters - Other hospitals or wards for chronically ill (%)
People in Group quarters - Hospitals or wards for drug/alcohol abuse (%)
People in Group quarters - Mental (Psychiatric) hospitals or wards (%)
People in Group quarters - Schools, hospitals, or wards for the mentally retarded (%)
People in Group quarters - Schools, hospitals, or wards for the physically handicapped (%)
People in Group quarters - Institutions for the deaf (%)
People in Group quarters - Institutions for the blind (%)
People in Group quarters - Orthopedic wards and institutions for the physically handicapped (%)
People in Group quarters - Wards in general hospitals for patients who have no usual home elsewhere (%)
People in Group quarters - Wards in military hospitals for patients who have no usual home elsewhere (%)
People in Group quarters - Juvenile institutions (%)
People in Group quarters - Long-term care (%)
People in Group quarters - Homes for abused, dependent, and neglected children (%)
People in Group quarters - Residential treatment centers for emotionally disturbed children (%)
People in Group quarters - Training schools for juvenile delinquents (%)
People in Group quarters - Short-term care, detention or diagnostic centers for delinquent children (%)
People in Group quarters - Type of juvenile institution unknown (%)
People in Group quarters - Noninstitutionalized population (%)
People in Group quarters - College dormitories (includes college quarters off campus) (%)
People in Group quarters - Military quarters (%)
People in Group quarters - On base (%)
People in Group quarters - Barracks, unaccompanied personnel housing (UPH), (Enlisted/Officer), ;and similar group living quarters for military personnel (%)
People in Group quarters - Transient quarters for temporary residents (%)
People in Group quarters - Military ships (%)
People in Group quarters - Group homes (%)
People in Group quarters - Homes or halfway houses for drug/alcohol abuse (%)
People in Group quarters - Homes for the mentally ill (%)
People in Group quarters - Homes for the mentally retarded (%)
People in Group quarters - Homes for the physically handicapped (%)
People in Group quarters - Other group homes (%)
People in Group quarters - Religious group quarters (%)
People in Group quarters - Dormitories (%)
People in Group quarters - Agriculture workers' dormitories on farms (%)
People in Group quarters - Job Corps and vocational training facilities (%)
People in Group quarters - Other workers' dormitories (%)
People in Group quarters - Crews of maritime vessels (%)
People in Group quarters - Other nonhousehold living situations (%)
People in Group quarters - Other noninstitutional group quarters (%)
Residents speaking English at home (%)
Residents speaking English at home - Born in the United States (%)
Residents speaking English at home - Native, born elsewhere (%)
Residents speaking English at home - Foreign born (%)
Residents speaking Spanish at home (%)
Residents speaking Spanish at home - Born in the United States (%)
Residents speaking Spanish at home - Native, born elsewhere (%)
Residents speaking Spanish at home - Foreign born (%)
Residents speaking other language at home (%)
Residents speaking other language at home - Born in the United States (%)
Residents speaking other language at home - Native, born elsewhere (%)
Residents speaking other language at home - Foreign born (%)
Class of Workers - Employee of private company (%)
Class of Workers - Self-employed in own incorporated business (%)
Class of Workers - Private not-for-profit wage and salary workers (%)
Class of Workers - Local government workers (%)
Class of Workers - State government workers (%)
Class of Workers - Federal government workers (%)
Class of Workers - Self-employed workers in own not incorporated business and Unpaid family workers (%)
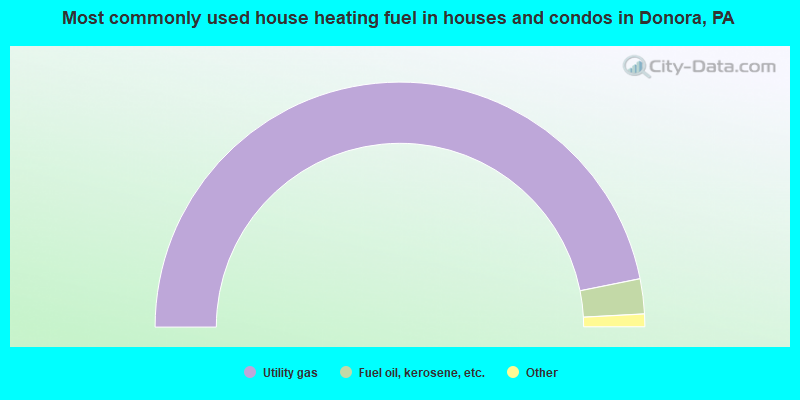
House heating fuel used in houses and condos - Utility gas (%)
House heating fuel used in houses and condos - Bottled, tank, or LP gas (%)
House heating fuel used in houses and condos - Electricity (%)
House heating fuel used in houses and condos - Fuel oil, kerosene, etc. (%)
House heating fuel used in houses and condos - Coal or coke (%)
House heating fuel used in houses and condos - Wood (%)
House heating fuel used in houses and condos - Solar energy (%)
House heating fuel used in houses and condos - Other fuel (%)
House heating fuel used in houses and condos - No fuel used (%)
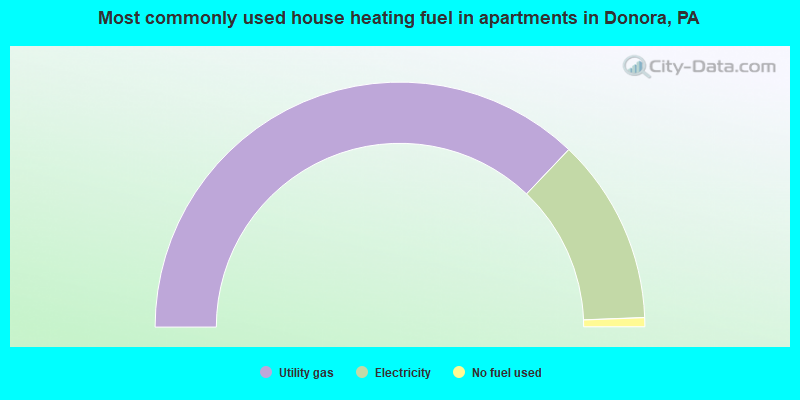
House heating fuel used in apartments - Utility gas (%)
House heating fuel used in apartments - Bottled, tank, or LP gas (%)
House heating fuel used in apartments - Electricity (%)
House heating fuel used in apartments - Fuel oil, kerosene, etc. (%)
House heating fuel used in apartments - Coal or coke (%)
House heating fuel used in apartments - Wood (%)
House heating fuel used in apartments - Solar energy (%)
House heating fuel used in apartments - Other fuel (%)
House heating fuel used in apartments - No fuel used (%)
Armed forces status - In Armed Forces (%)
Armed forces status - Civilian (%)
Armed forces status - Civilian - Veteran (%)
Armed forces status - Civilian - Nonveteran (%)
Fatal accidents locations in years 2005-2021
Fatal accidents locations in 2005
Fatal accidents locations in 2006
Fatal accidents locations in 2007
Fatal accidents locations in 2008
Fatal accidents locations in 2009
Fatal accidents locations in 2010
Fatal accidents locations in 2011
Fatal accidents locations in 2012
Fatal accidents locations in 2013
Fatal accidents locations in 2014
Fatal accidents locations in 2015
Fatal accidents locations in 2016
Fatal accidents locations in 2017
Fatal accidents locations in 2018
Fatal accidents locations in 2019
Fatal accidents locations in 2020
Fatal accidents locations in 2021
Alcohol use - People drinking some alcohol every month (%)
Alcohol use - People not drinking at all (%)
Alcohol use - Average days/month drinking alcohol
Alcohol use - Average drinks/week
Alcohol use - Average days/year people drink much
Audiometry - Average condition of hearing (%)
Audiometry - People that can hear a whisper from across a quiet room (%)
Audiometry - People that can hear normal voice from across a quiet room (%)
Audiometry - Ears ringing, roaring, buzzing (%)
Audiometry - Had a job exposure to loud noise (%)
Audiometry - Had off-work exposure to loud noise (%)
Blood Pressure & Cholesterol - Has high blood pressure (%)
Blood Pressure & Cholesterol - Checking blood pressure at home (%)
Blood Pressure & Cholesterol - Frequently checking blood cholesterol (%)
Blood Pressure & Cholesterol - Has high cholesterol level (%)
Consumer Behavior - Money monthly spent on food at supermarket/grocery store
Consumer Behavior - Money monthly spent on food at other stores
Consumer Behavior - Money monthly spent on eating out
Consumer Behavior - Money monthly spent on carryout/delivered foods
Consumer Behavior - Income spent on food at supermarket/grocery store (%)
Consumer Behavior - Income spent on food at other stores (%)
Consumer Behavior - Income spent on eating out (%)
Consumer Behavior - Income spent on carryout/delivered foods (%)
Current Health Status - General health condition (%)
Current Health Status - Blood donors (%)
Current Health Status - Has blood ever tested for HIV virus (%)
Current Health Status - Left-handed people (%)
Dermatology - People using sunscreen (%)
Diabetes - Diabetics (%)
Diabetes - Had a blood test for high blood sugar (%)
Diabetes - People taking insulin (%)
Diet Behavior & Nutrition - Diet health (%)
Diet Behavior & Nutrition - Milk product consumption (# of products/month)
Diet Behavior & Nutrition - Meals not home prepared (#/week)
Diet Behavior & Nutrition - Meals from fast food or pizza place (#/week)
Diet Behavior & Nutrition - Ready-to-eat foods (#/month)
Diet Behavior & Nutrition - Frozen meals/pizza (#/month)
Drug Use - People that ever used marijuana or hashish (%)
Drug Use - Ever used hard drugs (%)
Drug Use - Ever used any form of cocaine (%)
Drug Use - Ever used heroin (%)
Drug Use - Ever used methamphetamine (%)
Health Insurance - People covered by health insurance (%)
Kidney Conditions-Urology - Avg. # of times urinating at night
Medical Conditions - People with asthma (%)
Medical Conditions - People with anemia (%)
Medical Conditions - People with psoriasis (%)
Medical Conditions - People with overweight (%)
Medical Conditions - Elderly people having difficulties in thinking or remembering (%)
Medical Conditions - People who ever received blood transfusion (%)
Medical Conditions - People having trouble seeing even with glass/contacts (%)
Medical Conditions - People with arthritis (%)
Medical Conditions - People with gout (%)
Medical Conditions - People with congestive heart failure (%)
Medical Conditions - People with coronary heart disease (%)
Medical Conditions - People with angina pectoris (%)
Medical Conditions - People who ever had heart attack (%)
Medical Conditions - People who ever had stroke (%)
Medical Conditions - People with emphysema (%)
Medical Conditions - People with thyroid problem (%)
Medical Conditions - People with chronic bronchitis (%)
Medical Conditions - People with any liver condition (%)
Medical Conditions - People who ever had cancer or malignancy (%)
Mental Health - People who have little interest in doing things (%)
Mental Health - People feeling down, depressed, or hopeless (%)
Mental Health - People who have trouble sleeping or sleeping too much (%)
Mental Health - People feeling tired or having little energy (%)
Mental Health - People with poor appetite or overeating (%)
Mental Health - People feeling bad about themself (%)
Mental Health - People who have trouble concentrating on things (%)
Mental Health - People moving or speaking slowly or too fast (%)
Mental Health - People having thoughts they would be better off dead (%)
Oral Health - Average years since last visit a dentist
Oral Health - People embarrassed because of mouth (%)
Oral Health - People with gum disease (%)
Oral Health - General health of teeth and gums (%)
Oral Health - Average days a week using dental floss/device
Oral Health - Average days a week using mouthwash for dental problem
Oral Health - Average number of teeth
Pesticide Use - Households using pesticides to control insects (%)
Pesticide Use - Households using pesticides to kill weeds (%)
Physical Activity - People doing vigorous-intensity work activities (%)
Physical Activity - People doing moderate-intensity work activities (%)
Physical Activity - People walking or bicycling (%)
Physical Activity - People doing vigorous-intensity recreational activities (%)
Physical Activity - People doing moderate-intensity recreational activities (%)
Physical Activity - Average hours a day doing sedentary activities
Physical Activity - Average hours a day watching TV or videos
Physical Activity - Average hours a day using computer
Physical Functioning - People having limitations keeping them from working (%)
Physical Functioning - People limited in amount of work they can do (%)
Physical Functioning - People that need special equipment to walk (%)
Physical Functioning - People experiencing confusion/memory problems (%)
Physical Functioning - People requiring special healthcare equipment (%)
Prescription Medications - Average number of prescription medicines taking
Preventive Aspirin Use - Adults 40+ taking low-dose aspirin (%)
Reproductive Health - Vaginal deliveries (%)
Reproductive Health - Cesarean deliveries (%)
Reproductive Health - Deliveries resulted in a live birth (%)
Reproductive Health - Pregnancies resulted in a delivery (%)
Reproductive Health - Women breastfeeding newborns (%)
Reproductive Health - Women that had a hysterectomy (%)
Reproductive Health - Women that had both ovaries removed (%)
Reproductive Health - Women that have ever taken birth control pills (%)
Reproductive Health - Women taking birth control pills (%)
Reproductive Health - Women that have ever used Depo-Provera or injectables (%)
Reproductive Health - Women that have ever used female hormones (%)
Sexual Behavior - People 18+ that ever had sex (vaginal, anal, or oral) (%)
Sexual Behavior - Males 18+ that ever had vaginal sex with a woman (%)
Sexual Behavior - Males 18+ that ever performed oral sex on a woman (%)
Sexual Behavior - Males 18+ that ever had anal sex with a woman (%)
Sexual Behavior - Males 18+ that ever had any sex with a man (%)
Sexual Behavior - Females 18+ that ever had vaginal sex with a man (%)
Sexual Behavior - Females 18+ that ever performed oral sex on a man (%)
Sexual Behavior - Females 18+ that ever had anal sex with a man (%)
Sexual Behavior - Females 18+ that ever had any kind of sex with a woman (%)
Sexual Behavior - Average age people first had sex
Sexual Behavior - Average number of female sex partners in lifetime (males 18+)
Sexual Behavior - Average number of female vaginal sex partners in lifetime (males 18+)
Sexual Behavior - Average age people first performed oral sex on a woman (18+)
Sexual Behavior - Average number of woman performed oral sex on in lifetime (18+)
Sexual Behavior - Average number of male sex partners in lifetime (males 18+)
Sexual Behavior - Average number of male anal sex partners in lifetime (males 18+)
Sexual Behavior - Average age people first performed oral sex on a man (18+)
Sexual Behavior - Average number of male oral sex partners in lifetime (18+)
Sexual Behavior - People using protection when performing oral sex (%)
Sexual Behavior - Average number of times people have vaginal or anal sex a year
Sexual Behavior - People having sex without condom (%)
Sexual Behavior - Average number of male sex partners in lifetime (females 18+)
Sexual Behavior - Average number of male vaginal sex partners in lifetime (females 18+)
Sexual Behavior - Average number of female sex partners in lifetime (females 18+)
Sexual Behavior - Circumcised males 18+ (%)
Sleep Disorders - Average hours sleeping at night
Sleep Disorders - People that has trouble sleeping (%)
Smoking-Cigarette Use - People smoking cigarettes (%)
Taste & Smell - People 40+ having problems with smell (%)
Taste & Smell - People 40+ having problems with taste (%)
Taste & Smell - People 40+ that ever had wisdom teeth removed (%)
Taste & Smell - People 40+ that ever had tonsils teeth removed (%)
Taste & Smell - People 40+ that ever had a loss of consciousness because of a head injury (%)
Taste & Smell - People 40+ that ever had a broken nose or other serious injury to face or skull (%)
Taste & Smell - People 40+ that ever had two or more sinus infections (%)
Weight - Average height (inches)
Weight - Average weight (pounds)
Weight - Average BMI
Weight - People that are obese (%)
Weight - People that ever were obese (%)
Weight - People trying to lose weight (%)
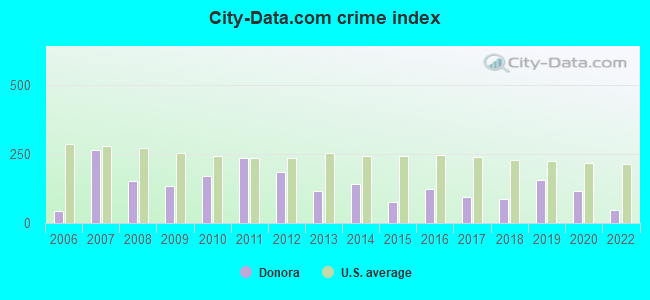
Officers per 1,000 residents here:
1.11Pennsylvania average:
2.55
Latest news from Donora, PA collected exclusively by city-data.com from local newspapers, TV, and radio stations
Ancestries: American (22.0%), English (8.9%), Italian (5.3%), German (5.0%), Eastern European (4.6%), Welsh (3.2%).
Current Local Time:
Incorporated on 02/11/1901
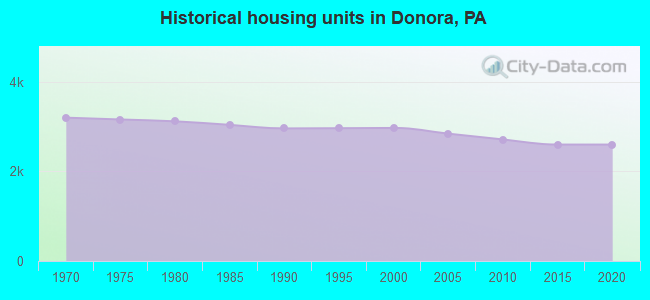
Land area: 1.90 square miles.
Population density: 2,376 people per square mile (low).
19 residents are foreign born
This borough:
0.4%Pennsylvania:
7.3%
Median real estate property taxes paid for housing units with mortgages in 2022: $887 (1.2%)Median real estate property taxes paid for housing units with no mortgage in 2022: $514 (1.3%)
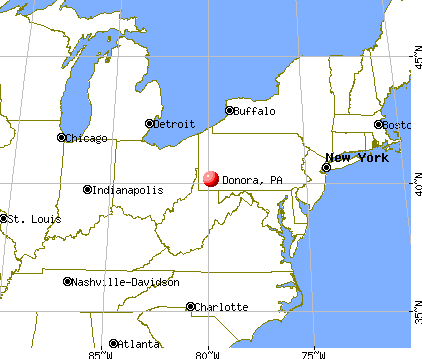
Nearest city with pop. 50,000+: Pittsburgh, PA
Nearest city with pop. 1,000,000+: Philadelphia, PA
Nearest cities:
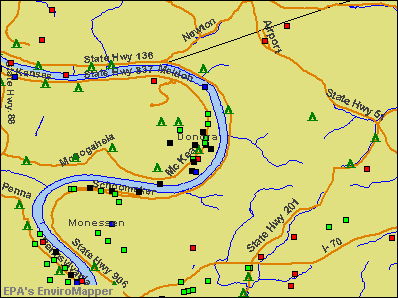
Latitude: 40.18 N, Longitude: 79.86 W
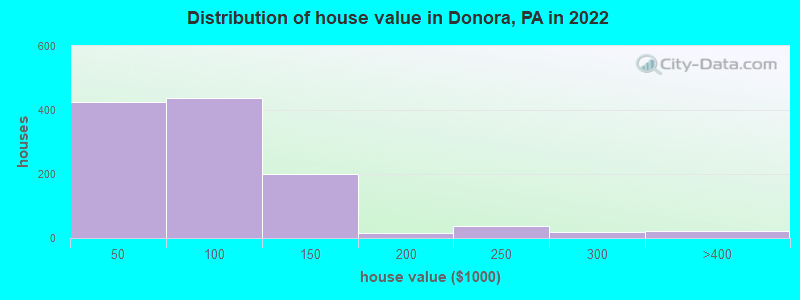
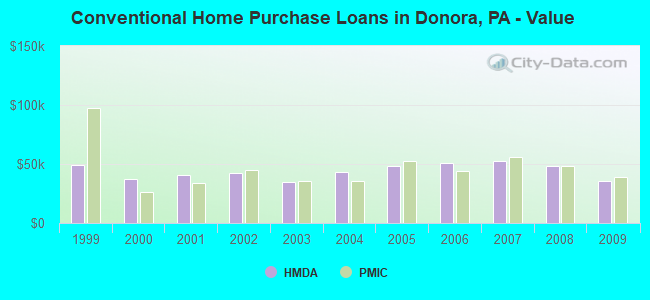
Property values in Donora, PA
Unemployment in December 2023: Here:
2.9%Pennsylvania:
2.9%
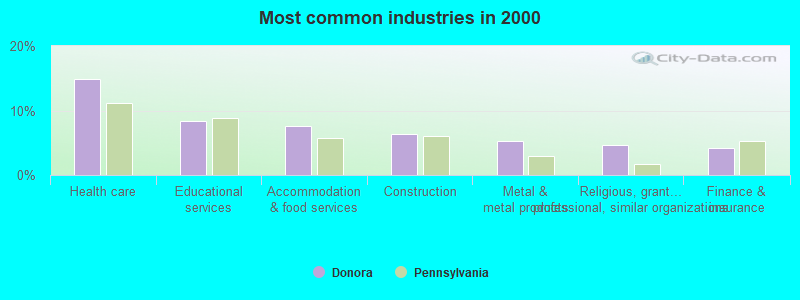
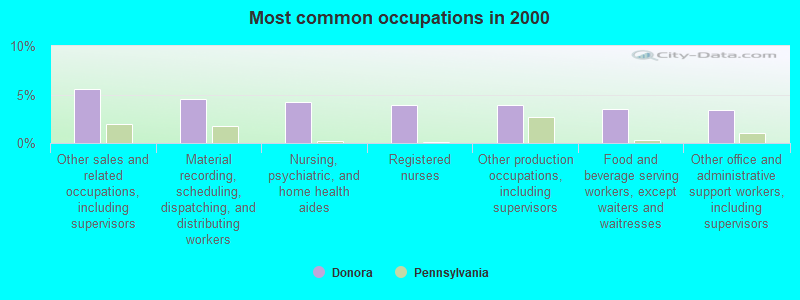
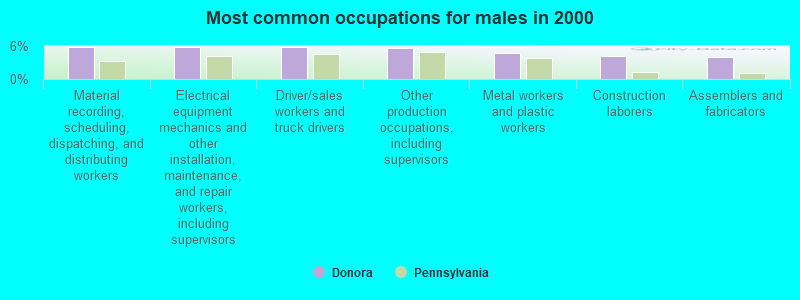
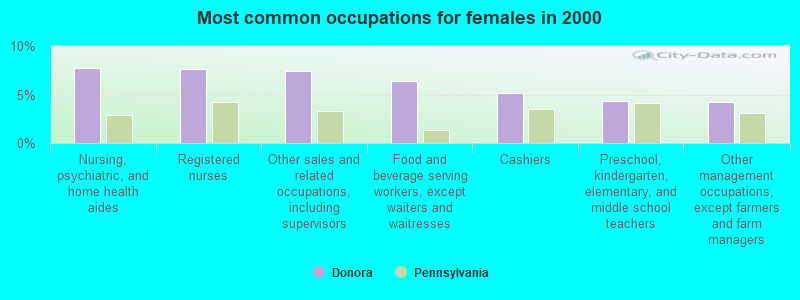
Most common industries in Donora, PA (%)
Both Males Females
Health care (14.9%)
Educational services (8.4%)
Accommodation & food services (7.7%)
Construction (6.3%)
Metal & metal products (5.2%)
Religious, grantmaking, civic, professional, similar organizations (4.6%)
Finance & insurance (4.1%)
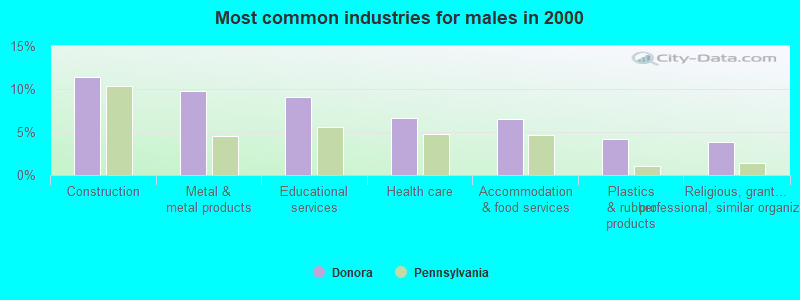
Construction (11.4%)
Metal & metal products (9.8%)
Educational services (9.1%)
Health care (6.6%)
Accommodation & food services (6.5%)
Plastics & rubber products (4.2%)
Religious, grantmaking, civic, professional, similar organizations (3.8%)
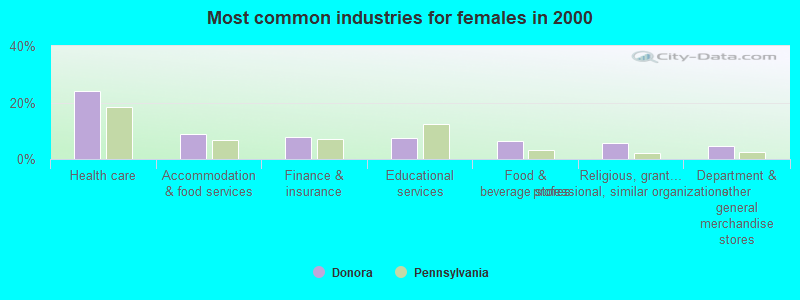
Health care (24.0%)
Accommodation & food services (8.9%)
Finance & insurance (7.8%)
Educational services (7.6%)
Food & beverage stores (6.4%)
Religious, grantmaking, civic, professional, similar organizations (5.6%)
Department & other general merchandise stores (4.5%)
Most common occupations in Donora, PA (%)
Both Males Females
Other sales and related occupations, including supervisors (5.6%)
Material recording, scheduling, dispatching, and distributing workers (4.5%)
Nursing, psychiatric, and home health aides (4.2%)
Registered nurses (4.0%)
Other production occupations, including supervisors (3.9%)
Food and beverage serving workers, except waiters and waitresses (3.5%)
Other office and administrative support workers, including supervisors (3.4%)
Material recording, scheduling, dispatching, and distributing workers (5.9%)
Electrical equipment mechanics and other installation, maintenance, and repair workers, including supervisors (5.9%)
Driver/sales workers and truck drivers (5.8%)
Other production occupations, including supervisors (5.7%)
Metal workers and plastic workers (4.8%)
Construction laborers (4.2%)
Assemblers and fabricators (4.0%)
Nursing, psychiatric, and home health aides (7.7%)
Registered nurses (7.6%)
Other sales and related occupations, including supervisors (7.4%)
Food and beverage serving workers, except waiters and waitresses (6.4%)
Cashiers (5.2%)
Preschool, kindergarten, elementary, and middle school teachers (4.3%)
Other management occupations, except farmers and farm managers (4.2%)
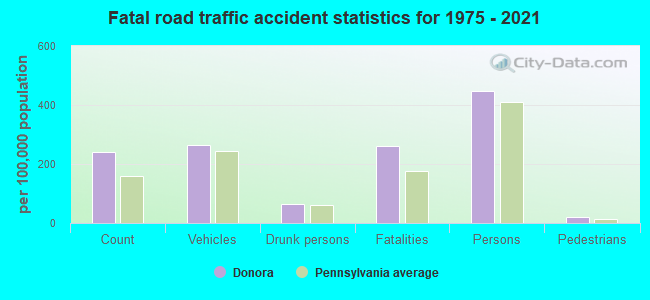
Tornado activity:
Donora-area historical tornado activity is slightly below Pennsylvania state average. It is 31% smaller than the overall U.S. average.
On 8/3/1963, a category F3 (max. wind speeds 158-206 mph) tornado 10.0 miles away from the Donora borough center killed 2 people and injured 70 people and caused between $5,000,000 and $50,000,000 in damages.
On 6/3/1980, a category F4 (max. wind speeds 207-260 mph) tornado 33.5 miles away from the borough center injured 140 people and caused between $50,000,000 and $500,000,000 in damages.
Earthquake activity:
Donora-area historical earthquake activity is significantly above Pennsylvania state average. It is 55% smaller than the overall U.S. average. On 8/23/2011 at 17:51:04, a magnitude 5.8 (5.8 MW, Depth: 3.7 mi, Class: Moderate, Intensity: VI - VII) earthquake occurred 187.8 miles away from Donora center On 9/25/1998 at 19:52:52, a magnitude 5.2 (4.8 MB, 4.3 MS, 5.2 LG, 4.5 MW, Depth: 3.1 mi) earthquake occurred 95.2 miles away from the city center On 1/31/1986 at 16:46:43, a magnitude 5.0 (5.0 MB) earthquake occurred 119.8 miles away from Donora center On 7/27/1980 at 18:52:21, a magnitude 5.2 (5.1 MB, 4.7 MS, 5.0 UK, 5.2 UK) earthquake occurred 257.8 miles away from Donora center On 8/9/2020 at 12:07:37, a magnitude 5.1 (5.1 MW, Depth: 4.7 mi) earthquake occurred 264.5 miles away from Donora center On 12/31/2011 at 20:05:01, a magnitude 4.0 (4.0 ML, Depth: 3.1 mi, Class: Light, Intensity: IV - V) earthquake occurred 78.4 miles away from the city center Magnitude types: regional Lg-wave magnitude (LG), body-wave magnitude (MB), local magnitude (ML), surface-wave magnitude (MS), moment magnitude (MW) Natural disasters: The number of natural disasters in Washington County (13) is near the US average (15).Major Disasters (Presidential) Declared: 8Emergencies Declared: 5Floods: 3, Storms: 3, Hurricanes: 2, Snowstorms: 2, Tropical Depressions: 2, Winter Storms: 2, Blizzard: 1, Snowfall: 1, Tropical Storm: 1, Other: 1 (Note: some incidents may be assigned to more than one category). Hospitals and medical centers in Donora: FRESENIUS MEDICAL CARE DONORA (470 GALIFFA DRIVE)
Other hospitals and medical centers near Donora: HAVENCREST NURSING CENTER (Nursing Home, about 3 miles away; MONONGAHELA, PA)
MONONGAHELA VALLEY HOSPITAL (about 3 miles away; MONONGAHELA, PA)
VALLEY COMMUNITY SERVICES (Hospital, about 4 miles away; BELLE VERNON, PA)
VIAQUEST HOME HEALTH LLC (Home Health Center, about 4 miles away; MONONGAHELA, PA)
DAVITA - ELIZABETH DIALYSIS (Dialysis Facility, about 7 miles away; ELIZABETH, PA)
WASHINGTON GREENE ALTERNATIVE (Hospital, about 10 miles away; ELLSWORTH, PA)
SUPERIOR HOME HEALTH AND STAFFING, INC (Home Health Center, about 11 miles away; MC KEESPORT, PA)
Amtrak stations near Donora: 18 miles: CONNELLSVILLE (FRONT & WATER STS.) Services: enclosed waiting area, public payphones, free short-term parking, call for taxi service, public transit connection.
19 miles: GREENSBURG (HARRISON AVE.) Services: enclosed waiting area, public payphones, free short-term parking, free long-term parking, call for taxi service.
20 miles: PITTSBURGH (1100 LIBERTY AVE.) Services: ticket office, fully wheelchair accessible, enclosed waiting area, public restrooms, public payphones, vending machines, ATM, free short-term parking, paid long-term parking, call for car rental service, call for taxi service, intercity bus service, public transit connection.
Colleges/universities with over 2000 students nearest to Donora:
California University of Pennsylvania (about 8 miles; California, PA ; Full-time enrollment: 7,773)
Westmoreland County Community College (about 17 miles; Youngwood, PA ; FT enrollment: 4,669)
Seton Hill University (about 19 miles; Greensburg, PA ; FT enrollment: 2,167)
Carnegie Mellon University (about 20 miles; Pittsburgh, PA ; FT enrollment: 14,186)
University of Pittsburgh-Pittsburgh Campus (about 20 miles; Pittsburgh, PA ; FT enrollment: 27,137)
Duquesne University (about 20 miles; Pittsburgh, PA ; FT enrollment: 8,211)
Point Park University (about 20 miles; Pittsburgh, PA ; FT enrollment: 3,525)
Library in Donora: DONORA PUBLIC LIBRARY Operating income: $120,960; Location: 510 MELDON AVE; 26,263 books ; 654 audio materials ; 1,265 video materials ; 5 local licensed databases ; 41 state licensed databases ; 65 print serial subscriptions )
User-submitted facts and corrections:
I BELIEVE KEN (GEORGE)GRIFFEY SHOULD BE ADDED TO THE LIST WITH STAN MUSIAL AND GRIFFEY JR. A GREAT BALL PLAYER ALSO AND WITH OUT THE DAD THERE WOULD BE NO SON.
Notable locations in Donora: (A) , Donora Police Department (B) , Donora Public Library (C) , Borough of Donora Recreation Department (D) , Donora Fire Company Station 66 (E) . Display/hide their locations on the map
Churches in Donora include: (A) , Saint Johns Episcopal Church (B) , Our Lady of the Valley Catholic Church (C) , New Testament Holiness Church (D) , First Baptist Church of Donora (E) , Christian Life Ministries (F) , Calvary United Presbyterian Church (G) , First Pilgrim Church (H) , Saint Pauls Church (I) . Display/hide their locations on the map
Cemeteries: (1) , Gilmore Cemetery (2) , Saint Domanick Cemetery (3) . Display/hide their locations on the map
Park in Donora: (1) . Display/hide its location on the map
Birthplace of: Jo Estill - Singer, Stan Musial - (born 1920), baseball player, Ken Griffey Jr. - 2005 Major League Baseball player (Cincinnati Reds, born : Nov 21, 1969), Bill Johnston (golfer) - Professional golfer, Lee Sala - Boxer, Arnold Galiffa - And football player, Rudy Andabaker - Football player, Steve Filipowicz - Basketball coache.
Washington County has a predicted average indoor radon screening level between 2 and 4 pCi/L (pico curies per liter) - Moderate Potential Average household size: This borough:
2.2 peoplePennsylvania:
2.5 people
Percentage of family households: This borough:
57.6%Whole state:
65.0%
Percentage of households with unmarried partners: This borough:
6.4%Whole state:
6.6%
Likely homosexual households (counted as self-reported same-sex unmarried-partner households)
Lesbian couples: 0.4% of all households Gay men: 0.1% of all households
66 people in nursing facilities/skilled-nursing facilities in 2010people in group homes intended for adults in 2010People in group quarters in Donora in 2000:
62 people in nursing homes
34 people in other noninstitutional group quarters
24 people in homes for the mentally ill
23 people in homes for the mentally retarded
5 people in religious group quarters
Banks with branches in Donora (2011 data):
PNC Bank, National Association: Donora Branch at 601 Mckean Avenue, branch established on 1964/02/14. Info updated 2012/03/20: Bank assets: $263,309.6 mil, Deposits: $197,343.0 mil, headquarters in Wilmington, DE, positive income , Commercial Lending Specialization, 3085 total offices , Holding Company: Pnc Financial Services Group, Inc., The
Citizens Bank of Pennsylvania: Donora Branch at 501 Mckean Avenue, branch established on 1948/09/13. Info updated 2010/09/24: Bank assets: $32,316.9 mil, Deposits: $25,297.1 mil, headquarters in Philadelphia, PA, positive income , 396 total offices , Holding Company: Uk Financial Investments Limited
First Federal Savings Bank: Donora at Meldon And Sixth Street, branch established on 1922/01/01. Info updated 2011/07/21: Bank assets: $335.1 mil, Deposits: $232.4 mil, headquarters in Monessen, PA, positive income , Mortgage Lending Specialization, 8 total offices
For population 15 years and over in Donora:
Never married: 41.2%Now married: 35.6%Separated: 2.5%Widowed: 9.1%Divorced: 11.6% For population 25 years and over in Donora:
High school or higher: 90.9%Bachelor's degree or higher: 12.4%Graduate or professional degree: 2.4%Unemployed: 9.5%Mean travel time to work (commute): 22.8 minutes
Education Gini index (Inequality in education) Here:
8.2Pennsylvania average:
11.4
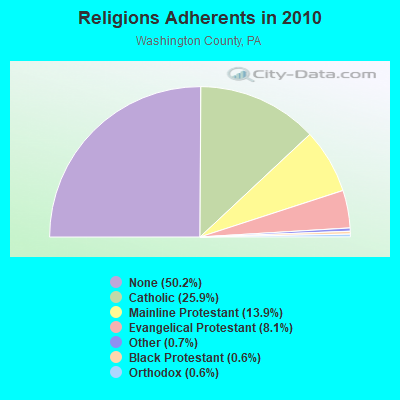
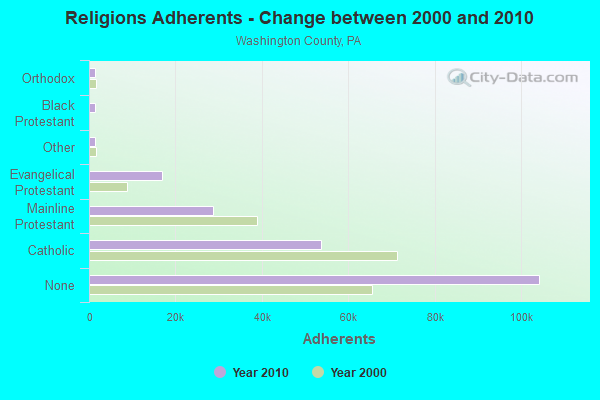
Religion statistics for Donora, PA (based on Washington County data)
Religion Adherents Congregations Catholic 53,777 28 Mainline Protestant 28,797 129 Evangelical Protestant 16,871 97 Other 1,459 8 Black Protestant 1,340 11 Orthodox 1,275 7 None 104,301 -
Source: Clifford Grammich, Kirk Hadaway, Richard Houseal, Dale E.Jones, Alexei Krindatch, Richie Stanley and Richard H.Taylor. 2012. 2010 U.S.Religion Census: Religious Congregations & Membership Study. Association of Statisticians of American Religious Bodies. Jones, Dale E., et al. 2002. Congregations and Membership in the United States 2000. Nashville, TN: Glenmary Research Center. Graphs represent county-level data
Food Environment Statistics: Number of grocery stores : 34This county :
1.66 / 10,000 pop.Pennsylvania :
2.04 / 10,000 pop.
Number of supercenters and club stores : 2This county :
0.10 / 10,000 pop.Pennsylvania :
0.09 / 10,000 pop.
Number of convenience stores (no gas) : 16Washington County :
0.78 / 10,000 pop.Pennsylvania :
0.88 / 10,000 pop.
Number of convenience stores (with gas) : 58Here :
2.82 / 10,000 pop.State :
2.52 / 10,000 pop.
Number of full-service restaurants : 119This county :
5.79 / 10,000 pop.State :
7.12 / 10,000 pop.
Adult diabetes rate : Washington County :
10.1%Pennsylvania :
9.1%
Adult obesity rate : Washington County :
30.9%Pennsylvania :
27.2%
Low-income preschool obesity rate : Here :
12.3%Pennsylvania :
11.5%
Health and Nutrition: Healthy diet rate : Donora:
50.9%Pennsylvania:
50.2%
Average overall health of teeth and gums : Here:
47.2%Pennsylvania:
47.1%
Average BMI : Here:
29.2Pennsylvania:
28.7
People feeling badly about themselves : Donora:
19.5%Pennsylvania:
20.8%
People not drinking alcohol at all : Donora:
13.1%Pennsylvania:
10.9%
Average hours sleeping at night : This city:
6.8Pennsylvania:
6.8
Overweight people : Here:
36.0%Pennsylvania:
34.3%
General health condition : Donora:
55.6%Pennsylvania:
56.2%
Average condition of hearing : Donora:
76.7%Pennsylvania:
78.3%
More about Health and Nutrition of Donora, PA Residents
Local government employment and payroll (March 2022)
Function
Full-time employees
Monthly full-time payroll
Average yearly full-time wage
Part-time employees
Monthly part-time payroll
Police Protection - Officers
6 $35,444 $70,888 5 $2,892 Streets and Highways
4 $19,640 $58,920 3 $3,888 Other Government Administration
2 $7,847 $47,082 9 $9,852 Financial Administration
1 $3,968 $47,616 0 $0 Other and Unallocable
0 $0 1 $600 Firefighters
0 $0 1 $166
Totals for Government
13 $66,898 $61,752 19 $17,398
Donora government finances - Expenditure in 2017 (per resident):
Current Operations - Regular Highways: $579,000 ($128.18)
General - Other: $561,000 ($124.20)Police Protection: $500,000 ($110.69)Solid Waste Management: $316,000 ($69.96)General Public Buildings: $146,000 ($32.32)Central Staff Services: $121,000 ($26.79)Local Fire Protection: $47,000 ($10.41)Financial Administration: $37,000 ($8.19)Parks and Recreation: $31,000 ($6.86)Protective Inspection and Regulation - Other: $29,000 ($6.42)Judicial and Legal Services: $17,000 ($3.76)Transit Utilities: $5,000 ($1.11)Libraries: $4,000 ($0.89)Parking Facilities: $2,000 ($0.44)General - Interest on Debt: $0 ($0.00)
Other Capital Outlay - Central Staff Services: $19,000 ($4.21)
Total Salaries and Wages: $891,000 ($197.25)
Donora government finances - Revenue in 2017 (per resident):
Charges - Solid Waste Management: $426,000 ($94.31)
Sewerage: $156,000 ($34.54)Other: $137,000 ($30.33)Regular Highways: $95,000 ($21.03)Parking Facilities: $1,000 ($0.22)Local Intergovernmental - General Local Government Support: $1,000 ($0.22)
Miscellaneous - Sale of Property: $46,000 ($10.18)
Fines and Forfeits: $36,000 ($7.97)General Revenue - Other: $21,000 ($4.65)Rents: $19,000 ($4.21)Special Assessments: $3,000 ($0.66)Interest Earnings: $2,000 ($0.44)State Intergovernmental - Other: $191,000 ($42.28)
Highways: $169,000 ($37.41)General Local Government Support: $3,000 ($0.66)Tax - Property: $543,000 ($120.21)
Individual Income: $328,000 ($72.61)Occupation and Business License - Other: $94,000 ($20.81)Public Utility License: $79,000 ($17.49)Documentary and Stock Transfer: $43,000 ($9.52)
Donora government finances - Debt in 2017 (per resident):
Long Term Debt - Issue, Unspecified Public Purpose: $8,000 ($1.77)
Outstanding Unspecified Public Purpose: $8,000 ($1.77)Retired Unspecified Public Purpose: $8,000 ($1.77)Beginning Outstanding - Unspecified Public Purpose: $8,000 ($1.77)
Donora government finances - Cash and Securities in 2017 (per resident):
Bond Funds - Cash and Securities: $110,000 ($24.35)
Other Funds - Cash and Securities: $472,000 ($104.49)
Strongest AM radio stations in Donora:
KDKA (1020 AM; 50 kW; PITTSBURGH, PA; Owner: INFINITY BROADCASTING OPERATIONS, INC.)
WKHB (620 AM; 6 kW; IRWIN, PA; Owner: BROADCAST COMMUNICATIONS, INC.)
WASP (1130 AM; daytime; 5 kW; BROWNSVILLE, PA; Owner: KEYMARKET LICENSES, LLC)
WWCS (540 AM; 5 kW; CANONSBURG, PA; Owner: BIRACH BROADCASTING CORPORATION)
WFGI (940 AM; 0 kW; CHARLEROI, PA; Owner: KEYMARKET LICENSES, LLC)
WJAS (1320 AM; 6 kW; PITTSBURGH, PA; Owner: RENDA BROADCASTING CORP. OF NEVADA)
WWVA (1170 AM; 53 kW; WHEELING, WV; Owner: CAPSTAR TX LIMITED PARTNERSHIP)
WEAE (1250 AM; 5 kW; PITTSBURGH, PA; Owner: ABC, INC.)
WPTT (1360 AM; 5 kW; MCKEESPORT, PA; Owner: RENDA BROADCASTING CORPORATION OF NEVADA)
WPIT (730 AM; 5 kW; PITTSBURGH, PA; Owner: PENNSYLVANIA MEDIA ASSOCIATES, INC.)
WBGG (970 AM; 5 kW; PITTSBURGH, PA; Owner: AMFM RADIO LICENSES, L.L.C.)
WPGR (1510 AM; 5 kW; MONROEVILLE, PA; Owner: MCL/ MCM- INC.)
WEDO (810 AM; daytime; 1 kW; MCKEESPORT, PA; Owner: 810 INCORPORATED)
Strongest FM radio stations in Donora:
WOGG (94.9 FM; OLIVER, PA; Owner: KEYMARKET LICENSES, LLC)
WSHH (99.7 FM; PITTSBURGH, PA; Owner: RENDA B/CING CORP. OF NEVADA)
WWSW-FM (94.5 FM; PITTSBURGH, PA; Owner: AMFM RADIO LICENSES, L.L.C.)
WDSY-FM (107.9 FM; PITTSBURGH, PA; Owner: INFINITY RADIO SUBSIDIARY OPERATIONS INC.)
WSSZ (107.1 FM; GREENSBURG, PA; Owner: MCL/MCM-INC.)
WVPM (90.9 FM; MORGANTOWN, WV; Owner: WEST VIRGINIA EDUCATIONAL BROADCASTING AUTHORITY)
WLTJ (92.9 FM; PITTSBURGH, PA; Owner: WPNT, INC.)
WLSW (103.9 FM; SCOTTDALE, PA; Owner: L. STANLEY WALL)
WKST-FM (96.1 FM; PITTSBURGH, PA; Owner: CAPSTAR TX LIMITED PARTNERSHIP)
WQED-FM (89.3 FM; PITTSBURGH, PA; Owner: WQED MULTIMEDIA)
WRRK (96.9 FM; BRADDOCK, PA; Owner: WPNT INC)
WJJJ (104.7 FM; PITTSBURGH, PA; Owner: CAPSTAR TX LIMITED PARTNERSHIP)
WDVE (102.5 FM; PITTSBURGH, PA; Owner: CAPSTAR TX LIMITED PARTNERSHIP)
WZPT (100.7 FM; NEW KENSINGTON, PA; Owner: INFINITY RADIO SUBSIDIARY OPERATIONS INC.)
WBZZ (93.7 FM; PITTSBURGH, PA; Owner: INFINITY RADIO SUBSIDIARY OPERATIONS INC.)
WDUQ (90.5 FM; PITTSBURGH, PA; Owner: DUQUESNE UNIVERSITY)
WPTS-FM (92.1 FM; PITTSBURGH, PA; Owner: UNIV. OF PITTSBURGH COMMONWEALTH SYS)
WYEP-FM (91.3 FM; PITTSBURGH, PA; Owner: PITTSBURGH COMM. B/CING. CORP.)
WVCS (91.9 FM; CALIFORNIA, PA; Owner: FOREVER OF SOMERSET, INC.)
WORD-FM (101.5 FM; PITTSBURGH, PA; Owner: PENNSYLVANIA MEDIA ASSOCIATES, INC.)
TV broadcast stations around Donora:
WTAE-TV (Channel 4; PITTSBURGH, PA; Owner: WTAE HEARST-ARGYLE TV, INC. (CA CORP.))
W26AV (Channel 26; CHARLEROI, PA; Owner: DEBRA GOODWORTH)
WPCB-TV (Channel 40; GREENSBURG, PA; Owner: CORNERSTONE TELEVISION, INC.)
W65CG (Channel 65; PITTSBURGH, PA; Owner: TRINITY BROADCASTING NETWORK)
WPXI (Channel 11; PITTSBURGH, PA; Owner: WPXI-TV HOLDINGS, INC.)
WBGN-LP (Channel 59; PITTSBURGH, PA; Owner: BRUNO GOODWORTH NETWORK, INC.)
WPTG-LP (Channel 69; PITTSBURGH, PA; Owner: ABACUS TELEVISION)
WQEX (Channel 16; PITTSBURGH, PA; Owner: WQED MULTIMEDIA)
WCWB (Channel 22; PITTSBURGH, PA; Owner: WCWB LICENSEE, LLC)
KDKA-TV (Channel 2; PITTSBURGH, PA; Owner: CBS BROADCASTING INC.)
WTOV-TV (Channel 9; STEUBENVILLE, OH; Owner: WTOV-TV HOLDINGS, INC.)
WQED (Channel 13; PITTSBURGH, PA; Owner: WQED MULTIMEDIA)
WPGH-TV (Channel 53; PITTSBURGH, PA; Owner: WPGH LICENSEE, LLC)
W61CC (Channel 61; PITTSBURGH, PA; Owner: THE VIDEOHOUSE, INC.)
WIIC-LP (Channel 29; PITTSBURGH, PA; Owner: ABACUS TELEVISION)
WBPA-LP (Channel 29; PITTSBURGH, PA; Owner: VENTURE TECHNOLOGIES GROUP, LLC)
W63AU (Channel 63; PITTSBURGH, PA; Owner: THE BON-TELE NETWORK, INC.)
WBYD-CA (Channel 35; JOHNSTOWN, PA; Owner: BENJAMIN PEREZ)
WQVC-CA (Channel 28; GREENSBURG, PA; Owner: ABACUS TELEVISION)
W20AN (Channel 20; WASHINGTON, PA; Owner: TURNPIKE TELEVISION)
W56CG (Channel 56; GREENSBURG, PA; Owner: TURNPIKE TELEVISION)
WWAT-CA (Channel 45; UNIONTOWN, PA; Owner: ABACUS TELEVISION)
National Bridge Inventory (NBI) Statistics 8 Number of bridges249ft / 76.5m Total length $21,822,000 Total costs29,306 Total average daily traffic2,955 Total average daily truck traffic
FCC Registered Antenna Towers: 21 (
See the full list of FCC Registered Antenna Towers in Donora )
FCC Registered Broadcast Land Mobile Towers: 1
Lat: 40.188694 Lon: -79.856167, Call Sign: WQWE225, Assigned Frequencies: 462.337 MHz, 462.412 MHz, 463.387 MHz, 467.337 MHz, Grant Date: 07/29/2015, Expiration Date: 07/29/2025, Certifier: Dean Bachman, Registrant: Keller And Heckman LLP, 1001 G Street, Nw, Suite 500 West, Washington, DC 20001-4545, Phone: (202) 434-4100, Fax: (202) 434-4646, Email:
FCC Registered Microwave Towers: 1
5th Ave Cemetary Rd (Lat: 40.180333 Lon: -79.875861), Overall height: 45.7 m, Call Sign: WPNL772, Assigned Frequencies: 953.950 MHz, Grant Date: 03/09/2018, Expiration Date: 05/28/2028, Registrant: Washington County Department Of Public Safety, 100 West Beau Street, Suite C-1, Washington, PA 15301, Phone: (724) 228-6911, Email:
FCC Registered Paging Towers: 1
Carroll Township, Cemetery Road, 1 Mile Wnw Of (Lat: 40.180056 Lon: -79.875861), Call Sign: KGI265, Assigned Frequencies: 152.540 MHz, Grant Date: 06/05/2018, Expiration Date: 07/01/2028, Registrant: Gurman Blask & Freedman, 210 West Market Street, Pottsville, PA 17901, Phone: (570) 628-5559, Fax: (570) 622-6666, Email:
FCC Registered Amateur Radio Licenses: 15 (
See the full list of FCC Registered Amateur Radio Licenses in Donora )
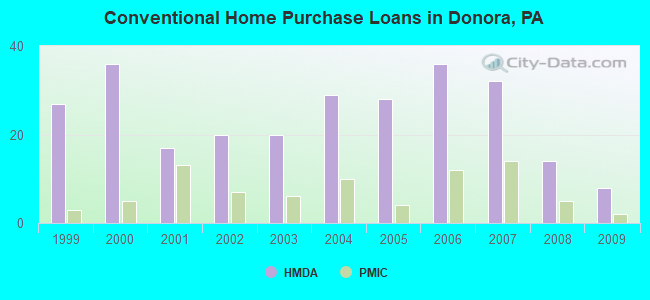
Home Mortgage Disclosure Act Aggregated Statistics For Year 2009(Based on 2 full tracts) A) FHA, FSA/RHS & VA B) Conventional C) Refinancings D) Home Improvement Loans E) Loans on Dwellings For 5+ Families F) Non-occupant Loans on Number Average Value Number Average Value Number Average Value Number Average Value Number Average Value Number Average Value
LOANS ORIGINATED 11 $65,455 8 $35,500 15 $73,800 13 $12,692 0 $0 2 $31,500 APPLICATIONS APPROVED, NOT ACCEPTED 0 $0 1 $35,000 3 $59,667 1 $18,000 0 $0 0 $0 APPLICATIONS DENIED 0 $0 0 $0 26 $69,538 8 $14,250 1 $57,000 2 $32,500 APPLICATIONS WITHDRAWN 1 $64,000 0 $0 8 $63,375 0 $0 0 $0 2 $27,000 FILES CLOSED FOR INCOMPLETENESS 0 $0 0 $0 0 $0 0 $0 0 $0 0 $0
Aggregated Statistics For Year 2008(Based on 2 full tracts) A) FHA, FSA/RHS & VA B) Conventional C) Refinancings D) Home Improvement Loans E) Loans on Dwellings For 5+ Families F) Non-occupant Loans on Number Average Value Number Average Value Number Average Value Number Average Value Number Average Value Number Average Value
LOANS ORIGINATED 15 $59,067 14 $48,643 17 $55,765 19 $23,579 0 $0 5 $44,600 APPLICATIONS APPROVED, NOT ACCEPTED 1 $53,000 0 $0 3 $40,667 2 $6,500 0 $0 0 $0 APPLICATIONS DENIED 0 $0 6 $25,833 46 $67,348 22 $17,773 1 $120,000 5 $21,200 APPLICATIONS WITHDRAWN 1 $70,000 0 $0 11 $65,545 0 $0 0 $0 0 $0 FILES CLOSED FOR INCOMPLETENESS 1 $36,000 0 $0 6 $55,167 1 $15,000 0 $0 1 $48,000
Aggregated Statistics For Year 2007(Based on 2 full tracts) A) FHA, FSA/RHS & VA B) Conventional C) Refinancings D) Home Improvement Loans E) Loans on Dwellings For 5+ Families F) Non-occupant Loans on Number Average Value Number Average Value Number Average Value Number Average Value Number Average Value Number Average Value
LOANS ORIGINATED 5 $52,000 32 $52,219 36 $63,139 37 $19,270 0 $0 8 $28,875 APPLICATIONS APPROVED, NOT ACCEPTED 0 $0 3 $46,333 14 $49,786 3 $14,000 0 $0 2 $51,500 APPLICATIONS DENIED 1 $55,000 11 $40,818 70 $76,000 40 $23,000 1 $152,000 3 $27,667 APPLICATIONS WITHDRAWN 0 $0 2 $58,000 19 $56,211 2 $43,500 0 $0 1 $76,000 FILES CLOSED FOR INCOMPLETENESS 0 $0 2 $64,000 4 $62,750 0 $0 0 $0 1 $76,000
Aggregated Statistics For Year 2006(Based on 2 full tracts) A) FHA, FSA/RHS & VA B) Conventional C) Refinancings D) Home Improvement Loans F) Non-occupant Loans on G) Loans On Manufactured Number Average Value Number Average Value Number Average Value Number Average Value Number Average Value Number Average Value
LOANS ORIGINATED 6 $58,500 36 $50,500 60 $47,350 41 $13,488 21 $30,000 0 $0 APPLICATIONS APPROVED, NOT ACCEPTED 3 $49,667 4 $56,500 13 $58,615 4 $13,250 3 $33,000 0 $0 APPLICATIONS DENIED 1 $27,000 10 $50,700 83 $56,446 44 $21,864 11 $35,727 1 $23,000 APPLICATIONS WITHDRAWN 0 $0 7 $36,143 41 $56,488 4 $31,000 4 $46,750 0 $0 FILES CLOSED FOR INCOMPLETENESS 0 $0 0 $0 6 $57,500 0 $0 0 $0 0 $0
Aggregated Statistics For Year 2005(Based on 2 full tracts) A) FHA, FSA/RHS & VA B) Conventional C) Refinancings D) Home Improvement Loans E) Loans on Dwellings For 5+ Families F) Non-occupant Loans on G) Loans On Manufactured Number Average Value Number Average Value Number Average Value Number Average Value Number Average Value Number Average Value Number Average Value
LOANS ORIGINATED 5 $39,000 28 $48,500 59 $53,915 39 $24,949 1 $120,000 21 $34,762 0 $0 APPLICATIONS APPROVED, NOT ACCEPTED 0 $0 3 $54,333 13 $55,154 8 $26,125 0 $0 2 $52,000 1 $60,000 APPLICATIONS DENIED 0 $0 21 $47,190 85 $53,329 44 $17,909 0 $0 17 $24,353 0 $0 APPLICATIONS WITHDRAWN 0 $0 5 $56,400 37 $56,973 8 $55,000 0 $0 1 $30,000 0 $0 FILES CLOSED FOR INCOMPLETENESS 0 $0 2 $43,500 4 $55,500 1 $45,000 0 $0 1 $45,000 0 $0
Aggregated Statistics For Year 2004(Based on 2 full tracts) A) FHA, FSA/RHS & VA B) Conventional C) Refinancings D) Home Improvement Loans F) Non-occupant Loans on G) Loans On Manufactured Number Average Value Number Average Value Number Average Value Number Average Value Number Average Value Number Average Value
LOANS ORIGINATED 4 $45,250 29 $42,931 95 $50,684 40 $13,125 20 $25,000 0 $0 APPLICATIONS APPROVED, NOT ACCEPTED 0 $0 2 $49,000 18 $49,944 15 $11,000 4 $22,000 1 $1,000 APPLICATIONS DENIED 1 $39,000 8 $39,250 123 $57,407 55 $14,473 26 $19,500 2 $98,500 APPLICATIONS WITHDRAWN 0 $0 4 $63,250 36 $51,417 2 $35,000 2 $50,000 0 $0 FILES CLOSED FOR INCOMPLETENESS 0 $0 0 $0 10 $79,500 0 $0 0 $0 0 $0
Aggregated Statistics For Year 2003(Based on 2 full tracts) A) FHA, FSA/RHS & VA B) Conventional C) Refinancings D) Home Improvement Loans E) Loans on Dwellings For 5+ Families F) Non-occupant Loans on Number Average Value Number Average Value Number Average Value Number Average Value Number Average Value Number Average Value
LOANS ORIGINATED 12 $43,417 20 $34,550 82 $54,915 44 $9,000 0 $0 16 $20,188 APPLICATIONS APPROVED, NOT ACCEPTED 1 $29,000 1 $40,000 28 $55,286 11 $29,000 0 $0 1 $1,000 APPLICATIONS DENIED 2 $52,500 6 $43,500 122 $53,877 67 $9,403 1 $375,000 29 $18,517 APPLICATIONS WITHDRAWN 0 $0 2 $33,000 46 $59,283 3 $31,333 0 $0 1 $58,000 FILES CLOSED FOR INCOMPLETENESS 0 $0 2 $53,000 7 $55,857 0 $0 0 $0 1 $86,000
Aggregated Statistics For Year 2002(Based on 2 full tracts) A) FHA, FSA/RHS & VA B) Conventional C) Refinancings D) Home Improvement Loans F) Non-occupant Loans on Number Average Value Number Average Value Number Average Value Number Average Value Number Average Value
LOANS ORIGINATED 8 $35,000 20 $42,650 80 $52,325 20 $22,650 8 $27,625 APPLICATIONS APPROVED, NOT ACCEPTED 2 $54,000 4 $76,750 26 $46,731 4 $10,250 1 $58,000 APPLICATIONS DENIED 1 $35,000 9 $46,667 99 $52,960 18 $20,222 7 $34,429 APPLICATIONS WITHDRAWN 1 $57,000 3 $39,000 26 $62,654 6 $16,333 0 $0 FILES CLOSED FOR INCOMPLETENESS 0 $0 0 $0 5 $55,400 0 $0 0 $0
Aggregated Statistics For Year 2001(Based on 2 full tracts) A) FHA, FSA/RHS & VA B) Conventional C) Refinancings D) Home Improvement Loans F) Non-occupant Loans on Number Average Value Number Average Value Number Average Value Number Average Value Number Average Value
LOANS ORIGINATED 9 $40,000 17 $41,059 58 $44,224 35 $17,600 6 $30,833 APPLICATIONS APPROVED, NOT ACCEPTED 1 $66,000 4 $55,750 40 $43,375 5 $9,200 2 $33,500 APPLICATIONS DENIED 0 $0 10 $52,400 104 $46,779 23 $10,609 1 $24,000 APPLICATIONS WITHDRAWN 1 $30,000 0 $0 39 $54,667 7 $23,571 0 $0 FILES CLOSED FOR INCOMPLETENESS 0 $0 0 $0 4 $66,750 0 $0 1 $35,000
Aggregated Statistics For Year 2000(Based on 2 full tracts) A) FHA, FSA/RHS & VA B) Conventional C) Refinancings D) Home Improvement Loans F) Non-occupant Loans on Number Average Value Number Average Value Number Average Value Number Average Value Number Average Value
LOANS ORIGINATED 6 $42,833 36 $37,250 55 $40,382 33 $13,030 5 $34,200 APPLICATIONS APPROVED, NOT ACCEPTED 0 $0 6 $62,167 17 $42,000 13 $20,385 0 $0 APPLICATIONS DENIED 0 $0 11 $37,000 93 $42,602 39 $13,667 4 $34,250 APPLICATIONS WITHDRAWN 0 $0 2 $27,000 29 $42,241 5 $13,000 0 $0 FILES CLOSED FOR INCOMPLETENESS 0 $0 2 $32,000 10 $45,200 0 $0 0 $0
Aggregated Statistics For Year 1999(Based on 3 full tracts) A) FHA, FSA/RHS & VA B) Conventional C) Refinancings D) Home Improvement Loans F) Non-occupant Loans on Number Average Value Number Average Value Number Average Value Number Average Value Number Average Value
LOANS ORIGINATED 12 $36,524 27 $48,965 68 $43,879 70 $15,242 7 $28,529 APPLICATIONS APPROVED, NOT ACCEPTED 0 $0 4 $31,905 27 $50,094 10 $13,635 0 $0 APPLICATIONS DENIED 0 $0 13 $36,557 84 $43,712 69 $11,199 3 $24,383 APPLICATIONS WITHDRAWN 1 $37,500 9 $39,661 51 $39,382 11 $13,255 3 $19,690 FILES CLOSED FOR INCOMPLETENESS 0 $0 3 $23,157 11 $44,250 0 $0 0 $0
Detailed HMDA statistics for the following Tracts:
7752.00
, 7753.00
Private Mortgage Insurance Companies Aggregated Statistics For Year 2009(Based on 2 full tracts) A) Conventional B) Refinancings C) Non-occupant Loans on Number Average Value Number Average Value Number Average Value
LOANS ORIGINATED 2 $39,000 1 $141,000 0 $0 APPLICATIONS APPROVED, NOT ACCEPTED 0 $0 0 $0 0 $0 APPLICATIONS DENIED 0 $0 0 $0 0 $0 APPLICATIONS WITHDRAWN 0 $0 0 $0 0 $0 FILES CLOSED FOR INCOMPLETENESS 1 $57,000 0 $0 1 $57,000
Aggregated Statistics For Year 2008(Based on 2 full tracts) A) Conventional B) Refinancings C) Non-occupant Loans on Number Average Value Number Average Value Number Average Value
LOANS ORIGINATED 5 $48,000 1 $53,000 2 $53,500 APPLICATIONS APPROVED, NOT ACCEPTED 0 $0 0 $0 0 $0 APPLICATIONS DENIED 0 $0 1 $53,000 1 $53,000 APPLICATIONS WITHDRAWN 0 $0 0 $0 0 $0 FILES CLOSED FOR INCOMPLETENESS 0 $0 0 $0 0 $0
Aggregated Statistics For Year 2007(Based on 2 full tracts) A) Conventional B) Refinancings C) Non-occupant Loans on Number Average Value Number Average Value Number Average Value
LOANS ORIGINATED 14 $56,000 3 $97,333 1 $32,000 APPLICATIONS APPROVED, NOT ACCEPTED 4 $32,250 1 $198,000 0 $0 APPLICATIONS DENIED 0 $0 0 $0 0 $0 APPLICATIONS WITHDRAWN 0 $0 0 $0 0 $0 FILES CLOSED FOR INCOMPLETENESS 0 $0 0 $0 0 $0
Aggregated Statistics For Year 2006(Based on 2 full tracts) A) Conventional B) Refinancings C) Non-occupant Loans on Number Average Value Number Average Value Number Average Value
LOANS ORIGINATED 12 $44,250 1 $43,000 1 $22,000 APPLICATIONS APPROVED, NOT ACCEPTED 1 $14,000 0 $0 1 $14,000 APPLICATIONS DENIED 0 $0 0 $0 0 $0 APPLICATIONS WITHDRAWN 1 $20,000 0 $0 1 $20,000 FILES CLOSED FOR INCOMPLETENESS 0 $0 0 $0 0 $0
Aggregated Statistics For Year 2005(Based on 2 full tracts) A) Conventional B) Refinancings C) Non-occupant Loans on Number Average Value Number Average Value Number Average Value
LOANS ORIGINATED 4 $52,250 2 $81,000 1 $77,000 APPLICATIONS APPROVED, NOT ACCEPTED 1 $38,000 0 $0 0 $0 APPLICATIONS DENIED 1 $26,000 0 $0 0 $0 APPLICATIONS WITHDRAWN 0 $0 0 $0 0 $0 FILES CLOSED FOR INCOMPLETENESS 0 $0 0 $0 0 $0
Aggregated Statistics For Year 2004(Based on 2 full tracts) A) Conventional B) Refinancings C) Non-occupant Loans on Number Average Value Number Average Value Number Average Value
LOANS ORIGINATED 10 $35,900 8 $55,375 4 $40,250 APPLICATIONS APPROVED, NOT ACCEPTED 1 $43,000 2 $44,500 1 $43,000 APPLICATIONS DENIED 1 $33,000 0 $0 1 $33,000 APPLICATIONS WITHDRAWN 1 $33,000 0 $0 1 $33,000 FILES CLOSED FOR INCOMPLETENESS 0 $0 0 $0 0 $0
Aggregated Statistics For Year 2003(Based on 2 full tracts) A) Conventional B) Refinancings Number Average Value Number Average Value
LOANS ORIGINATED 6 $35,333 4 $55,750 APPLICATIONS APPROVED, NOT ACCEPTED 1 $131,000 1 $50,000 APPLICATIONS DENIED 0 $0 0 $0 APPLICATIONS WITHDRAWN 1 $117,000 0 $0 FILES CLOSED FOR INCOMPLETENESS 0 $0 0 $0
Aggregated Statistics For Year 2002(Based on 2 full tracts) A) Conventional B) Refinancings C) Non-occupant Loans on Number Average Value Number Average Value Number Average Value
LOANS ORIGINATED 7 $44,857 2 $100,500 2 $27,000 APPLICATIONS APPROVED, NOT ACCEPTED 1 $43,000 0 $0 0 $0 APPLICATIONS DENIED 0 $0 0 $0 0 $0 APPLICATIONS WITHDRAWN 1 $60,000 0 $0 0 $0 FILES CLOSED FOR INCOMPLETENESS 0 $0 0 $0 0 $0
Aggregated Statistics For Year 2001(Based on 2 full tracts) A) Conventional B) Refinancings C) Non-occupant Loans on Number Average Value Number Average Value Number Average Value
LOANS ORIGINATED 13 $33,769 6 $71,333 0 $0 APPLICATIONS APPROVED, NOT ACCEPTED 1 $66,000 3 $77,000 1 $29,000 APPLICATIONS DENIED 0 $0 0 $0 0 $0 APPLICATIONS WITHDRAWN 0 $0 1 $30,000 0 $0 FILES CLOSED FOR INCOMPLETENESS 0 $0 0 $0 0 $0
Aggregated Statistics For Year 2000(Based on 2 full tracts) A) Conventional B) Refinancings C) Non-occupant Loans on Number Average Value Number Average Value Number Average Value
LOANS ORIGINATED 5 $26,600 3 $40,667 2 $26,500 APPLICATIONS APPROVED, NOT ACCEPTED 0 $0 1 $29,000 1 $29,000 APPLICATIONS DENIED 0 $0 0 $0 0 $0 APPLICATIONS WITHDRAWN 0 $0 0 $0 0 $0 FILES CLOSED FOR INCOMPLETENESS 0 $0 0 $0 0 $0
Aggregated Statistics For Year 1999(Based on 3 full tracts) A) Conventional B) Refinancings C) Non-occupant Loans on Number Average Value Number Average Value Number Average Value
LOANS ORIGINATED 3 $97,747 2 $46,765 1 $26,180 APPLICATIONS APPROVED, NOT ACCEPTED 1 $33,840 0 $0 0 $0 APPLICATIONS DENIED 0 $0 0 $0 0 $0 APPLICATIONS WITHDRAWN 0 $0 0 $0 0 $0 FILES CLOSED FOR INCOMPLETENESS 0 $0 0 $0 0 $0
Detailed PMIC statistics for the following Tracts:
7752.00
, 7753.00
Most common first names in Donora, PA among deceased individuals Name Count Lived (average)
John 220 75.4 years Mary 189 80.3 years Joseph 144 74.5 years Anna 96 82.6 years Helen 81 78.2 years George 81 73.2 years James 70 68.2 years William 68 72.5 years Margaret 61 79.4 years Charles 60 72.9 years
Most common last names in Donora, PA among deceased individuals Last name Count Lived (average)
Smith 30 77.4 years White 24 75.0 years Miller 21 75.9 years Johnson 16 73.7 years Fernandez 16 76.6 years Jones 14 71.9 years Alvarez 12 76.5 years Garcia 12 75.4 years Rodriguez 12 76.4 years Fronzaglio 12 77.9 years
Donora compared to Pennsylvania state average:
Median household income below state average. Median house value significantly below state average. Black race population percentage above state average. Hispanic race population percentage significantly below state average. Foreign-born population percentage significantly below state average. Number of college students below state average. Percentage of population with a bachelor's degree or higher below state average.


 Recent articles from our blog. Our writers, many of them Ph.D. graduates or candidates, create easy-to-read articles on a wide variety of topics.

 (19.4 miles