Canfield, Ohio Submit your own pictures of this city and show them to the world
OSM Map
General Map
Google Map
MSN Map
OSM Map
General Map
Google Map
MSN Map
OSM Map
General Map
Google Map
MSN Map
OSM Map
General Map
Google Map
MSN Map
Please wait while loading the map...
Population in 2022: 7,608 (100% urban, 0% rural). Population change since 2000: +3.2%Males: 3,592 Females: 4,016
March 2022 cost of living index in Canfield: 89.0 (less than average, U.S. average is 100) Percentage of residents living in poverty in 2022: 2.2%
Profiles of local businesses
Business Search - 14 Million verified businesses
Data:
Median household income ($)
Median household income (% change since 2000)
Household income diversity
Ratio of average income to average house value (%)
Ratio of average income to average rent
Median household income ($) - White
Median household income ($) - Black or African American
Median household income ($) - Asian
Median household income ($) - Hispanic or Latino
Median household income ($) - American Indian and Alaska Native
Median household income ($) - Multirace
Median household income ($) - Other Race
Median household income for houses/condos with a mortgage ($)
Median household income for apartments without a mortgage ($)
Races - White alone (%)
Races - White alone (% change since 2000)
Races - Black alone (%)
Races - Black alone (% change since 2000)
Races - American Indian alone (%)
Races - American Indian alone (% change since 2000)
Races - Asian alone (%)
Races - Asian alone (% change since 2000)
Races - Hispanic (%)
Races - Hispanic (% change since 2000)
Races - Native Hawaiian and Other Pacific Islander alone (%)
Races - Native Hawaiian and Other Pacific Islander alone (% change since 2000)
Races - Two or more races (%)
Races - Two or more races (% change since 2000)
Races - Other race alone (%)
Races - Other race alone (% change since 2000)
Racial diversity
Unemployment (%)
Unemployment (% change since 2000)
Unemployment (%) - White
Unemployment (%) - Black or African American
Unemployment (%) - Asian
Unemployment (%) - Hispanic or Latino
Unemployment (%) - American Indian and Alaska Native
Unemployment (%) - Multirace
Unemployment (%) - Other Race
Population density (people per square mile)
Population - Males (%)
Population - Females (%)
Population - Males (%) - White
Population - Males (%) - Black or African American
Population - Males (%) - Asian
Population - Males (%) - Hispanic or Latino
Population - Males (%) - American Indian and Alaska Native
Population - Males (%) - Multirace
Population - Males (%) - Other Race
Population - Females (%) - White
Population - Females (%) - Black or African American
Population - Females (%) - Asian
Population - Females (%) - Hispanic or Latino
Population - Females (%) - American Indian and Alaska Native
Population - Females (%) - Multirace
Population - Females (%) - Other Race
Coronavirus confirmed cases (Jun 10, 2024)
Deaths caused by coronavirus (Jun 10, 2024)
Coronavirus confirmed cases (per 100k population) (Jun 10, 2024)
Deaths caused by coronavirus (per 100k population) (Jun 10, 2024)
Daily increase in number of cases (Jun 10, 2024)
Weekly increase in number of cases (Jun 10, 2024)
Cases doubled (in days) (Jun 10, 2024)
Hospitalized patients (Apr 18, 2022)
Negative test results (Apr 18, 2022)
Total test results (Apr 18, 2022)
COVID Vaccine doses distributed (per 100k population) (Sep 19, 2023)
COVID Vaccine doses administered (per 100k population) (Sep 19, 2023)
COVID Vaccine doses distributed (Sep 19, 2023)
COVID Vaccine doses administered (Sep 19, 2023)
Likely homosexual households (%)
Likely homosexual households (% change since 2000)
Likely homosexual households - Lesbian couples (%)
Likely homosexual households - Lesbian couples (% change since 2000)
Likely homosexual households - Gay men (%)
Likely homosexual households - Gay men (% change since 2000)
Cost of living index
Median gross rent ($)
Median contract rent ($)
Median monthly housing costs ($)
Median house or condo value ($)
Median house or condo value ($ change since 2000)
Mean house or condo value by units in structure - 1, detached ($)
Mean house or condo value by units in structure - 1, attached ($)
Mean house or condo value by units in structure - 2 ($)
Mean house or condo value by units in structure by units in structure - 3 or 4 ($)
Mean house or condo value by units in structure - 5 or more ($)
Mean house or condo value by units in structure - Boat, RV, van, etc. ($)
Mean house or condo value by units in structure - Mobile home ($)
Median house or condo value ($) - White
Median house or condo value ($) - Black or African American
Median house or condo value ($) - Asian
Median house or condo value ($) - Hispanic or Latino
Median house or condo value ($) - American Indian and Alaska Native
Median house or condo value ($) - Multirace
Median house or condo value ($) - Other Race
Median resident age
Resident age diversity
Median resident age - Males
Median resident age - Females
Median resident age - White
Median resident age - Black or African American
Median resident age - Asian
Median resident age - Hispanic or Latino
Median resident age - American Indian and Alaska Native
Median resident age - Multirace
Median resident age - Other Race
Median resident age - Males - White
Median resident age - Males - Black or African American
Median resident age - Males - Asian
Median resident age - Males - Hispanic or Latino
Median resident age - Males - American Indian and Alaska Native
Median resident age - Males - Multirace
Median resident age - Males - Other Race
Median resident age - Females - White
Median resident age - Females - Black or African American
Median resident age - Females - Asian
Median resident age - Females - Hispanic or Latino
Median resident age - Females - American Indian and Alaska Native
Median resident age - Females - Multirace
Median resident age - Females - Other Race
Commute - mean travel time to work (minutes)
Travel time to work - Less than 5 minutes (%)
Travel time to work - Less than 5 minutes (% change since 2000)
Travel time to work - 5 to 9 minutes (%)
Travel time to work - 5 to 9 minutes (% change since 2000)
Travel time to work - 10 to 19 minutes (%)
Travel time to work - 10 to 19 minutes (% change since 2000)
Travel time to work - 20 to 29 minutes (%)
Travel time to work - 20 to 29 minutes (% change since 2000)
Travel time to work - 30 to 39 minutes (%)
Travel time to work - 30 to 39 minutes (% change since 2000)
Travel time to work - 40 to 59 minutes (%)
Travel time to work - 40 to 59 minutes (% change since 2000)
Travel time to work - 60 to 89 minutes (%)
Travel time to work - 60 to 89 minutes (% change since 2000)
Travel time to work - 90 or more minutes (%)
Travel time to work - 90 or more minutes (% change since 2000)
Marital status - Never married (%)
Marital status - Now married (%)
Marital status - Separated (%)
Marital status - Widowed (%)
Marital status - Divorced (%)
Median family income ($)
Median family income (% change since 2000)
Median non-family income ($)
Median non-family income (% change since 2000)
Median per capita income ($)
Median per capita income (% change since 2000)
Median family income ($) - White
Median family income ($) - Black or African American
Median family income ($) - Asian
Median family income ($) - Hispanic or Latino
Median family income ($) - American Indian and Alaska Native
Median family income ($) - Multirace
Median family income ($) - Other Race
Median year house/condo built
Median year apartment built
Year house built - Built 2005 or later (%)
Year house built - Built 2000 to 2004 (%)
Year house built - Built 1990 to 1999 (%)
Year house built - Built 1980 to 1989 (%)
Year house built - Built 1970 to 1979 (%)
Year house built - Built 1960 to 1969 (%)
Year house built - Built 1950 to 1959 (%)
Year house built - Built 1940 to 1949 (%)
Year house built - Built 1939 or earlier (%)
Average household size
Household density (households per square mile)
Average household size - White
Average household size - Black or African American
Average household size - Asian
Average household size - Hispanic or Latino
Average household size - American Indian and Alaska Native
Average household size - Multirace
Average household size - Other Race
Occupied housing units (%)
Vacant housing units (%)
Owner occupied housing units (%)
Renter occupied housing units (%)
Vacancy status - For rent (%)
Vacancy status - For sale only (%)
Vacancy status - Rented or sold, not occupied (%)
Vacancy status - For seasonal, recreational, or occasional use (%)
Vacancy status - For migrant workers (%)
Vacancy status - Other vacant (%)
Residents with income below the poverty level (%)
Residents with income below 50% of the poverty level (%)
Children below poverty level (%)
Poor families by family type - Married-couple family (%)
Poor families by family type - Male, no wife present (%)
Poor families by family type - Female, no husband present (%)
Poverty status for native-born residents (%)
Poverty status for foreign-born residents (%)
Poverty among high school graduates not in families (%)
Poverty among people who did not graduate high school not in families (%)
Residents with income below the poverty level (%) - White
Residents with income below the poverty level (%) - Black or African American
Residents with income below the poverty level (%) - Asian
Residents with income below the poverty level (%) - Hispanic or Latino
Residents with income below the poverty level (%) - American Indian and Alaska Native
Residents with income below the poverty level (%) - Multirace
Residents with income below the poverty level (%) - Other Race
Air pollution - Air Quality Index (AQI)
Air pollution - CO
Air pollution - NO2
Air pollution - SO2
Air pollution - Ozone
Air pollution - PM10
Air pollution - PM25
Air pollution - Pb
Crime - Murders per 100,000 population
Crime - Rapes per 100,000 population
Crime - Robberies per 100,000 population
Crime - Assaults per 100,000 population
Crime - Burglaries per 100,000 population
Crime - Thefts per 100,000 population
Crime - Auto thefts per 100,000 population
Crime - Arson per 100,000 population
Crime - City-data.com crime index
Crime - Violent crime index
Crime - Property crime index
Crime - Murders per 100,000 population (5 year average)
Crime - Rapes per 100,000 population (5 year average)
Crime - Robberies per 100,000 population (5 year average)
Crime - Assaults per 100,000 population (5 year average)
Crime - Burglaries per 100,000 population (5 year average)
Crime - Thefts per 100,000 population (5 year average)
Crime - Auto thefts per 100,000 population (5 year average)
Crime - Arson per 100,000 population (5 year average)
Crime - City-data.com crime index (5 year average)
Crime - Violent crime index (5 year average)
Crime - Property crime index (5 year average)
1996 Presidential Elections Results (%) - Democratic Party (Clinton)
1996 Presidential Elections Results (%) - Republican Party (Dole)
1996 Presidential Elections Results (%) - Other
2000 Presidential Elections Results (%) - Democratic Party (Gore)
2000 Presidential Elections Results (%) - Republican Party (Bush)
2000 Presidential Elections Results (%) - Other
2004 Presidential Elections Results (%) - Democratic Party (Kerry)
2004 Presidential Elections Results (%) - Republican Party (Bush)
2004 Presidential Elections Results (%) - Other
2008 Presidential Elections Results (%) - Democratic Party (Obama)
2008 Presidential Elections Results (%) - Republican Party (McCain)
2008 Presidential Elections Results (%) - Other
2012 Presidential Elections Results (%) - Democratic Party (Obama)
2012 Presidential Elections Results (%) - Republican Party (Romney)
2012 Presidential Elections Results (%) - Other
2016 Presidential Elections Results (%) - Democratic Party (Clinton)
2016 Presidential Elections Results (%) - Republican Party (Trump)
2016 Presidential Elections Results (%) - Other
2020 Presidential Elections Results (%) - Democratic Party (Biden)
2020 Presidential Elections Results (%) - Republican Party (Trump)
2020 Presidential Elections Results (%) - Other
Ancestries Reported - Arab (%)
Ancestries Reported - Czech (%)
Ancestries Reported - Danish (%)
Ancestries Reported - Dutch (%)
Ancestries Reported - English (%)
Ancestries Reported - French (%)
Ancestries Reported - French Canadian (%)
Ancestries Reported - German (%)
Ancestries Reported - Greek (%)
Ancestries Reported - Hungarian (%)
Ancestries Reported - Irish (%)
Ancestries Reported - Italian (%)
Ancestries Reported - Lithuanian (%)
Ancestries Reported - Norwegian (%)
Ancestries Reported - Polish (%)
Ancestries Reported - Portuguese (%)
Ancestries Reported - Russian (%)
Ancestries Reported - Scotch-Irish (%)
Ancestries Reported - Scottish (%)
Ancestries Reported - Slovak (%)
Ancestries Reported - Subsaharan African (%)
Ancestries Reported - Swedish (%)
Ancestries Reported - Swiss (%)
Ancestries Reported - Ukrainian (%)
Ancestries Reported - United States (%)
Ancestries Reported - Welsh (%)
Ancestries Reported - West Indian (%)
Ancestries Reported - Other (%)
Educational Attainment - No schooling completed (%)
Educational Attainment - Less than high school (%)
Educational Attainment - High school or equivalent (%)
Educational Attainment - Less than 1 year of college (%)
Educational Attainment - 1 or more years of college (%)
Educational Attainment - Associate degree (%)
Educational Attainment - Bachelor's degree (%)
Educational Attainment - Master's degree (%)
Educational Attainment - Professional school degree (%)
Educational Attainment - Doctorate degree (%)
School Enrollment - Nursery, preschool (%)
School Enrollment - Kindergarten (%)
School Enrollment - Grade 1 to 4 (%)
School Enrollment - Grade 5 to 8 (%)
School Enrollment - Grade 9 to 12 (%)
School Enrollment - College undergrad (%)
School Enrollment - Graduate or professional (%)
School Enrollment - Not enrolled in school (%)
School enrollment - Public schools (%)
School enrollment - Private schools (%)
School enrollment - Not enrolled (%)
Median number of rooms in houses and condos
Median number of rooms in apartments
Housing units lacking complete plumbing facilities (%)
Housing units lacking complete kitchen facilities (%)
Density of houses
Urban houses (%)
Rural houses (%)
Households with people 60 years and over (%)
Households with people 65 years and over (%)
Households with people 75 years and over (%)
Households with one or more nonrelatives (%)
Households with no nonrelatives (%)
Population in households (%)
Family households (%)
Nonfamily households (%)
Population in families (%)
Family households with own children (%)
Median number of bedrooms in owner occupied houses
Mean number of bedrooms in owner occupied houses
Median number of bedrooms in renter occupied houses
Mean number of bedrooms in renter occupied houses
Median number of vehichles in owner occupied houses
Mean number of vehichles in owner occupied houses
Median number of vehichles in renter occupied houses
Mean number of vehichles in renter occupied houses
Mortgage status - with mortgage (%)
Mortgage status - with second mortgage (%)
Mortgage status - with home equity loan (%)
Mortgage status - with both second mortgage and home equity loan (%)
Mortgage status - without a mortgage (%)
Average family size
Average family size - White
Average family size - Black or African American
Average family size - Asian
Average family size - Hispanic or Latino
Average family size - American Indian and Alaska Native
Average family size - Multirace
Average family size - Other Race
Geographical mobility - Same house 1 year ago (%)
Geographical mobility - Moved within same county (%)
Geographical mobility - Moved from different county within same state (%)
Geographical mobility - Moved from different state (%)
Geographical mobility - Moved from abroad (%)
Place of birth - Born in state of residence (%)
Place of birth - Born in other state (%)
Place of birth - Native, outside of US (%)
Place of birth - Foreign born (%)
Housing units in structures - 1, detached (%)
Housing units in structures - 1, attached (%)
Housing units in structures - 2 (%)
Housing units in structures - 3 or 4 (%)
Housing units in structures - 5 to 9 (%)
Housing units in structures - 10 to 19 (%)
Housing units in structures - 20 to 49 (%)
Housing units in structures - 50 or more (%)
Housing units in structures - Mobile home (%)
Housing units in structures - Boat, RV, van, etc. (%)
House/condo owner moved in on average (years ago)
Renter moved in on average (years ago)
Year householder moved into unit - Moved in 1999 to March 2000 (%)
Year householder moved into unit - Moved in 1995 to 1998 (%)
Year householder moved into unit - Moved in 1990 to 1994 (%)
Year householder moved into unit - Moved in 1980 to 1989 (%)
Year householder moved into unit - Moved in 1970 to 1979 (%)
Year householder moved into unit - Moved in 1969 or earlier (%)
Means of transportation to work - Drove car alone (%)
Means of transportation to work - Carpooled (%)
Means of transportation to work - Public transportation (%)
Means of transportation to work - Bus or trolley bus (%)
Means of transportation to work - Streetcar or trolley car (%)
Means of transportation to work - Subway or elevated (%)
Means of transportation to work - Railroad (%)
Means of transportation to work - Ferryboat (%)
Means of transportation to work - Taxicab (%)
Means of transportation to work - Motorcycle (%)
Means of transportation to work - Bicycle (%)
Means of transportation to work - Walked (%)
Means of transportation to work - Other means (%)
Working at home (%)
Industry diversity
Most Common Industries - Agriculture, forestry, fishing and hunting, and mining (%)
Most Common Industries - Agriculture, forestry, fishing and hunting (%)
Most Common Industries - Mining, quarrying, and oil and gas extraction (%)
Most Common Industries - Construction (%)
Most Common Industries - Manufacturing (%)
Most Common Industries - Wholesale trade (%)
Most Common Industries - Retail trade (%)
Most Common Industries - Transportation and warehousing, and utilities (%)
Most Common Industries - Transportation and warehousing (%)
Most Common Industries - Utilities (%)
Most Common Industries - Information (%)
Most Common Industries - Finance and insurance, and real estate and rental and leasing (%)
Most Common Industries - Finance and insurance (%)
Most Common Industries - Real estate and rental and leasing (%)
Most Common Industries - Professional, scientific, and management, and administrative and waste management services (%)
Most Common Industries - Professional, scientific, and technical services (%)
Most Common Industries - Management of companies and enterprises (%)
Most Common Industries - Administrative and support and waste management services (%)
Most Common Industries - Educational services, and health care and social assistance (%)
Most Common Industries - Educational services (%)
Most Common Industries - Health care and social assistance (%)
Most Common Industries - Arts, entertainment, and recreation, and accommodation and food services (%)
Most Common Industries - Arts, entertainment, and recreation (%)
Most Common Industries - Accommodation and food services (%)
Most Common Industries - Other services, except public administration (%)
Most Common Industries - Public administration (%)
Occupation diversity
Most Common Occupations - Management, business, science, and arts occupations (%)
Most Common Occupations - Management, business, and financial occupations (%)
Most Common Occupations - Management occupations (%)
Most Common Occupations - Business and financial operations occupations (%)
Most Common Occupations - Computer, engineering, and science occupations (%)
Most Common Occupations - Computer and mathematical occupations (%)
Most Common Occupations - Architecture and engineering occupations (%)
Most Common Occupations - Life, physical, and social science occupations (%)
Most Common Occupations - Education, legal, community service, arts, and media occupations (%)
Most Common Occupations - Community and social service occupations (%)
Most Common Occupations - Legal occupations (%)
Most Common Occupations - Education, training, and library occupations (%)
Most Common Occupations - Arts, design, entertainment, sports, and media occupations (%)
Most Common Occupations - Healthcare practitioners and technical occupations (%)
Most Common Occupations - Health diagnosing and treating practitioners and other technical occupations (%)
Most Common Occupations - Health technologists and technicians (%)
Most Common Occupations - Service occupations (%)
Most Common Occupations - Healthcare support occupations (%)
Most Common Occupations - Protective service occupations (%)
Most Common Occupations - Fire fighting and prevention, and other protective service workers including supervisors (%)
Most Common Occupations - Law enforcement workers including supervisors (%)
Most Common Occupations - Food preparation and serving related occupations (%)
Most Common Occupations - Building and grounds cleaning and maintenance occupations (%)
Most Common Occupations - Personal care and service occupations (%)
Most Common Occupations - Sales and office occupations (%)
Most Common Occupations - Sales and related occupations (%)
Most Common Occupations - Office and administrative support occupations (%)
Most Common Occupations - Natural resources, construction, and maintenance occupations (%)
Most Common Occupations - Farming, fishing, and forestry occupations (%)
Most Common Occupations - Construction and extraction occupations (%)
Most Common Occupations - Installation, maintenance, and repair occupations (%)
Most Common Occupations - Production, transportation, and material moving occupations (%)
Most Common Occupations - Production occupations (%)
Most Common Occupations - Transportation occupations (%)
Most Common Occupations - Material moving occupations (%)
People in Group quarters - Institutionalized population (%)
People in Group quarters - Correctional institutions (%)
People in Group quarters - Federal prisons and detention centers (%)
People in Group quarters - Halfway houses (%)
People in Group quarters - Local jails and other confinement facilities (including police lockups) (%)
People in Group quarters - Military disciplinary barracks (%)
People in Group quarters - State prisons (%)
People in Group quarters - Other types of correctional institutions (%)
People in Group quarters - Nursing homes (%)
People in Group quarters - Hospitals/wards, hospices, and schools for the handicapped (%)
People in Group quarters - Hospitals/wards and hospices for chronically ill (%)
People in Group quarters - Hospices or homes for chronically ill (%)
People in Group quarters - Military hospitals or wards for chronically ill (%)
People in Group quarters - Other hospitals or wards for chronically ill (%)
People in Group quarters - Hospitals or wards for drug/alcohol abuse (%)
People in Group quarters - Mental (Psychiatric) hospitals or wards (%)
People in Group quarters - Schools, hospitals, or wards for the mentally retarded (%)
People in Group quarters - Schools, hospitals, or wards for the physically handicapped (%)
People in Group quarters - Institutions for the deaf (%)
People in Group quarters - Institutions for the blind (%)
People in Group quarters - Orthopedic wards and institutions for the physically handicapped (%)
People in Group quarters - Wards in general hospitals for patients who have no usual home elsewhere (%)
People in Group quarters - Wards in military hospitals for patients who have no usual home elsewhere (%)
People in Group quarters - Juvenile institutions (%)
People in Group quarters - Long-term care (%)
People in Group quarters - Homes for abused, dependent, and neglected children (%)
People in Group quarters - Residential treatment centers for emotionally disturbed children (%)
People in Group quarters - Training schools for juvenile delinquents (%)
People in Group quarters - Short-term care, detention or diagnostic centers for delinquent children (%)
People in Group quarters - Type of juvenile institution unknown (%)
People in Group quarters - Noninstitutionalized population (%)
People in Group quarters - College dormitories (includes college quarters off campus) (%)
People in Group quarters - Military quarters (%)
People in Group quarters - On base (%)
People in Group quarters - Barracks, unaccompanied personnel housing (UPH), (Enlisted/Officer), ;and similar group living quarters for military personnel (%)
People in Group quarters - Transient quarters for temporary residents (%)
People in Group quarters - Military ships (%)
People in Group quarters - Group homes (%)
People in Group quarters - Homes or halfway houses for drug/alcohol abuse (%)
People in Group quarters - Homes for the mentally ill (%)
People in Group quarters - Homes for the mentally retarded (%)
People in Group quarters - Homes for the physically handicapped (%)
People in Group quarters - Other group homes (%)
People in Group quarters - Religious group quarters (%)
People in Group quarters - Dormitories (%)
People in Group quarters - Agriculture workers' dormitories on farms (%)
People in Group quarters - Job Corps and vocational training facilities (%)
People in Group quarters - Other workers' dormitories (%)
People in Group quarters - Crews of maritime vessels (%)
People in Group quarters - Other nonhousehold living situations (%)
People in Group quarters - Other noninstitutional group quarters (%)
Residents speaking English at home (%)
Residents speaking English at home - Born in the United States (%)
Residents speaking English at home - Native, born elsewhere (%)
Residents speaking English at home - Foreign born (%)
Residents speaking Spanish at home (%)
Residents speaking Spanish at home - Born in the United States (%)
Residents speaking Spanish at home - Native, born elsewhere (%)
Residents speaking Spanish at home - Foreign born (%)
Residents speaking other language at home (%)
Residents speaking other language at home - Born in the United States (%)
Residents speaking other language at home - Native, born elsewhere (%)
Residents speaking other language at home - Foreign born (%)
Class of Workers - Employee of private company (%)
Class of Workers - Self-employed in own incorporated business (%)
Class of Workers - Private not-for-profit wage and salary workers (%)
Class of Workers - Local government workers (%)
Class of Workers - State government workers (%)
Class of Workers - Federal government workers (%)
Class of Workers - Self-employed workers in own not incorporated business and Unpaid family workers (%)
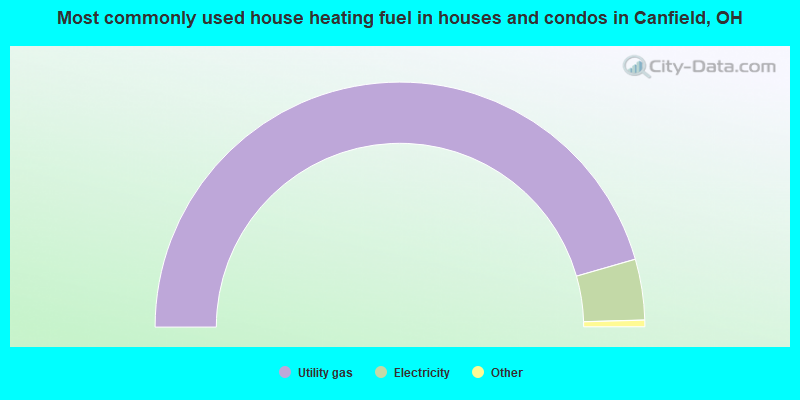
House heating fuel used in houses and condos - Utility gas (%)
House heating fuel used in houses and condos - Bottled, tank, or LP gas (%)
House heating fuel used in houses and condos - Electricity (%)
House heating fuel used in houses and condos - Fuel oil, kerosene, etc. (%)
House heating fuel used in houses and condos - Coal or coke (%)
House heating fuel used in houses and condos - Wood (%)
House heating fuel used in houses and condos - Solar energy (%)
House heating fuel used in houses and condos - Other fuel (%)
House heating fuel used in houses and condos - No fuel used (%)
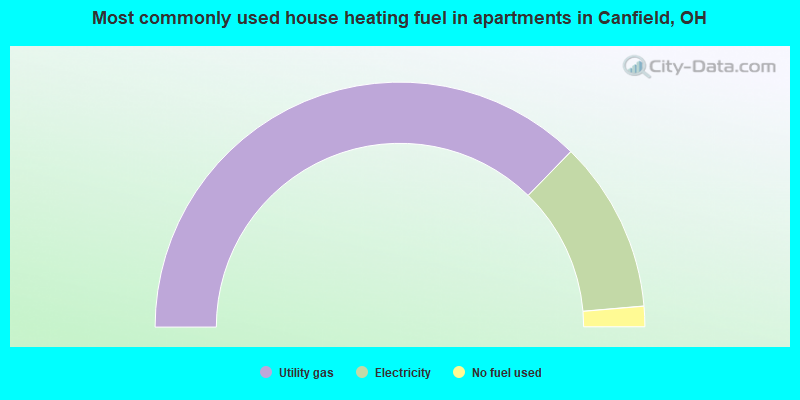
House heating fuel used in apartments - Utility gas (%)
House heating fuel used in apartments - Bottled, tank, or LP gas (%)
House heating fuel used in apartments - Electricity (%)
House heating fuel used in apartments - Fuel oil, kerosene, etc. (%)
House heating fuel used in apartments - Coal or coke (%)
House heating fuel used in apartments - Wood (%)
House heating fuel used in apartments - Solar energy (%)
House heating fuel used in apartments - Other fuel (%)
House heating fuel used in apartments - No fuel used (%)
Armed forces status - In Armed Forces (%)
Armed forces status - Civilian (%)
Armed forces status - Civilian - Veteran (%)
Armed forces status - Civilian - Nonveteran (%)
Fatal accidents locations in years 2005-2021
Fatal accidents locations in 2005
Fatal accidents locations in 2006
Fatal accidents locations in 2007
Fatal accidents locations in 2008
Fatal accidents locations in 2009
Fatal accidents locations in 2010
Fatal accidents locations in 2011
Fatal accidents locations in 2012
Fatal accidents locations in 2013
Fatal accidents locations in 2014
Fatal accidents locations in 2015
Fatal accidents locations in 2016
Fatal accidents locations in 2017
Fatal accidents locations in 2018
Fatal accidents locations in 2019
Fatal accidents locations in 2020
Fatal accidents locations in 2021
Alcohol use - People drinking some alcohol every month (%)
Alcohol use - People not drinking at all (%)
Alcohol use - Average days/month drinking alcohol
Alcohol use - Average drinks/week
Alcohol use - Average days/year people drink much
Audiometry - Average condition of hearing (%)
Audiometry - People that can hear a whisper from across a quiet room (%)
Audiometry - People that can hear normal voice from across a quiet room (%)
Audiometry - Ears ringing, roaring, buzzing (%)
Audiometry - Had a job exposure to loud noise (%)
Audiometry - Had off-work exposure to loud noise (%)
Blood Pressure & Cholesterol - Has high blood pressure (%)
Blood Pressure & Cholesterol - Checking blood pressure at home (%)
Blood Pressure & Cholesterol - Frequently checking blood cholesterol (%)
Blood Pressure & Cholesterol - Has high cholesterol level (%)
Consumer Behavior - Money monthly spent on food at supermarket/grocery store
Consumer Behavior - Money monthly spent on food at other stores
Consumer Behavior - Money monthly spent on eating out
Consumer Behavior - Money monthly spent on carryout/delivered foods
Consumer Behavior - Income spent on food at supermarket/grocery store (%)
Consumer Behavior - Income spent on food at other stores (%)
Consumer Behavior - Income spent on eating out (%)
Consumer Behavior - Income spent on carryout/delivered foods (%)
Current Health Status - General health condition (%)
Current Health Status - Blood donors (%)
Current Health Status - Has blood ever tested for HIV virus (%)
Current Health Status - Left-handed people (%)
Dermatology - People using sunscreen (%)
Diabetes - Diabetics (%)
Diabetes - Had a blood test for high blood sugar (%)
Diabetes - People taking insulin (%)
Diet Behavior & Nutrition - Diet health (%)
Diet Behavior & Nutrition - Milk product consumption (# of products/month)
Diet Behavior & Nutrition - Meals not home prepared (#/week)
Diet Behavior & Nutrition - Meals from fast food or pizza place (#/week)
Diet Behavior & Nutrition - Ready-to-eat foods (#/month)
Diet Behavior & Nutrition - Frozen meals/pizza (#/month)
Drug Use - People that ever used marijuana or hashish (%)
Drug Use - Ever used hard drugs (%)
Drug Use - Ever used any form of cocaine (%)
Drug Use - Ever used heroin (%)
Drug Use - Ever used methamphetamine (%)
Health Insurance - People covered by health insurance (%)
Kidney Conditions-Urology - Avg. # of times urinating at night
Medical Conditions - People with asthma (%)
Medical Conditions - People with anemia (%)
Medical Conditions - People with psoriasis (%)
Medical Conditions - People with overweight (%)
Medical Conditions - Elderly people having difficulties in thinking or remembering (%)
Medical Conditions - People who ever received blood transfusion (%)
Medical Conditions - People having trouble seeing even with glass/contacts (%)
Medical Conditions - People with arthritis (%)
Medical Conditions - People with gout (%)
Medical Conditions - People with congestive heart failure (%)
Medical Conditions - People with coronary heart disease (%)
Medical Conditions - People with angina pectoris (%)
Medical Conditions - People who ever had heart attack (%)
Medical Conditions - People who ever had stroke (%)
Medical Conditions - People with emphysema (%)
Medical Conditions - People with thyroid problem (%)
Medical Conditions - People with chronic bronchitis (%)
Medical Conditions - People with any liver condition (%)
Medical Conditions - People who ever had cancer or malignancy (%)
Mental Health - People who have little interest in doing things (%)
Mental Health - People feeling down, depressed, or hopeless (%)
Mental Health - People who have trouble sleeping or sleeping too much (%)
Mental Health - People feeling tired or having little energy (%)
Mental Health - People with poor appetite or overeating (%)
Mental Health - People feeling bad about themself (%)
Mental Health - People who have trouble concentrating on things (%)
Mental Health - People moving or speaking slowly or too fast (%)
Mental Health - People having thoughts they would be better off dead (%)
Oral Health - Average years since last visit a dentist
Oral Health - People embarrassed because of mouth (%)
Oral Health - People with gum disease (%)
Oral Health - General health of teeth and gums (%)
Oral Health - Average days a week using dental floss/device
Oral Health - Average days a week using mouthwash for dental problem
Oral Health - Average number of teeth
Pesticide Use - Households using pesticides to control insects (%)
Pesticide Use - Households using pesticides to kill weeds (%)
Physical Activity - People doing vigorous-intensity work activities (%)
Physical Activity - People doing moderate-intensity work activities (%)
Physical Activity - People walking or bicycling (%)
Physical Activity - People doing vigorous-intensity recreational activities (%)
Physical Activity - People doing moderate-intensity recreational activities (%)
Physical Activity - Average hours a day doing sedentary activities
Physical Activity - Average hours a day watching TV or videos
Physical Activity - Average hours a day using computer
Physical Functioning - People having limitations keeping them from working (%)
Physical Functioning - People limited in amount of work they can do (%)
Physical Functioning - People that need special equipment to walk (%)
Physical Functioning - People experiencing confusion/memory problems (%)
Physical Functioning - People requiring special healthcare equipment (%)
Prescription Medications - Average number of prescription medicines taking
Preventive Aspirin Use - Adults 40+ taking low-dose aspirin (%)
Reproductive Health - Vaginal deliveries (%)
Reproductive Health - Cesarean deliveries (%)
Reproductive Health - Deliveries resulted in a live birth (%)
Reproductive Health - Pregnancies resulted in a delivery (%)
Reproductive Health - Women breastfeeding newborns (%)
Reproductive Health - Women that had a hysterectomy (%)
Reproductive Health - Women that had both ovaries removed (%)
Reproductive Health - Women that have ever taken birth control pills (%)
Reproductive Health - Women taking birth control pills (%)
Reproductive Health - Women that have ever used Depo-Provera or injectables (%)
Reproductive Health - Women that have ever used female hormones (%)
Sexual Behavior - People 18+ that ever had sex (vaginal, anal, or oral) (%)
Sexual Behavior - Males 18+ that ever had vaginal sex with a woman (%)
Sexual Behavior - Males 18+ that ever performed oral sex on a woman (%)
Sexual Behavior - Males 18+ that ever had anal sex with a woman (%)
Sexual Behavior - Males 18+ that ever had any sex with a man (%)
Sexual Behavior - Females 18+ that ever had vaginal sex with a man (%)
Sexual Behavior - Females 18+ that ever performed oral sex on a man (%)
Sexual Behavior - Females 18+ that ever had anal sex with a man (%)
Sexual Behavior - Females 18+ that ever had any kind of sex with a woman (%)
Sexual Behavior - Average age people first had sex
Sexual Behavior - Average number of female sex partners in lifetime (males 18+)
Sexual Behavior - Average number of female vaginal sex partners in lifetime (males 18+)
Sexual Behavior - Average age people first performed oral sex on a woman (18+)
Sexual Behavior - Average number of woman performed oral sex on in lifetime (18+)
Sexual Behavior - Average number of male sex partners in lifetime (males 18+)
Sexual Behavior - Average number of male anal sex partners in lifetime (males 18+)
Sexual Behavior - Average age people first performed oral sex on a man (18+)
Sexual Behavior - Average number of male oral sex partners in lifetime (18+)
Sexual Behavior - People using protection when performing oral sex (%)
Sexual Behavior - Average number of times people have vaginal or anal sex a year
Sexual Behavior - People having sex without condom (%)
Sexual Behavior - Average number of male sex partners in lifetime (females 18+)
Sexual Behavior - Average number of male vaginal sex partners in lifetime (females 18+)
Sexual Behavior - Average number of female sex partners in lifetime (females 18+)
Sexual Behavior - Circumcised males 18+ (%)
Sleep Disorders - Average hours sleeping at night
Sleep Disorders - People that has trouble sleeping (%)
Smoking-Cigarette Use - People smoking cigarettes (%)
Taste & Smell - People 40+ having problems with smell (%)
Taste & Smell - People 40+ having problems with taste (%)
Taste & Smell - People 40+ that ever had wisdom teeth removed (%)
Taste & Smell - People 40+ that ever had tonsils teeth removed (%)
Taste & Smell - People 40+ that ever had a loss of consciousness because of a head injury (%)
Taste & Smell - People 40+ that ever had a broken nose or other serious injury to face or skull (%)
Taste & Smell - People 40+ that ever had two or more sinus infections (%)
Weight - Average height (inches)
Weight - Average weight (pounds)
Weight - Average BMI
Weight - People that are obese (%)
Weight - People that ever were obese (%)
Weight - People trying to lose weight (%)
According to our research of Ohio and other state lists, there were 12 registered sex offenders living in Canfield, Ohio as of June 10, 2024 . The ratio of all residents to sex offenders in Canfield is 607 to 1.The ratio of registered sex offenders to all residents in this city is near the state average.
Officers per 1,000 residents here:
2.67Ohio average:
2.31
Latest news from Canfield, OH collected exclusively by city-data.com from local newspapers, TV, and radio stations
Ancestries: Italian (26.5%), English (14.4%), Irish (8.0%), Slovak (7.3%), German (6.1%), Croatian (5.1%).
Current Local Time:
Land area: 4.64 square miles.
Population density: 1,639 people per square mile (low).
297 residents are foreign born (1.5% Europe , 1.4% Asia , 0.8% Latin America ).
Median real estate property taxes paid for housing units with mortgages in 2022: $3,402 (1.4%)Median real estate property taxes paid for housing units with no mortgage in 2022: $2,671 (1.5%)
Nearest city with pop. 50,000+: Youngstown, OH
Nearest city with pop. 200,000+: Akron, OH
Nearest city with pop. 1,000,000+: Philadelphia, PA
Nearest cities:
Latitude: 41.03 N, Longitude: 80.77 W
Daytime population change due to commuting: -250 (-3.3%)Workers who live and work in this city: 780 (22.3%)
Unemployment in December 2023:
Population change in the 1990s: +1,973 (+36.5%).
Most common industries in Canfield, OH (%)
Both Males Females
Educational services (15.1%)
Professional, scientific, technical services (9.2%)
Health care (9.0%)
Accommodation & food services (6.6%)
Finance & insurance (6.1%)
Construction (5.5%)
Transportation equipment (4.9%)
Educational services (10.4%)
Construction (9.9%)
Professional, scientific, technical services (9.1%)
Transportation equipment (8.1%)
Motor vehicle & parts dealers (5.6%)
Finance & insurance (5.2%)
Metal & metal products (5.0%)
Educational services (20.5%)
Health care (15.0%)
Accommodation & food services (9.4%)
Professional, scientific, technical services (9.3%)
Finance & insurance (7.2%)
Religious, grantmaking, civic, professional, similar organizations (3.3%)
Arts, entertainment, recreation (3.3%)
Most common occupations in Canfield, OH (%)
Both Males Females
Other sales and related occupations, including supervisors (7.5%)
Other management occupations, except farmers and farm managers (6.5%)
Sales representatives, services, wholesale and manufacturing (4.7%)
Other office and administrative support workers, including supervisors (3.8%)
Preschool, kindergarten, elementary, and middle school teachers (3.6%)
Top executives (3.5%)
Secretaries and administrative assistants (3.5%)
Other management occupations, except farmers and farm managers (9.2%)
Other sales and related occupations, including supervisors (6.3%)
Sales representatives, services, wholesale and manufacturing (6.0%)
Top executives (5.7%)
Engineers (4.1%)
Lawyers (3.6%)
Metal workers and plastic workers (3.5%)
Other sales and related occupations, including supervisors (8.9%)
Secretaries and administrative assistants (7.0%)
Other office and administrative support workers, including supervisors (6.0%)
Waiters and waitresses (5.0%)
Bookkeeping, accounting, and auditing clerks (4.5%)
Registered nurses (4.4%)
Preschool, kindergarten, elementary, and middle school teachers (4.2%)
Tornado activity:
Canfield-area historical tornado activity is slightly below Ohio state average. It is 5% greater than the overall U.S. average.
On 5/31/1985, a category F5 (max. wind speeds 261-318 mph) tornado 23.2 miles away from the Canfield city center killed 18 people and injured 310 people and caused between $50,000,000 and $500,000,000 in damages.
On 8/5/1956, a category F3 (max. wind speeds 158-206 mph) tornado 8.0 miles away from the city center killed 2 people and caused between $50,000 and $500,000 in damages.
Earthquake activity:
Canfield-area historical earthquake activity is significantly above Ohio state average. It is 53% smaller than the overall U.S. average. On 9/25/1998 at 19:52:52, a magnitude 5.2 (4.8 MB, 4.3 MS, 5.2 LG, 4.5 MW, Depth: 3.1 mi, Class: Moderate, Intensity: VI - VII) earthquake occurred 37.2 miles away from Canfield center On 1/31/1986 at 16:46:43, a magnitude 5.0 (5.0 MB) earthquake occurred 44.6 miles away from Canfield center On 8/23/2011 at 17:51:04, a magnitude 5.8 (5.8 MW, Depth: 3.7 mi) earthquake occurred 263.4 miles away from the city center On 12/31/2011 at 20:05:01, a magnitude 4.0 (4.0 ML, Depth: 3.1 mi, Class: Light, Intensity: IV - V) earthquake occurred 7.6 miles away from the city center On 7/27/1980 at 18:52:21, a magnitude 5.2 (5.1 MB, 4.7 MS, 5.0 UK, 5.2 UK) earthquake occurred 258.5 miles away from the city center On 6/10/2019 at 14:50:45, a magnitude 4.0 (4.0 MB, Depth: 1.2 mi) earthquake occurred 57.5 miles away from the city center Magnitude types: regional Lg-wave magnitude (LG), body-wave magnitude (MB), local magnitude (ML), surface-wave magnitude (MS), moment magnitude (MW) Natural disasters: The number of natural disasters in Mahoning County (9) is smaller than the US average (15).Major Disasters (Presidential) Declared: 6Emergencies Declared: 2Floods: 6, Storms: 6, Tornadoes: 3, Blizzard: 1, Hurricane: 1, Snowstorm: 1, Wind: 1, Other: 1 (Note: some incidents may be assigned to more than one category). Main business address for: RAINBOW RENTALS INC SERVICES-EQUIPMENT RENTAL & LEASING, NEC ), FARMERS NATIONAL BANC CORP /OH/ STATE COMMERCIAL BANKS ), EVERFLOW EASTERN PARTNERS LP CRUDE PETROLEUM & NATURAL GAS ).
Hospitals and medical centers in Canfield: C S S CARDINAL DRIVE (74 CARDINAL DRIVE) ARC/CDC, LTD. (3695 STUTZ DRIVE)
SENIOR INDEPENDENCE (6715 TIPPECANOE, BUILDING E, SUITE 201)
Amtrak stations near Canfield: 8 miles: YOUNGSTOWN (530 MAHONING AVE.) Services: enclosed waiting area, public restrooms, public payphones, free short-term parking, call for taxi service.
19 miles: ALLIANCE (MAIN & WEBB STS.) Services: public payphones, free short-term parking, free long-term parking.
College/University in Canfield: Mahoning County Career and Technical Center Full-time enrollment: 69; Location: 7300 N Palmyra Rd; Public; Website: www.mahoningctc.com)
Colleges/universities with over 2000 students nearest to Canfield:
Youngstown State University (about 9 miles; Youngstown, OH ; Full-time enrollment: 11,575)
University of Mount Union (about 20 miles; Alliance, OH ; FT enrollment: 2,302)
Kent State University at Kent (about 32 miles; Kent, OH ; FT enrollment: 25,431)
Walsh University (about 34 miles; North Canton, OH ; FT enrollment: 2,553)
Malone University (about 36 miles; Canton, OH ; FT enrollment: 2,201)
Kent State University at Stark (about 37 miles; Canton, OH ; FT enrollment: 3,259)
Grove City College (about 37 miles; Grove City, PA ; FT enrollment: 2,560)
Public high schools in Canfield: CANFIELD HIGH SCHOOL Students: 1,054, Location: 100 CARDINAL DR, Grades: 9-12)SOUTH RANGE HIGH SCHOOL Students: 417, Location: 11300 COLUMBIANA CANFIELD RD, Grades: 9-12)MAHONING CAREER & TECHNICAL Location: 7300 N PALMYRA RD, Grades: 7-12)
Public elementary/middle schools in Canfield:
See full list of schools located in Canfield
Notable locations in Canfield: (A) , Canfield Memorial Building (B) , Cardinal Joint Fire District Station 1 (C) . Display/hide their locations on the map
Shopping Center: (1) . Display/hide its location on the map
Main business address in Canfield include: (A) , EVERFLOW EASTERN PARTNERS LP (B) . Display/hide their locations on the map
Churches in Canfield include: (A) , Old North Baptist Church (B) , Canfield United Methodist Church (C) , Canfield Presbyterian Church (D) , Canfield Christian Church (E) . Display/hide their locations on the map
Cemeteries: (1) , Canfield Cemetery (2) . Display/hide their locations on the map
Tourist attractions:
Hotels:
Mahoning County has a predicted average indoor radon screening level between 2 and 4 pCi/L (pico curies per liter) - Moderate Potential Drinking water stations with addresses in Canfield and their reported violations in the past:
CANFIELD CITY PWS (Population served: 7,800, Purch surface water):
Past monitoring violations:
Monitoring and Reporting (DBP) - Between JAN-2012 and MAR-2012, Contaminant: Total Haloacetic Acids (HAA5). Follow-up actions: St Compliance achieved (MAY-09-2012), St Public Notif requested (MAY-31-2012), St Violation/Reminder Notice (MAY-31-2012)
Monitoring and Reporting (DBP) - Between JAN-2012 and MAR-2012, Contaminant: TTHM. Follow-up actions: St Compliance achieved (MAY-09-2012), St Public Notif requested (MAY-31-2012), St Violation/Reminder Notice (MAY-31-2012)
Follow-up Or Routine LCR Tap M/R - In OCT-01-2010, Contaminant: Lead and Copper Rule. Follow-up actions: St Public Notif requested (NOV-05-2010), St Violation/Reminder Notice (NOV-05-2010), St Compliance achieved (AUG-25-2011)
Population served: 150, Groundwater):
Past health violations:
MCL, Monthly (TCR) - In JUN-2009, Contaminant: Coliform. Follow-up actions: St Violation/Reminder Notice (JUN-24-2009), St Public Notif requested (JUN-24-2009), St Compliance achieved (OCT-08-2010), St Public Notif received (MAR-13-2012)
MCL, Monthly (TCR) - Between APR-2009 and JUN-2009, Contaminant: Coliform. Follow-up actions: St Violation/Reminder Notice (JUN-01-2009), St Public Notif requested (JUN-01-2009), St Public Notif received (JUN-05-2009), St Compliance achieved (MAR-19-2010)
Past monitoring violations:
3 routine major monitoring violations
Address: 10580 Western Reserve Road Population served: 100, Groundwater):
Past monitoring violations:
One routine major monitoring violation
Address: 10580 Western Reserve Road Population served: 100, Groundwater):
Past health violations:
MCL, Monthly (TCR) - Between JUL-2006 and SEP-2006, Contaminant: Coliform. Follow-up actions: St Public Notif requested (AUG-17-2006), St Violation/Reminder Notice (AUG-17-2006), St Compliance achieved (APR-19-2007)
Past monitoring violations:
One routine major monitoring violation
Population served: 75, Groundwater):
Past monitoring violations:
2 routine major monitoring violations
Population served: 26, Groundwater):
Past monitoring violations:
One routine major monitoring violation
Serves PA, Population served: 25, Groundwater):
Past health violations:
MCL, Monthly (TCR) - Between JUL-2011 and SEP-2011, Contaminant: Coliform. Follow-up actions: St Public Notif requested (SEP-21-2011), St Compliance achieved (SEP-21-2011), St Violation/Reminder Notice (SEP-21-2011)
MCL, Acute (TCR) - Between JUL-2011 and SEP-2011, Contaminant: Coliform. Follow-up actions: St Public Notif requested (SEP-21-2011), St Compliance achieved (SEP-21-2011), St Violation/Reminder Notice (SEP-21-2011)
Past monitoring violations:
9 routine major monitoring violations
2 regular monitoring violations
Average household size: This city:
2.4 peopleOhio:
2.4 people
Percentage of family households: This city:
71.5%Whole state:
65.0%
Percentage of households with unmarried partners: This city:
2.3%Whole state:
6.8%
Likely homosexual households (counted as self-reported same-sex unmarried-partner households)
Lesbian couples: 0.2% of all households Gay men: 0.1% of all households
8 people in group homes intended for adults in 2010
Banks with branches in Canfield (2011 data):
The Farmers National Bank of Canfield: Colonial Plaza Branch at 401 East Main Street, branch established on 1966/06/15; The Farmers National Bank Of Canfiel at 20 South Broad Street, branch established on 1887/02/17. Info updated 2006/11/03: Bank assets: $1,055.8 mil, Deposits: $846.0 mil, local headquarters , positive income , 17 total offices , Holding Company: Farmers National Banc Corp.
First Place Bank: Canfield Branch at 2 S Broad St, branch established on 1919/01/01; Seville Branch at 3801 Boardman Canfield Road, branch established on 2006/07/25. Info updated 2011/07/21: Bank assets: $2,754.5 mil, Deposits: $2,219.6 mil, headquarters in Warren, OH, negative income in the last year , Commercial Lending Specialization, 43 total offices
U.S. Bank National Association: Canfield Giant Eagle at 525 East Main Street, branch established on 1999/06/10. Info updated 2012/01/30: Bank assets: $330,470.8 mil, Deposits: $236,091.5 mil, headquarters in Cincinnati, OH, positive income , 3121 total offices , Holding Company: U.S. Bancorp
The Huntington National Bank: Canfield Branch at 11 Manor Hill Drive, branch established on 1995/12/12. Info updated 2012/04/02: Bank assets: $54,183.4 mil, Deposits: $44,300.3 mil, headquarters in Columbus, OH, positive income , Commercial Lending Specialization, 878 total offices , Holding Company: Huntington Bancshares Incorporated
The Home Savings and Loan Company: Canfield Branch at 29 N Broad Street, branch established on 1889/01/01. Info updated 2009/06/25: Bank assets: $2,035.1 mil, Deposits: $1,617.8 mil, headquarters in Youngstown, OH, positive income , Commercial Lending Specialization, 35 total offices
PNC Bank, National Association: Tippecanoe Branch at 3667 Starr Center, branch established on 1979/11/13. Info updated 2012/03/20: Bank assets: $263,309.6 mil, Deposits: $197,343.0 mil, headquarters in Wilmington, DE, positive income , Commercial Lending Specialization, 3085 total offices , Holding Company: Pnc Financial Services Group, Inc., The
KeyBank National Association: Canfield Keycenter Branch at 4030 Boardman Canfield Road, branch established on 2004/09/20. Info updated 2008/03/03: Bank assets: $86,198.8 mil, Deposits: $64,214.8 mil, headquarters in Cleveland, OH, positive income , Commercial Lending Specialization, 1067 total offices , Holding Company: Keycorp
JPMorgan Chase Bank, National Association: Canfield Branch at 34 North Broad Street, branch established on 1970/11/30. Info updated 2011/11/10: Bank assets: $1,811,678.0 mil, Deposits: $1,190,738.0 mil, headquarters in Columbus, OH, positive income , International Specialization, 5577 total offices , Holding Company: Jpmorgan Chase & Co.
For population 15 years and over in Canfield:
Never married: 23.8%Now married: 54.3%Separated: 0.2%Widowed: 10.4%Divorced: 11.3% For population 25 years and over in Canfield:
High school or higher: 95.4%Bachelor's degree or higher: 45.0%Graduate or professional degree: 18.0%Unemployed: 2.6%Mean travel time to work (commute): 22.6 minutes
Education Gini index (Inequality in education) Here:
9.4Ohio average:
11.0
Religion statistics for Canfield, OH (based on Mahoning County data)
Religion Adherents Congregations Catholic 71,180 46 Evangelical Protestant 27,561 137 Mainline Protestant 22,947 82 Black Protestant 9,651 33 Orthodox 4,037 12 Other 1,437 11 None 102,010 -
Source: Clifford Grammich, Kirk Hadaway, Richard Houseal, Dale E.Jones, Alexei Krindatch, Richie Stanley and Richard H.Taylor. 2012. 2010 U.S.Religion Census: Religious Congregations & Membership Study. Association of Statisticians of American Religious Bodies. Jones, Dale E., et al. 2002. Congregations and Membership in the United States 2000. Nashville, TN: Glenmary Research Center. Graphs represent county-level data
Food Environment Statistics: Number of grocery stores : 60This county :
2.50 / 10,000 pop.Ohio :
1.89 / 10,000 pop.
Number of supercenters and club stores : 1This county :
0.04 / 10,000 pop.Ohio :
0.13 / 10,000 pop.
Number of convenience stores (no gas) : 34This county :
1.42 / 10,000 pop.Ohio :
1.25 / 10,000 pop.
Number of convenience stores (with gas) : 64Here :
2.66 / 10,000 pop.State :
2.93 / 10,000 pop.
Number of full-service restaurants : 160This county :
6.66 / 10,000 pop.State :
6.25 / 10,000 pop.
Adult diabetes rate : Mahoning County :
10.8%State :
10.3%
Adult obesity rate : This county :
28.1%Ohio :
29.1%
Low-income preschool obesity rate : Mahoning County :
13.2%Ohio :
11.9%
Health and Nutrition: Healthy diet rate : Canfield:
51.9%State:
50.4%
Average overall health of teeth and gums : Canfield:
49.2%State:
47.8%
People feeling badly about themselves : People not drinking alcohol at all : Average hours sleeping at night : General health condition : Average condition of hearing : This city:
76.9%Ohio:
79.1%
More about Health and Nutrition of Canfield, OH Residents
Local government employment and payroll (March 2022)
Function
Full-time employees
Monthly full-time payroll
Average yearly full-time wage
Part-time employees
Monthly part-time payroll
Police Protection - Officers
19 $129,872 $82,024 0 $0 Police - Other
8 $40,446 $60,669 4 $8,108 Financial Administration
7 $42,370 $72,634 0 $0 Other Government Administration
5 $24,250 $58,200 6 $2,581 Water Supply
4 $22,592 $67,776 0 $0 Streets and Highways
4 $21,972 $65,916 0 $0 Sewerage
4 $28,104 $84,312 0 $0 Judicial and Legal
1 $6,082 $72,984 0 $0
Totals for Government
52 $315,688 $72,851 10 $10,689
Canfield government finances - Expenditure in 2021 (per resident):
Construction - Regular Highways: $1,323,000 ($173.90)
Current Operations - Police Protection: $3,181,000 ($418.11)
Sewerage: $1,652,000 ($217.14)Water Utilities: $1,478,000 ($194.27)Judicial and Legal Services: $470,000 ($61.78)Central Staff Services: $432,000 ($56.78)Regular Highways: $431,000 ($56.65)Financial Administration: $203,000 ($26.68)General Public Buildings: $191,000 ($25.11)Health - Other: $104,000 ($13.67)Local Fire Protection: $98,000 ($12.88)General - Other: $97,000 ($12.75)Parks and Recreation: $77,000 ($10.12)General - Interest on Debt: $29,000 ($3.81)
Intergovernmental to State - General - Other: $77,000 ($10.12)
Other Capital Outlay - General - Other: $677,000 ($88.99)
Sewerage: $113,000 ($14.85)Water Utilities: $50,000 ($6.57)Total Salaries and Wages: $622,000 ($81.76)
Canfield government finances - Revenue in 2021 (per resident):
Charges - Sewerage: $1,473,000 ($193.61)
Other: $441,000 ($57.97)Miscellaneous - General Revenue - Other: $105,000 ($13.80)
Fines and Forfeits: $93,000 ($12.22)Special Assessments: $56,000 ($7.36)Interest Earnings: $27,000 ($3.55)Sale of Property: $11,000 ($1.45)Revenue - Water Utilities: $1,654,000 ($217.40)
State Intergovernmental - Highways: $1,509,000 ($198.34)
Other: $378,000 ($49.68)General Local Government Support: $118,000 ($15.51)Tax - Individual Income: $3,692,000 ($485.28)
Property: $644,000 ($84.65)Other License: $148,000 ($19.45)
Canfield government finances - Debt in 2021 (per resident):
Long Term Debt - Beginning Outstanding - Unspecified Public Purpose: $809,000 ($106.34)
Outstanding Unspecified Public Purpose: $687,000 ($90.30)Retired Unspecified Public Purpose: $122,000 ($16.04)
Canfield government finances - Cash and Securities in 2021 (per resident):
Other Funds - Cash and Securities: $6,621,000 ($870.27)
Businesses in Canfield, OH
Name Count Name Count
Arby's 1 Panera Bread 1 CVS 1 Pizza Hut 1 Curves 1 RadioShack 1 Dairy Queen 1 Ruby Tuesday 1 Dunkin Donuts 1 Subway 1 FedEx 2 T-Mobile 1 H&R Block 1 Taco Bell 1 Hilton 1 True Value 1 MasterBrand Cabinets 3 UPS 6 McDonald's 1 Wendy's 1
Strongest AM radio stations in Canfield:
WNIO (1390 AM; 10 kW; YOUNGSTOWN, OH; Owner: YOUNGSTOWN RADIO LICENSE, L.L.C.)
WKBN (570 AM; 5 kW; YOUNGSTOWN, OH; Owner: CITICASTERS LICENSES, L.P.)
WHKW (1440 AM; 5 kW; WARREN, OH; Owner: SCA LICENSE CORPORATION)
WTAM (1100 AM; 50 kW; CLEVELAND, OH; Owner: JACOR BROADCASTING CORPORATION)
WKNR (850 AM; 50 kW; CLEVELAND, OH; Owner: CARON BROADCASTING, INC.)
KDKA (1020 AM; 50 kW; PITTSBURGH, PA; Owner: INFINITY BROADCASTING OPERATIONS, INC.)
WBBW (1240 AM; 1 kW; YOUNGSTOWN, OH; Owner: CUMULUS LICENSING CORP.)
WHK (1220 AM; 50 kW; CLEVELAND, OH; Owner: CARON BROADCASTING, INC.)
WHBC (1480 AM; 15 kW; CANTON, OH; Owner: NM LICENSING, LLC)
WWVA (1170 AM; 53 kW; WHEELING, WV; Owner: CAPSTAR TX LIMITED PARTNERSHIP)
WKST (1200 AM; 5 kW; NEW CASTLE, PA; Owner: CITICASTERS LICENSES, L.P.)
WASN (1330 AM; 1 kW; CAMPBELL, OH; Owner: CAMPBELL RADIO COMPANY, LLC)
WBZY (1280 AM; 5 kW; NEW CASTLE, PA; Owner: CITICASTERS LICENSES, L.P.)
Strongest FM radio stations in Canfield:
WMXY (98.9 FM; YOUNGSTOWN, OH; Owner: CITICASTERS LICENSES, L.P.)
WHOT-FM (101.1 FM; YOUNGSTOWN, OH; Owner: CUMULUS LICENSING CORP.)
WYTN (91.7 FM; YOUNGSTOWN, OH; Owner: FAMILY STATIONS, INC.)
WYFM (102.9 FM; SHARON, PA; Owner: CUMULUS LICENSING CORP.)
WQXK (105.1 FM; SALEM, OH; Owner: CUMULUS LICENSING CORP.)
WYSU (88.5 FM; YOUNGSTOWN, OH; Owner: YOUNGSTOWN STATE UNIVERSITY)
WNCD (93.3 FM; YOUNGSTOWN, OH; Owner: YOUNGSTOWN RADIO LICENSE, L.L.C.)
WICT (95.1 FM; GROVE CITY, PA; Owner: YOUNGSTOWN RADIO LICENSE, L.L.C.)
WKDD (98.1 FM; CANTON, OH; Owner: CITICASTERS LICENSES, L.P.)
WRBP (101.9 FM; HUBBARD, OH; Owner: STOP 26-RIVERBEND, INC.)
WWIZ (103.9 FM; MERCER, PA; Owner: CUMULUS LICENSING CORP.)
WBBG (106.1 FM; NILES, OH; Owner: CITICASTERS LICENSES, L.P.)
WAKZ (95.9 FM; SHARPSVILLE, PA; Owner: YOUNGSTOWN RADIO LICENSE, L.L.C.)
WZKL (92.5 FM; ALLIANCE, OH; Owner: D. A. PETERSON, INC.)
WENZ (107.9 FM; CLEVELAND, OH; Owner: RADIO ONE LICENSES, LLC)
WOGF (104.3 FM; EAST LIVERPOOL, OH; Owner: KEYMARKET LICENSES, LLC)
WAMO-FM (106.7 FM; BEAVER FALLS, PA; Owner: MCL/MCM-INC)
WHBC-FM (94.1 FM; CANTON, OH; Owner: NM LICENSING, LLC)
TV broadcast stations around Canfield:
WKBN-TV (Channel 27; YOUNGSTOWN, OH; Owner: PIEDMONT TELEVISION OF YOUNGSTOWN LICENSE LLC)
WFMJ-TV (Channel 21; YOUNGSTOWN, OH; Owner: WFMJ TELEVISION, INC.)
WYFX-LP (Channel 62; YOUNGSTOWN, OH; Owner: PIEDMONT TELEVISION OF YOUNGSTOWN LICENSE LLC)
WYTV (Channel 33; YOUNGSTOWN, OH; Owner: CHELSEY BROADCASTING COMPANY OF YOUNGSTOWN, LLC)
WNEO (Channel 45; ALLIANCE, OH; Owner: NORTHEASTERN EDUCATIONAL TELEVISION OF OHIO, INC.)
WDLI (Channel 17; CANTON, OH; Owner: TRINITY BROADCASTING NETWORK, INC.)
W52DS (Channel 52; YOUNGSTOWN, OH; Owner: TRINITY BROADCASTING NETWORK)
WFXI-CA (Channel 17; MERCER, PA; Owner: PIEDMONT TELEVISION OF YOUNGSTOWN LICENSE LLC)
W56CL (Channel 56; NEW CASTLE, PA; Owner: BRUNO-GOODWORTH NETWORK, INC.)
WVPX (Channel 23; AKRON, OH; Owner: PAXSON AKRON LICENSE, INC.)
WXOX-LP (Channel 65; CLEVELAND, OH; Owner: VENTURE TECHNOLOGIES GROUP, LLC)
W53AX (Channel 53; CLEVELAND, OH; Owner: WORD OF GOD FELLOWSHIP, INC.)
W66BQ (Channel 66; BEAVER, PA; Owner: BRUNO-GOODWORTH NETWORK, INC.)
WOAC (Channel 67; CANTON, OH; Owner: WRAY, INC.)
W50BF (Channel 50; SHARON, PA; Owner: CORNERSTONE TELEVISION, INC.)
W58AM (Channel 58; YOUNGSTOWN, ETC., OH; Owner: NORTHEASTERN ED TV OF OHIO, INC.)
National Bridge Inventory (NBI) Statistics 40 Number of bridges420ft / 128m Total length $1,045,000 Total costs400,176 Total average daily traffic58,980 Total average daily truck traffic
New bridges - historical statistics
1 1920-1929 2 1930-1939 2 1940-1949 11 1950-1959 4 1960-1969 12 1970-1979 2 1990-1999 2 2000-2009 3 2010-2019 1 2020-2022
See full National Bridge Inventory statistics for Canfield, OH
Home Mortgage Disclosure Act Aggregated Statistics For Year 2009(Based on 1 partial tract) A) FHA, FSA/RHS & VA B) Conventional C) Refinancings D) Home Improvement Loans F) Non-occupant Loans on Number Average Value Number Average Value Number Average Value Number Average Value Number Average Value
LOANS ORIGINATED 24 $128,368 46 $124,039 190 $134,333 10 $41,027 5 $95,540 APPLICATIONS APPROVED, NOT ACCEPTED 0 $0 2 $162,400 15 $131,882 4 $18,520 2 $69,805 APPLICATIONS DENIED 3 $164,613 4 $118,238 47 $148,901 3 $7,280 1 $56,030 APPLICATIONS WITHDRAWN 2 $161,450 4 $146,728 40 $167,741 3 $12,980 2 $166,195 FILES CLOSED FOR INCOMPLETENESS 0 $0 1 $210,830 8 $140,555 1 $11,400 0 $0
Aggregated Statistics For Year 2008(Based on 1 partial tract) A) FHA, FSA/RHS & VA B) Conventional C) Refinancings D) Home Improvement Loans F) Non-occupant Loans on G) Loans On Manufactured Number Average Value Number Average Value Number Average Value Number Average Value Number Average Value Number Average Value
LOANS ORIGINATED 12 $144,908 57 $118,113 92 $130,770 15 $55,336 15 $98,009 0 $0 APPLICATIONS APPROVED, NOT ACCEPTED 1 $98,770 4 $158,362 10 $136,852 5 $19,184 0 $0 1 $18,990 APPLICATIONS DENIED 2 $102,095 13 $129,890 49 $158,484 9 $93,914 4 $111,590 0 $0 APPLICATIONS WITHDRAWN 0 $0 2 $99,245 12 $129,713 1 $123,460 3 $122,510 0 $0 FILES CLOSED FOR INCOMPLETENESS 1 $90,220 1 $66,480 3 $120,930 2 $6,650 2 $90,220 0 $0
Aggregated Statistics For Year 2007(Based on 1 partial tract) A) FHA, FSA/RHS & VA B) Conventional C) Refinancings D) Home Improvement Loans F) Non-occupant Loans on G) Loans On Manufactured Number Average Value Number Average Value Number Average Value Number Average Value Number Average Value Number Average Value
LOANS ORIGINATED 4 $145,542 135 $118,614 94 $113,812 26 $27,067 16 $75,620 0 $0 APPLICATIONS APPROVED, NOT ACCEPTED 0 $0 8 $104,941 16 $138,953 4 $12,582 1 $132,960 0 $0 APPLICATIONS DENIED 0 $0 16 $114,736 50 $137,858 18 $46,166 3 $66,163 3 $13,613 APPLICATIONS WITHDRAWN 0 $0 8 $113,370 22 $148,110 4 $59,120 0 $0 0 $0 FILES CLOSED FOR INCOMPLETENESS 0 $0 0 $0 6 $213,050 0 $0 0 $0 0 $0
Aggregated Statistics For Year 2006(Based on 1 partial tract) A) FHA, FSA/RHS & VA B) Conventional C) Refinancings D) Home Improvement Loans E) Loans on Dwellings For 5+ Families F) Non-occupant Loans on Number Average Value Number Average Value Number Average Value Number Average Value Number Average Value Number Average Value
LOANS ORIGINATED 3 $63,630 145 $133,122 109 $113,398 16 $46,772 1 $5,698,200 22 $96,999 APPLICATIONS APPROVED, NOT ACCEPTED 0 $0 15 $97,566 28 $105,756 2 $9,495 0 $0 7 $80,046 APPLICATIONS DENIED 1 $75,030 13 $131,278 58 $144,534 16 $46,772 0 $0 4 $74,315 APPLICATIONS WITHDRAWN 0 $0 10 $149,863 38 $128,584 3 $15,513 0 $0 2 $78,825 FILES CLOSED FOR INCOMPLETENESS 0 $0 0 $0 8 $103,042 0 $0 0 $0 1 $131,060
Aggregated Statistics For Year 2005(Based on 1 partial tract) A) FHA, FSA/RHS & VA B) Conventional C) Refinancings D) Home Improvement Loans F) Non-occupant Loans on Number Average Value Number Average Value Number Average Value Number Average Value Number Average Value
LOANS ORIGINATED 2 $131,535 145 $115,687 121 $124,701 14 $37,174 14 $107,655 APPLICATIONS APPROVED, NOT ACCEPTED 0 $0 17 $116,311 26 $121,342 2 $28,490 7 $75,026 APPLICATIONS DENIED 1 $50,330 25 $126,614 70 $138,398 10 $59,546 7 $123,190 APPLICATIONS WITHDRAWN 1 $78,830 18 $180,021 47 $131,119 8 $202,880 2 $240,750 FILES CLOSED FOR INCOMPLETENESS 0 $0 0 $0 12 $167,464 3 $149,420 1 $96,870
Aggregated Statistics For Year 2004(Based on 1 partial tract) A) FHA, FSA/RHS & VA B) Conventional C) Refinancings D) Home Improvement Loans E) Loans on Dwellings For 5+ Families F) Non-occupant Loans on Number Average Value Number Average Value Number Average Value Number Average Value Number Average Value Number Average Value
LOANS ORIGINATED 5 $117,952 155 $118,039 138 $120,873 13 $75,976 1 $224,130 16 $85,829 APPLICATIONS APPROVED, NOT ACCEPTED 0 $0 16 $105,061 27 $122,546 0 $0 0 $0 4 $40,600 APPLICATIONS DENIED 2 $122,510 19 $96,619 65 $129,334 7 $30,797 0 $0 4 $59,830 APPLICATIONS WITHDRAWN 1 $102,570 12 $151,319 41 $123,739 2 $80,250 0 $0 4 $105,892 FILES CLOSED FOR INCOMPLETENESS 0 $0 2 $130,585 9 $114,702 2 $36,090 0 $0 0 $0
Aggregated Statistics For Year 2003(Based on 1 partial tract) A) FHA, FSA/RHS & VA B) Conventional C) Refinancings D) Home Improvement Loans E) Loans on Dwellings For 5+ Families F) Non-occupant Loans on Number Average Value Number Average Value Number Average Value Number Average Value Number Average Value Number Average Value
LOANS ORIGINATED 3 $142,457 158 $119,344 396 $115,988 11 $39,628 1 $166,200 21 $119,527 APPLICATIONS APPROVED, NOT ACCEPTED 0 $0 6 $171,263 47 $114,126 3 $7,280 0 $0 0 $0 APPLICATIONS DENIED 0 $0 10 $84,428 72 $117,895 8 $11,396 0 $0 3 $74,077 APPLICATIONS WITHDRAWN 1 $78,830 12 $110,007 49 $116,852 1 $84,520 0 $0 4 $75,028 FILES CLOSED FOR INCOMPLETENESS 0 $0 6 $148,312 9 $138,340 1 $9,500 0 $0 1 $73,130
Aggregated Statistics For Year 2002(Based on 1 partial tract) A) FHA, FSA/RHS & VA B) Conventional C) Refinancings D) Home Improvement Loans E) Loans on Dwellings For 5+ Families F) Non-occupant Loans on Number Average Value Number Average Value Number Average Value Number Average Value Number Average Value Number Average Value
LOANS ORIGINATED 5 $93,830 140 $113,136 292 $125,367 8 $48,198 1 $1,899,400 18 $85,262 APPLICATIONS APPROVED, NOT ACCEPTED 0 $0 9 $108,054 28 $125,869 5 $20,514 0 $0 1 $28,490 APPLICATIONS DENIED 0 $0 10 $105,702 50 $114,306 2 $14,245 0 $0 2 $66,480 APPLICATIONS WITHDRAWN 0 $0 10 $132,673 35 $122,620 3 $14,563 0 $0 1 $155,750 FILES CLOSED FOR INCOMPLETENESS 0 $0 0 $0 8 $160,380 0 $0 0 $0 0 $0
Aggregated Statistics For Year 2001(Based on 1 partial tract) A) FHA, FSA/RHS & VA B) Conventional C) Refinancings D) Home Improvement Loans E) Loans on Dwellings For 5+ Families F) Non-occupant Loans on Number Average Value Number Average Value Number Average Value Number Average Value Number Average Value Number Average Value
LOANS ORIGINATED 7 $112,471 139 $147,894 180 $115,626 14 $24,489 1 $128,210 16 $400,180 APPLICATIONS APPROVED, NOT ACCEPTED 0 $0 10 $147,678 21 $101,980 2 $27,065 0 $0 1 $103,520 APPLICATIONS DENIED 0 $0 5 $117,004 52 $94,605 7 $20,621 0 $0 1 $135,810 APPLICATIONS WITHDRAWN 1 $174,740 9 $122,722 31 $142,118 3 $48,750 0 $0 2 $30,865 FILES CLOSED FOR INCOMPLETENESS 0 $0 1 $66,480 9 $96,342 0 $0 0 $0 0 $0
Aggregated Statistics For Year 2000(Based on 1 partial tract) A) FHA, FSA/RHS & VA B) Conventional C) Refinancings D) Home Improvement Loans F) Non-occupant Loans on Number Average Value Number Average Value Number Average Value Number Average Value Number Average Value
LOANS ORIGINATED 3 $90,537 106 $118,076 59 $83,445 16 $17,272 6 $69,645 APPLICATIONS APPROVED, NOT ACCEPTED 0 $0 2 $81,675 13 $81,236 4 $35,378 0 $0 APPLICATIONS DENIED 1 $108,270 12 $89,747 25 $87,182 5 $12,536 2 $104,465 APPLICATIONS WITHDRAWN 1 $190,890 9 $118,396 20 $88,132 4 $57,458 1 $232,680 FILES CLOSED FOR INCOMPLETENESS 0 $0 0 $0 3 $125,993 0 $0 0 $0
Aggregated Statistics For Year 1999(Based on 1 partial tract) A) FHA, FSA/RHS & VA B) Conventional C) Refinancings D) Home Improvement Loans F) Non-occupant Loans on Number Average Value Number Average Value Number Average Value Number Average Value Number Average Value
LOANS ORIGINATED 3 $117,237 116 $121,781 159 $93,696 33 $13,330 18 $77,637 APPLICATIONS APPROVED, NOT ACCEPTED 0 $0 5 $129,618 24 $98,987 8 $22,392 2 $239,635 APPLICATIONS DENIED 0 $0 3 $152,567 32 $100,414 6 $19,227 2 $82,065 APPLICATIONS WITHDRAWN 0 $0 9 $130,472 32 $99,505 7 $90,976 6 $92,695 FILES CLOSED FOR INCOMPLETENESS 0 $0 4 $65,418 4 $142,795 1 $37,520 0 $0
Detailed HMDA statistics for the following Tracts:
8122.00
Private Mortgage Insurance Companies Aggregated Statistics For Year 2009(Based on 1 partial tract) A) Conventional B) Refinancings C) Non-occupant Loans on Number Average Value Number Average Value Number Average Value
LOANS ORIGINATED 12 $143,326 4 $126,785 1 $90,220 APPLICATIONS APPROVED, NOT ACCEPTED 1 $115,860 2 $143,880 0 $0 APPLICATIONS DENIED 3 $102,567 0 $0 0 $0 APPLICATIONS WITHDRAWN 1 $180,440 1 $126,310 0 $0 FILES CLOSED FOR INCOMPLETENESS 0 $0 0 $0 0 $0
Aggregated Statistics For Year 2007(Based on 1 partial tract) A) Conventional B) Refinancings C) Non-occupant Loans on Number Average Value Number Average Value Number Average Value
LOANS ORIGINATED 33 $134,167 5 $162,968 2 $93,070 APPLICATIONS APPROVED, NOT ACCEPTED 5 $105,606 4 $160,025 1 $44,640 APPLICATIONS DENIED 0 $0 0 $0 0 $0 APPLICATIONS WITHDRAWN 1 $107,320 4 $204,185 0 $0 FILES CLOSED FOR INCOMPLETENESS 0 $0 0 $0 0 $0
Aggregated Statistics For Year 2006(Based on 1 partial tract) A) Conventional B) Refinancings Number Average Value Number Average Value
LOANS ORIGINATED 28 $139,979 6 $169,522 APPLICATIONS APPROVED, NOT ACCEPTED 1 $118,710 6 $180,443 APPLICATIONS DENIED 0 $0 0 $0 APPLICATIONS WITHDRAWN 1 $189,940 0 $0 FILES CLOSED FOR INCOMPLETENESS 0 $0 0 $0
Aggregated Statistics For Year 2005(Based on 1 partial tract) A) Conventional B) Refinancings C) Non-occupant Loans on Number Average Value Number Average Value Number Average Value
LOANS ORIGINATED 20 $156,606 7 $152,359 2 $99,245 APPLICATIONS APPROVED, NOT ACCEPTED 3 $121,560 2 $161,925 0 $0 APPLICATIONS DENIED 0 $0 0 $0 0 $0 APPLICATIONS WITHDRAWN 0 $0 0 $0 0 $0 FILES CLOSED FOR INCOMPLETENESS 0 $0 0 $0 0 $0
Aggregated Statistics For Year 2004(Based on 1 partial tract) A) Conventional B) Refinancings C) Non-occupant Loans on Number Average Value Number Average Value Number Average Value
LOANS ORIGINATED 19 $117,513 5 $137,326 3 $69,010 APPLICATIONS APPROVED, NOT ACCEPTED 4 $115,625 5 $104,088 1 $38,940 APPLICATIONS DENIED 0 $0 0 $0 0 $0 APPLICATIONS WITHDRAWN 2 $111,590 1 $88,320 1 $94,020 FILES CLOSED FOR INCOMPLETENESS 0 $0 1 $235,530 0 $0
Aggregated Statistics For Year 2002(Based on 1 partial tract) A) Conventional B) Refinancings C) Non-occupant Loans on Number Average Value Number Average Value Number Average Value
LOANS ORIGINATED 25 $121,448 23 $142,331 1 $102,570 APPLICATIONS APPROVED, NOT ACCEPTED 4 $104,468 4 $135,570 0 $0 APPLICATIONS DENIED 0 $0 0 $0 0 $0 APPLICATIONS WITHDRAWN 3 $94,653 2 $143,405 0 $0 FILES CLOSED FOR INCOMPLETENESS 0 $0 0 $0 0 $0
Aggregated Statistics For Year 2001(Based on 1 partial tract) A) Conventional B) Refinancings C) Non-occupant Loans on Number Average Value Number Average Value Number Average Value
LOANS ORIGINATED 21 $138,882 12 $147,282 3 $84,523 APPLICATIONS APPROVED, NOT ACCEPTED 2 $139,605 1 $77,880 0 $0 APPLICATIONS DENIED 0 $0 0 $0 0 $0 APPLICATIONS WITHDRAWN 1 $101,620 0 $0 0 $0 FILES CLOSED FOR INCOMPLETENESS 0 $0 0 $0 0 $0
Aggregated Statistics For Year 2000(Based on 1 partial tract) A) Conventional B) Refinancings C) Non-occupant Loans on Number Average Value Number Average Value Number Average Value
LOANS ORIGINATED 21 $124,320 1 $151,950 1 $60,780 APPLICATIONS APPROVED, NOT ACCEPTED 2 $66,480 0 $0 1 $66,480 APPLICATIONS DENIED 1 $104,470 1 $91,170 0 $0 APPLICATIONS WITHDRAWN 0 $0 0 $0 0 $0 FILES CLOSED FOR INCOMPLETENESS 0 $0 0 $0 0 $0
Aggregated Statistics For Year 1999(Based on 1 partial tract) A) Conventional B) Refinancings Number Average Value Number Average Value
LOANS ORIGINATED 14 $126,951 4 $84,645 APPLICATIONS APPROVED, NOT ACCEPTED 3 $122,863 0 $0 APPLICATIONS DENIED 0 $0 0 $0 APPLICATIONS WITHDRAWN 0 $0 0 $0 FILES CLOSED FOR INCOMPLETENESS 0 $0 0 $0
Detailed PMIC statistics for the following Tracts:
8122.00
Fire-safe hotels and motels in Canfield, Ohio:
Hampton Inn & Suites Youngstown - Canfield, 6690 Ironwood Blvd, Canfield, Ohio 44406 Phone: (330) 702-1900, Fax: (330) 702-1915
Courtyard Youngstown Canfield, 4173 Westford Pl, Canfield, Ohio 44406 Phone: (330) 533-6880
All 2 fire-safe hotels and motels in Canfield, Ohio
Most common first names in Canfield, OH among deceased individuals Name Count Lived (average)
Mary 152 81.2 years John 151 76.2 years William 125 75.3 years Robert 90 70.9 years Helen 84 81.8 years Joseph 74 75.7 years George 71 78.7 years James 70 73.6 years Margaret 65 80.1 years Charles 65 77.2 years
Most common last names in Canfield, OH among deceased individuals Last name Count Lived (average)
Miller 36 81.0 years Jones 29 78.8 years Williams 26 75.9 years Smith 23 78.9 years Davis 23 79.5 years Wilson 23 79.7 years Johnson 22 80.6 years Moore 19 80.5 years Lewis 19 74.5 years Brown 18 81.1 years
Canfield compared to Ohio state average:
Median household income above state average. Unemployed percentage significantly below state average. Black race population percentage significantly below state average. Median age above state average. Renting percentage below state average. Length of stay since moving in above state average. Percentage of population with a bachelor's degree or higher above state average.
#42 on the list of "Top 101 cities with the lowest number of assaults per 100,000 residents (population 5,000+)"
#85 on the list of "Top 101 cities with largest percentage of females in occupations: health diagnosing and treating practitioners and other technical occupations (population 5,000+)"
#28 (44406) on the list of "Top 101 zip codes with the largest percentage of Slovak first ancestries (pop 5,000+)"
#6 on the list of "Top 101 counties with the lowest percentage of residents relocating to foreign countries in 2011"
#25 on the list of "Top 101 counties with the lowest percentage of residents relocating from foreign countries between 2010 and 2011"
#27 on the list of "Top 101 counties with the highest number of deaths per 1000 residents 2007-2013 (pop. 50,000+)"
#34 on the list of "Top 101 counties with the highest number of infant deaths per 1000 residents 2007-2013 (pop. 50,000+)"
#40 on the list of "Top 101 counties with the most Orthodox congregations (pop. 50,000+)"
Top Patent Applicants
John V. Caputo (5)
Maria S. French (5)
Dale J. Smutny (5)
David M. Neill (5)
Francis D. Martauz (4)
Mark A. Scheel (4)
Ernest J. Zavoral, Sr. (3)
Jill Dudik (3)
Gary L. Trebilcock (3)
Michael Garvey (2)
Total of 107 patent applications in 2008-2024.
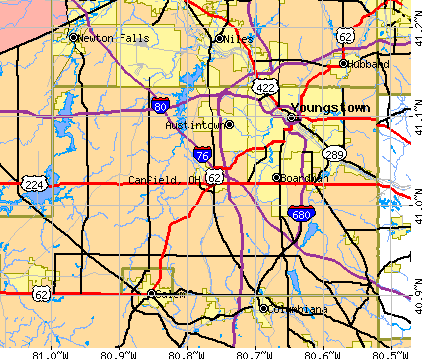


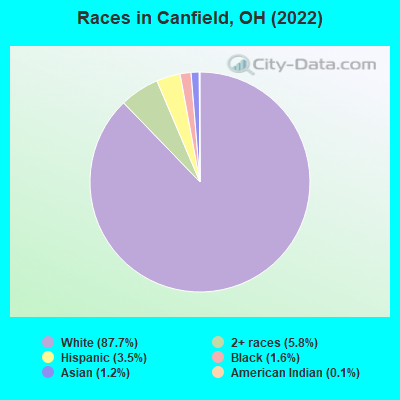
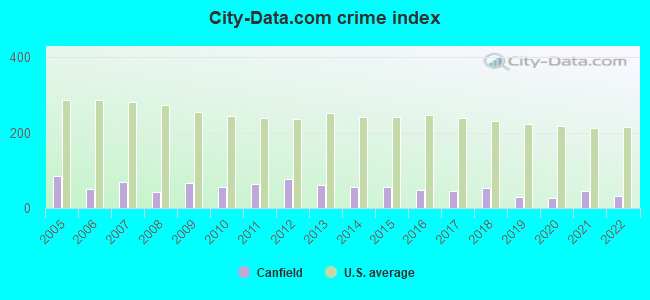
 Recent articles from our blog. Our writers, many of them Ph.D. graduates or candidates, create easy-to-read articles on a wide variety of topics.

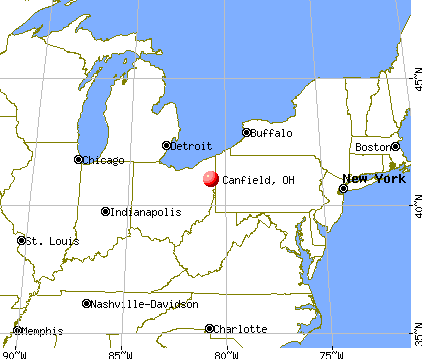
 (7.6 miles
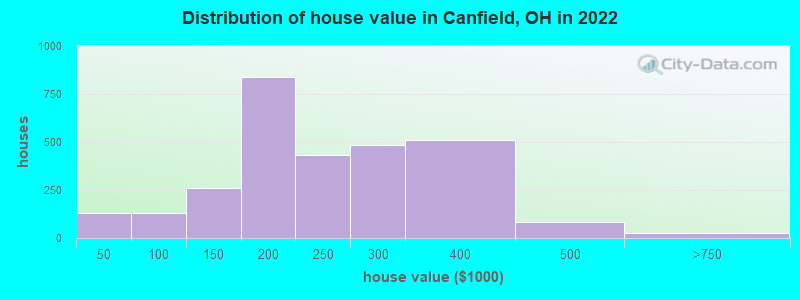

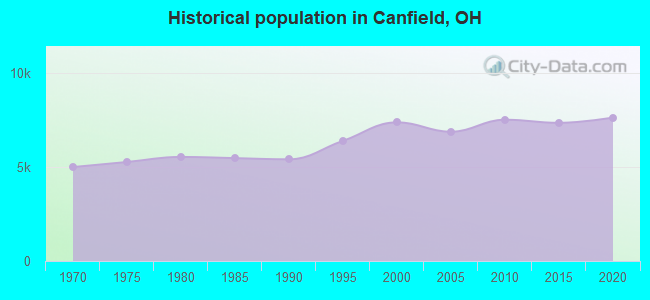
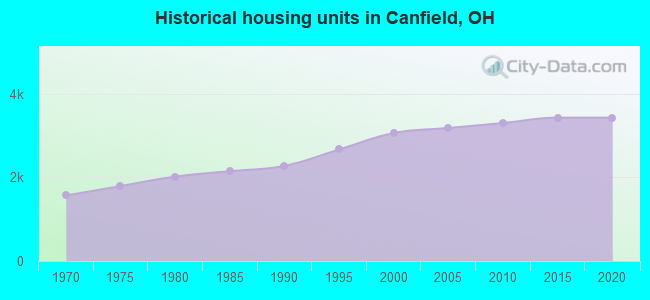
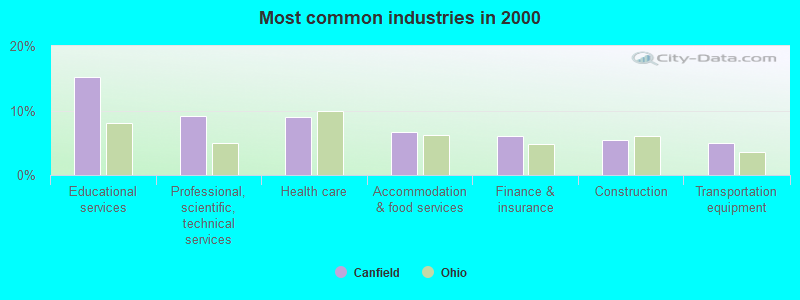
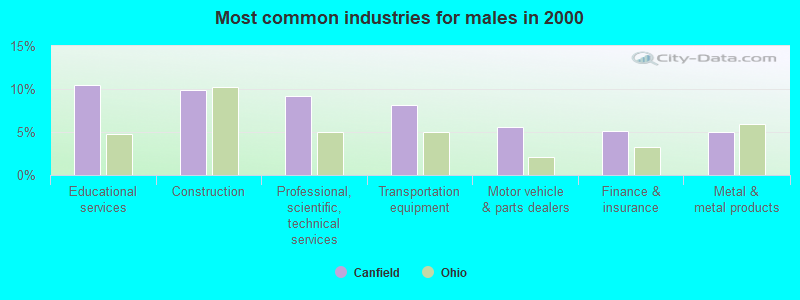
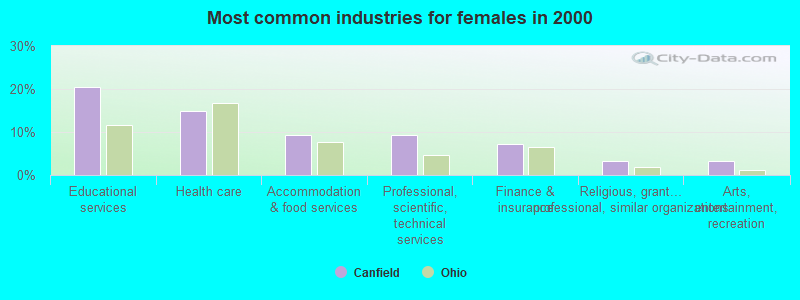
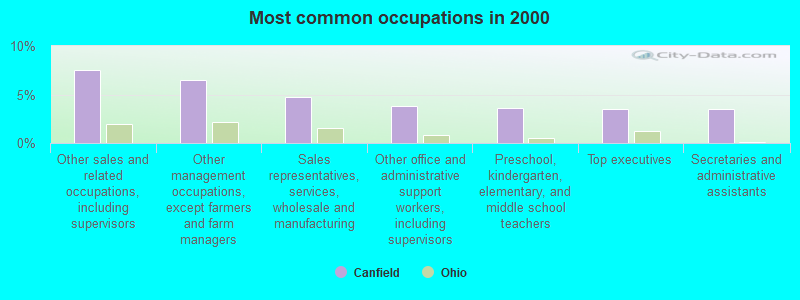
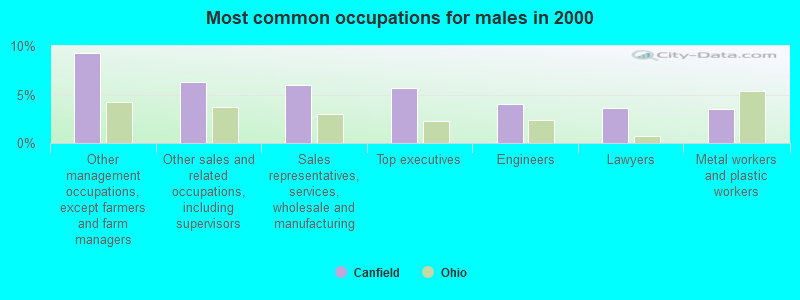
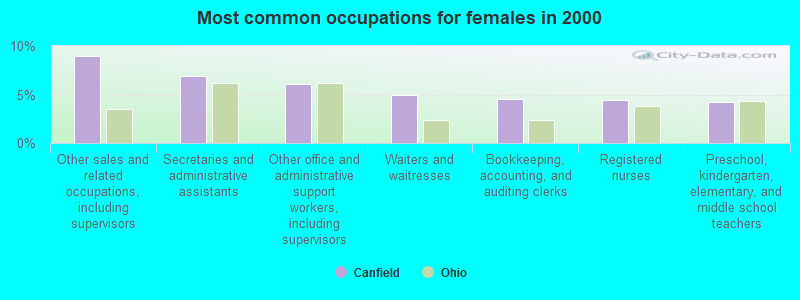


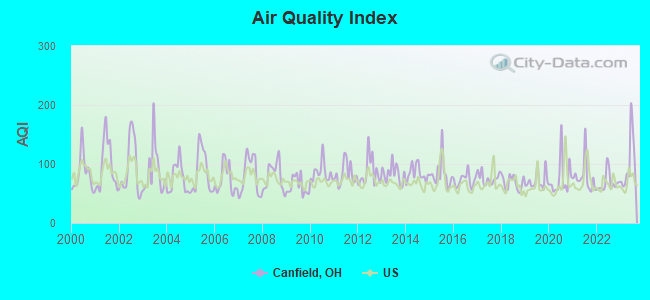
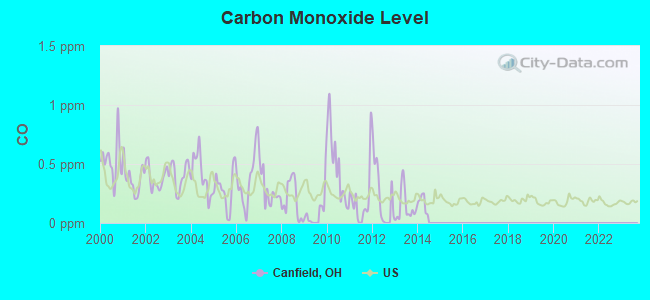
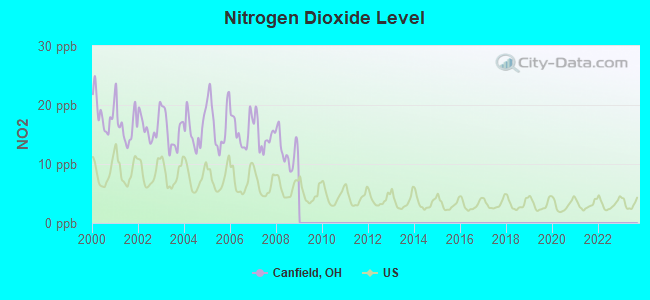
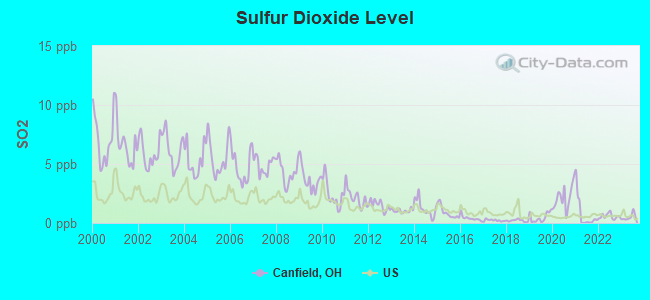
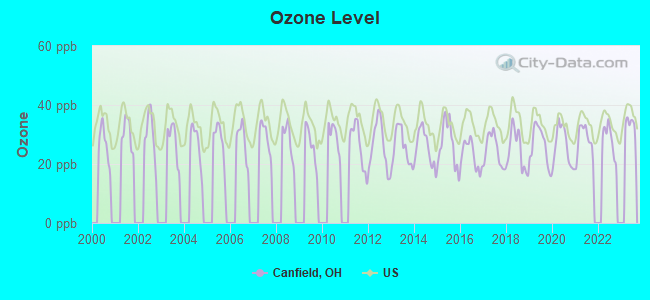
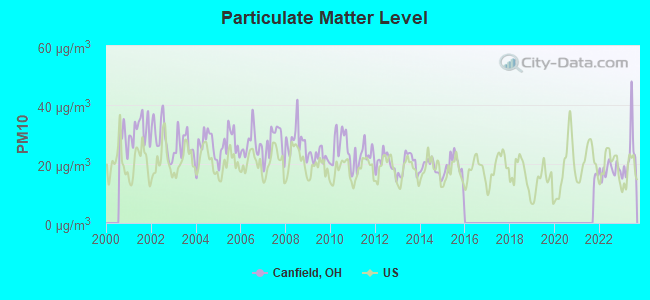
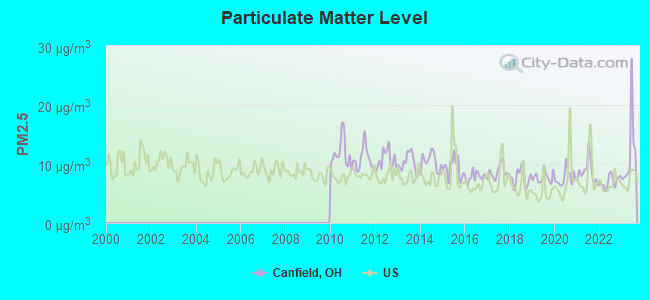

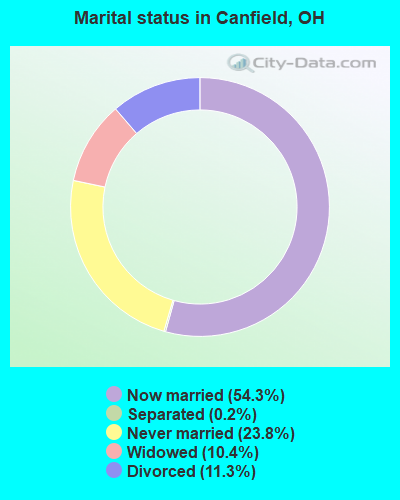
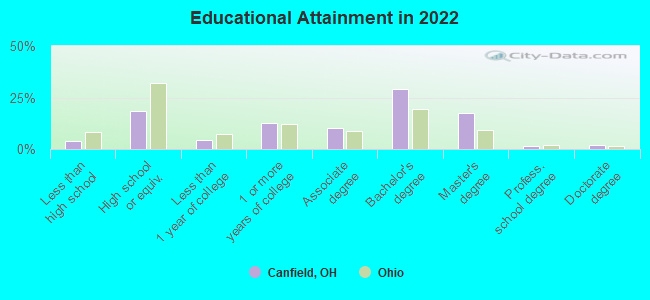
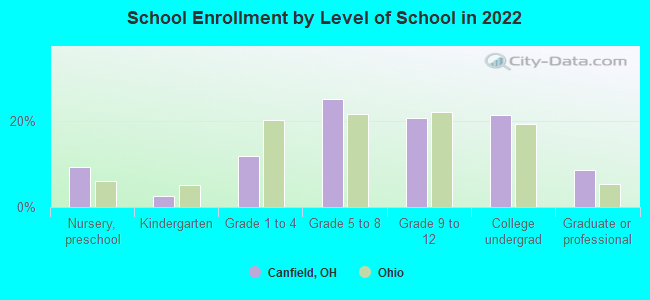
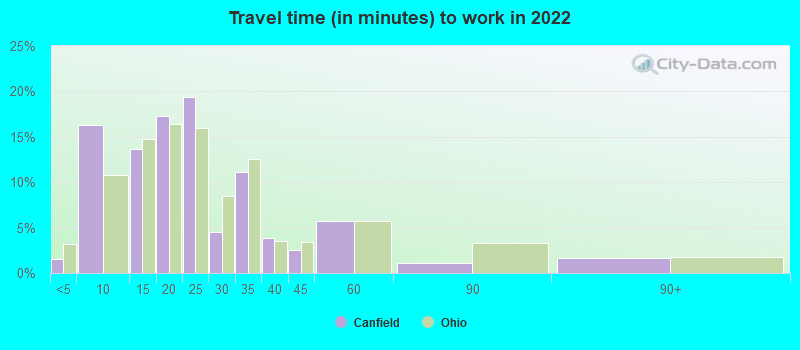
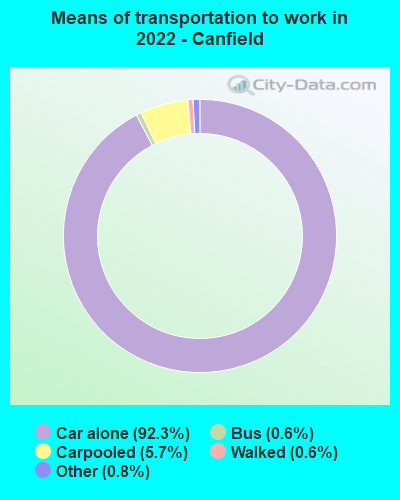
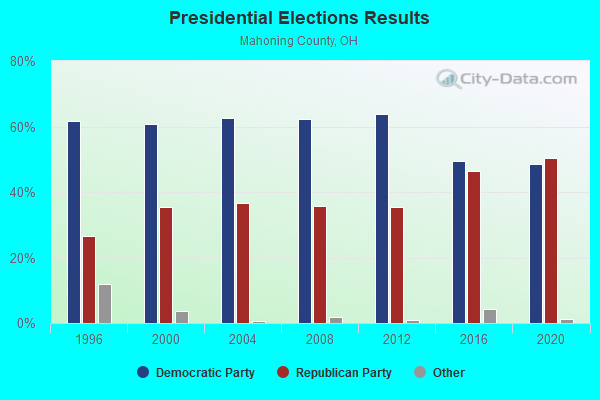
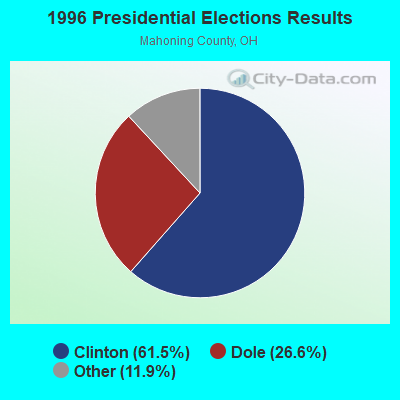
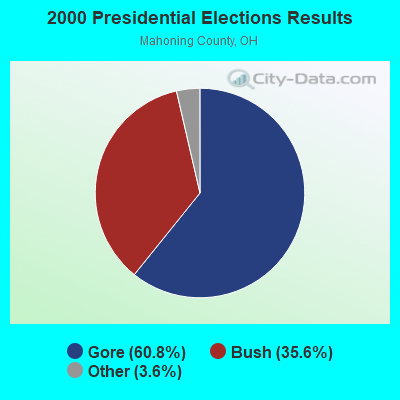
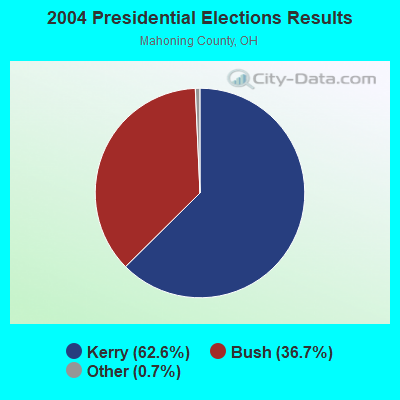
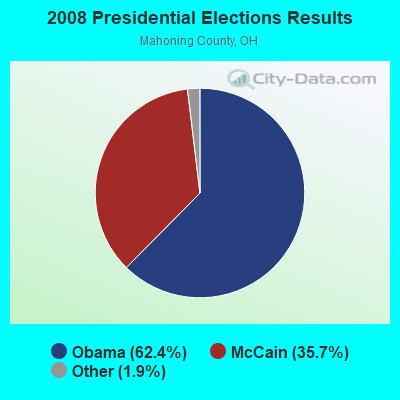
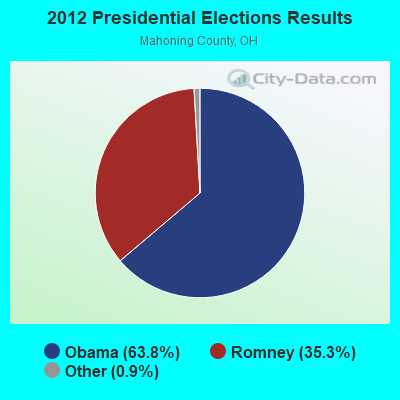
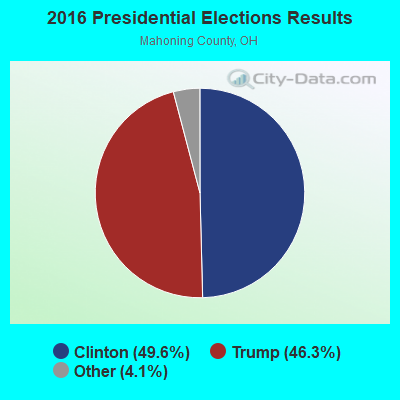
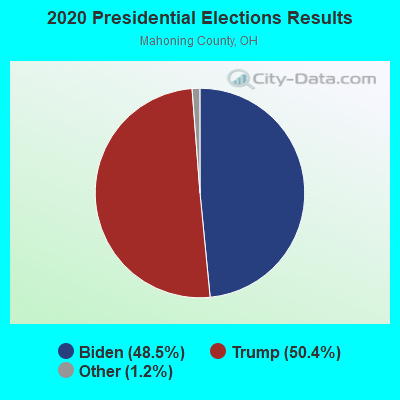
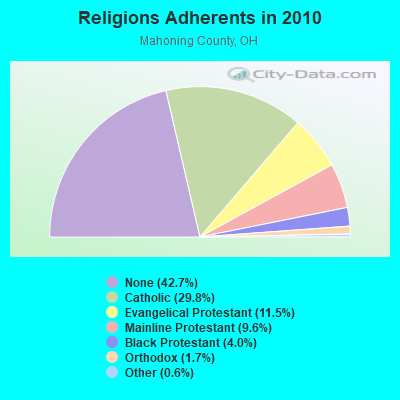
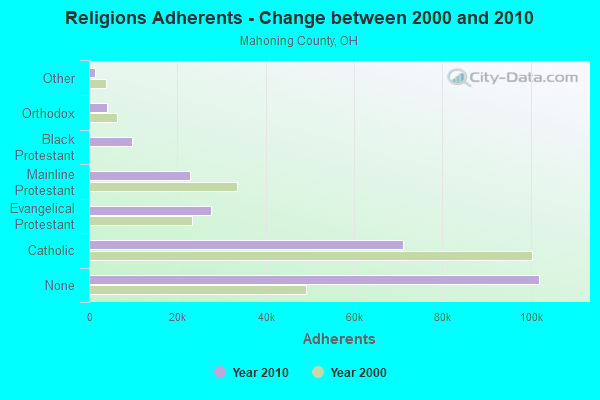
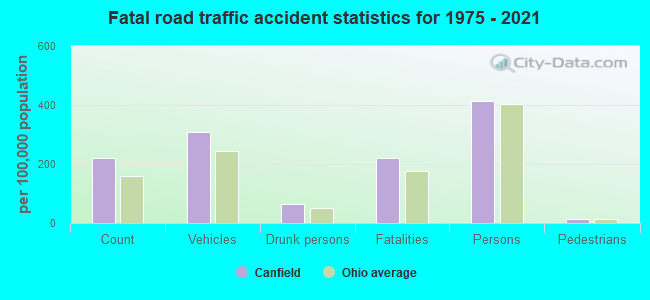
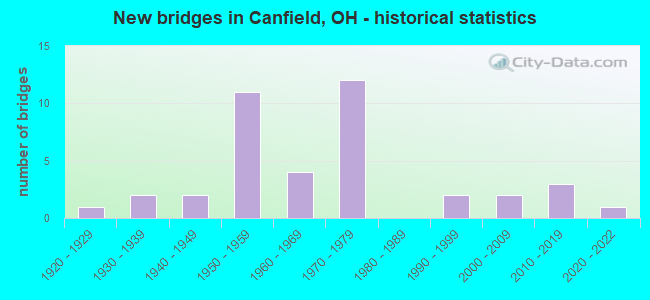
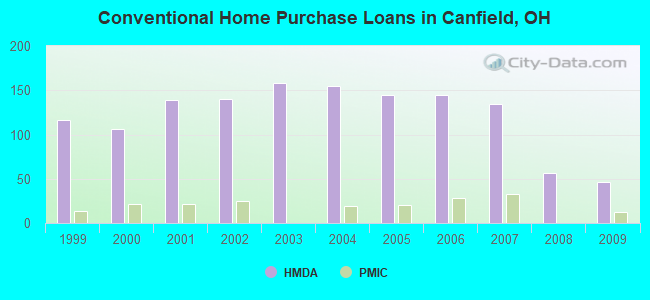
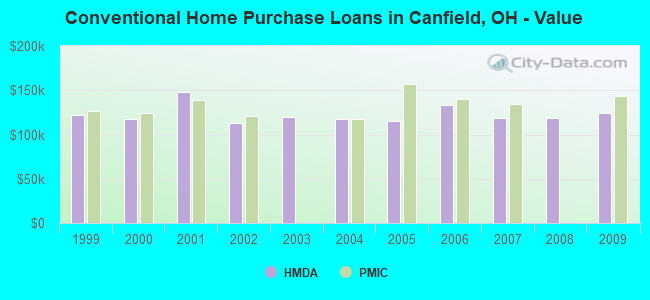
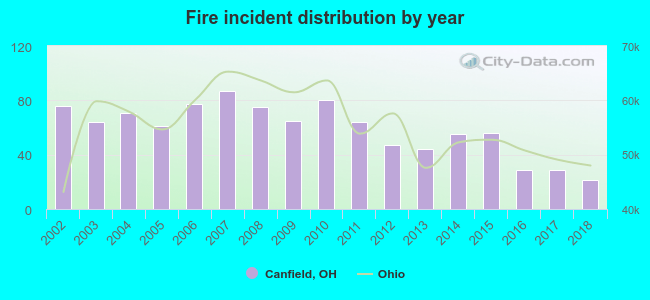 According to the data from the years 2002 - 2018 the average number of fire incidents per year is 59. The highest number of reported fires - 87 took place in 2007, and the least - 21 in 2018. The data has a decreasing trend.
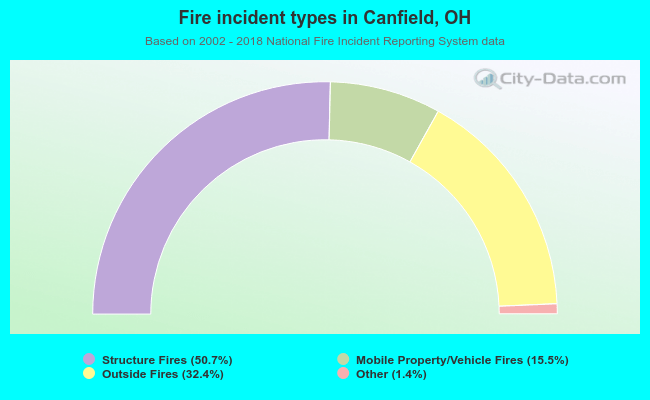 When looking into fire subcategories, the most incidents belonged to: Structure Fires (50.7%), and Outside Fires (32.4%).