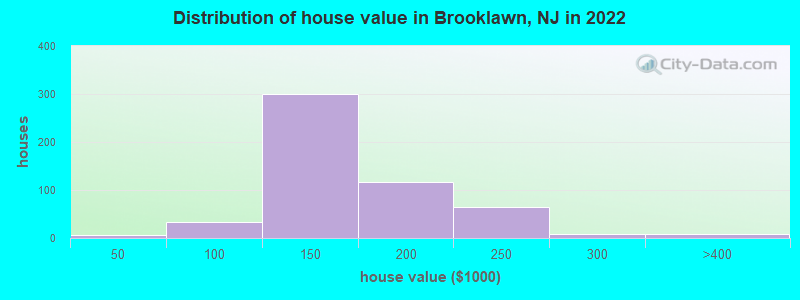
Estimated median house or condo value in 2022: $159,879 (it was $79,800 in 2000)
Brooklawn:
$159,879
NJ:
$428,900
Mean prices in 2022:all housing units: $203,046; detached houses: $222,178; townhouses or other attached units: $192,346; in 2-unit structures: $255,404
Median gross rent in 2022: $1,447.
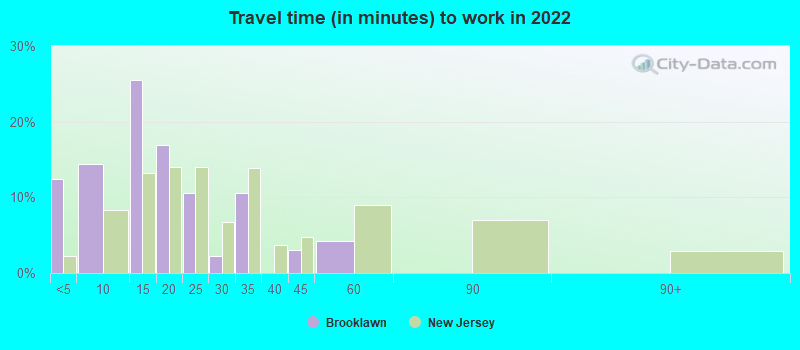
March 2022 cost of living index in Brooklawn: 102.3 (near average, U.S. average is 100)
Percentage of residents living in poverty in 2022: 8.9%
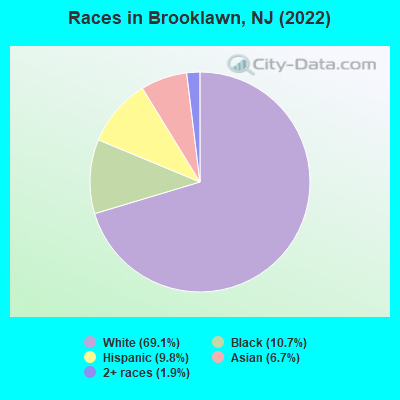
(7.2% for White Non-Hispanic residents, 3.3% for Black residents, 18.5% for Hispanic or Latino residents, 4.2% for two or more races residents)
According to our research of New Jersey and other state lists, there was 1 registered sex offender living in Brooklawn, New Jersey as of June 10, 2024. The ratio of all residents to sex offenders in Brooklawn is 1,950 to 1. The ratio of registered sex offenders to all residents in this city is near the state average.
Crime rates in Brooklawn by year
Type
2009
2010
2011
2012
2013
2014
2015
2016
2017
2018
2019
2020
2021
2022
Murders (per 100,000)
0 (0.0)
0 (0.0)
0 (0.0)
0 (0.0)
0 (0.0)
0 (0.0)
0 (0.0)
0 (0.0)
0 (0.0)
0 (0.0)
0 (0.0)
0 (0.0)
0 (0.0)
0 (0.0)
Rapes (per 100,000)
2 (88.8)
2 (102.3)
4 (203.9)
1 (50.9)
2 (102.7)
2 (102.8)
0 (0.0)
4 (208.4)
1 (51.6)
3 (157.6)
1 (52.7)
1 (52.9)
0 (0.0)
1 (55.5)
Robberies (per 100,000)
6 (266.3)
9 (460.4)
13 (662.6)
7 (356.4)
10 (513.3)
10 (514.1)
16 (833.3)
8 (416.9)
10 (516.3)
6 (315.1)
5 (263.3)
7 (370.0)
0 (0.0)
3 (166.5)
Assaults (per 100,000)
7 (310.7)
5 (255.8)
4 (203.9)
7 (356.4)
6 (308.0)
4 (205.7)
7 (364.6)
8 (416.9)
9 (464.6)
7 (367.6)
10 (526.6)
4 (211.4)
4 (203.1)
13 (721.4)
Burglaries (per 100,000)
28 (1,243)
31 (1,586)
28 (1,427)
30 (1,527)
23 (1,181)
27 (1,388)
26 (1,354)
34 (1,772)
14 (722.8)
8 (420.2)
13 (684.6)
13 (687.1)
4 (203.1)
18 (998.9)
Thefts (per 100,000)
265 (11,762)
260 (13,299)
199 (10,143)
141 (7,179)
140 (7,187)
117 (6,015)
161 (8,385)
167 (8,702)
178 (9,189)
116 (6,092)
134 (7,056)
130 (6,871)
41 (2,082)
149 (8,269)
Auto thefts (per 100,000)
7 (310.7)
10 (511.5)
9 (458.7)
13 (661.9)
6 (308.0)
2 (102.8)
0 (0.0)
8 (416.9)
5 (258.1)
8 (420.2)
2 (105.3)
7 (370.0)
2 (101.6)
17 (943.4)
Arson (per 100,000)
0 (0.0)
1 (51.2)
0 (0.0)
0 (0.0)
0 (0.0)
0 (0.0)
0 (0.0)
0 (0.0)
0 (0.0)
0 (0.0)
0 (0.0)
0 (0.0)
0 (0.0)
0 (0.0)
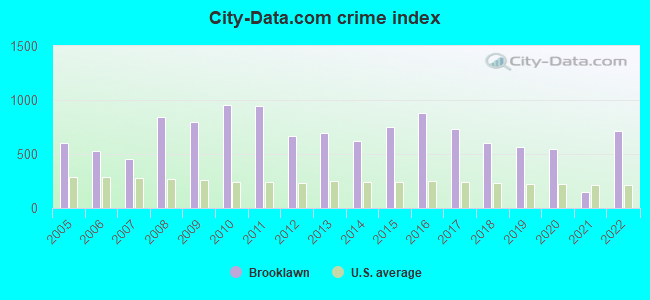
City-Data.com crime index
795.4
955.0
945.0
666.0
692.5
623.7
753.1
880.7
727.9
600.8
565.0
548.1
146.3
714.8
The City-Data.com crime index weighs serious crimes and violent crimes more heavily. Higher means more crime, U.S. average is 246.1. It adjusts for the number of visitors and daily workers commuting into cities.
Latest news from Brooklawn, NJ collected exclusively by city-data.com from local newspapers, TV, and radio stations
Ancestries: Italian (14.1%), Irish (11.8%), Polish (6.5%), American (3.8%), German (3.8%), Scottish (3.2%).
Current Local Time: EST time zone
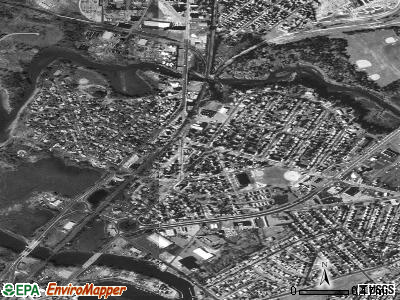
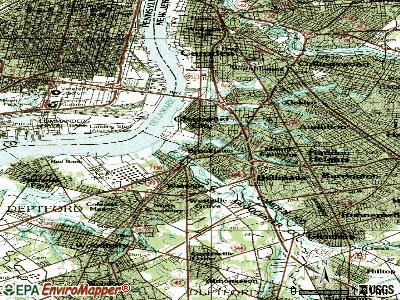
Land area: 0.47 square miles.
Population density: 3,839 people per square mile (average).
140 residents are foreign born (4.6% Asia, 1.5% Europe, 1.0% Latin America).
This borough:
7.4%
New Jersey:
23.2%
Median real estate property taxes paid for housing units with mortgages in 2022: $4,375 (2.6%) Median real estate property taxes paid for housing units with no mortgage in 2022: $5,080 (3.4%)
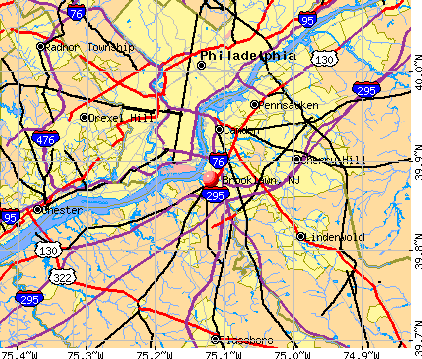
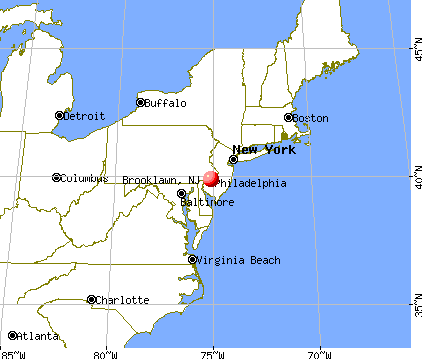
Nearest city with pop. 50,000+: Camden, NJ (4.1 miles , pop. 79,904).
Nearest city with pop. 200,000+: Philadelphia, PA (8.3 miles , pop. 1,517,550).
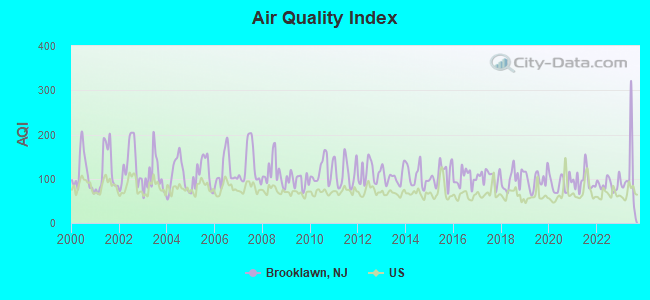
Air Quality Index (AQI) level in 2023 was 109. This is significantly worse than average.
City:
109
U.S.:
73
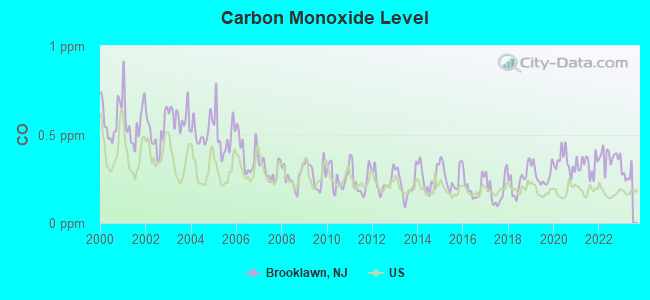
Carbon Monoxide (CO) [ppm] level in 2022 was 0.375. This is significantly worse than average.Closest monitor was 2.5 miles away from the city center.
City:
0.375
U.S.:
0.251
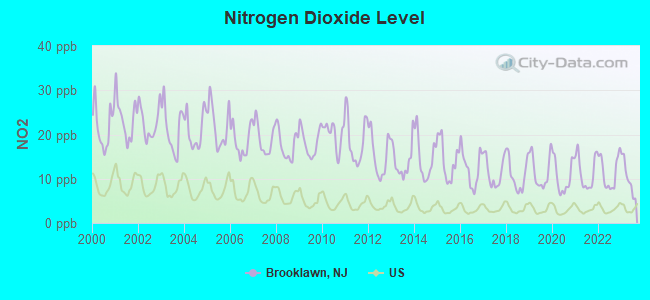
Nitrogen Dioxide (NO2) [ppb] level in 2023 was 10.2. This is significantly worse than average.Closest monitor was 2.5 miles away from the city center.
City:
10.2
U.S.:
5.1
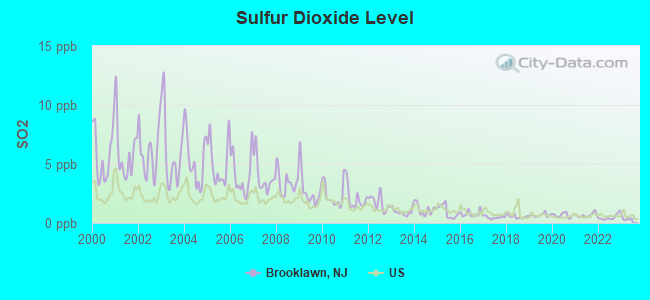
Sulfur Dioxide (SO2) [ppb] level in 2022 was 0.483. This is significantly better than average.Closest monitor was 3.2 miles away from the city center.
City:
0.483
U.S.:
1.515
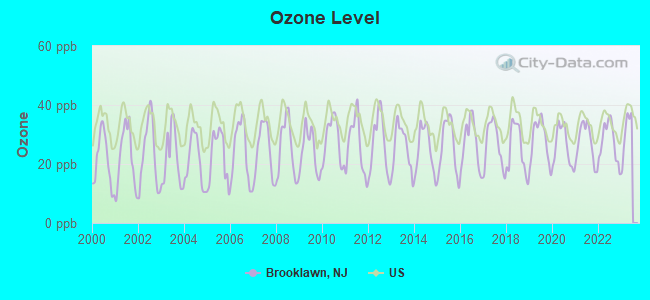
Ozone [ppb] level in 2022 was 27.6. This is better than average.Closest monitor was 2.5 miles away from the city center.
City:
27.6
U.S.:
33.3
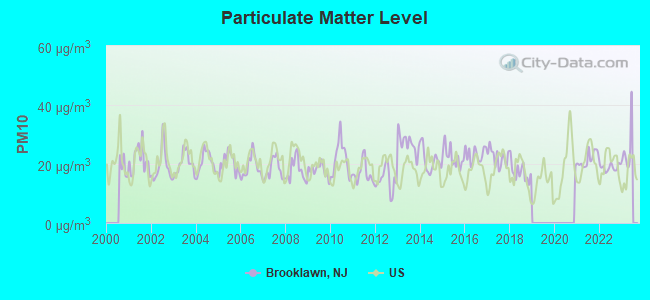
Particulate Matter (PM10) [µg/m3] level in 2022 was 18.9. This is about average.Closest monitor was 2.3 miles away from the city center.
City:
18.9
U.S.:
19.2
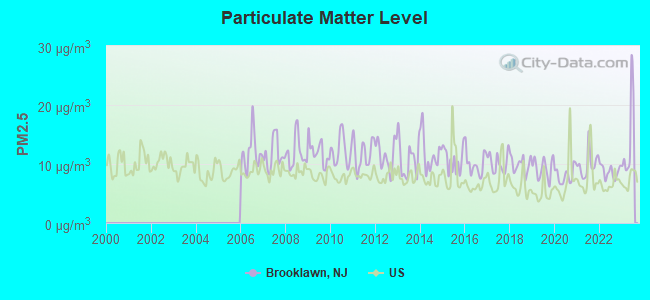
Particulate Matter (PM2.5) [µg/m3] level in 2023 was 14.2. This is significantly worse than average.Closest monitor was 3.2 miles away from the city center.
City:
14.2
U.S.:
8.1
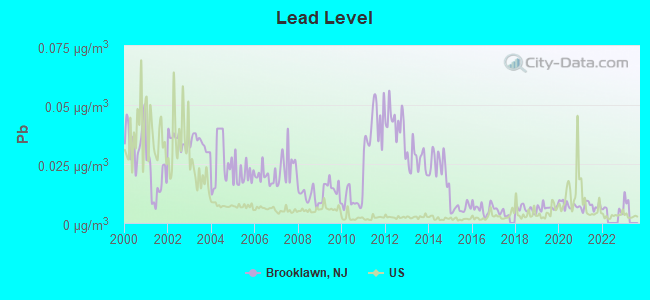
Lead (Pb) [µg/m3] level in 2021 was 0.00716. This is better than average.Closest monitor was 2.5 miles away from the city center.
City:
0.00716
U.S.:
0.00931
Tornado activity:
Brooklawn-area historical tornado activity is slightly above New Jersey state average. It is 7% smaller than the overall U.S. average.
On 3/22/1955, a category F3 (max. wind speeds 158-206 mph) tornado 22.0 miles away from the Brooklawn borough center killed one personand causedbetween $50,000 and $500,000 in damages.
On 4/28/1961, a category F3 tornado 28.0 miles away from the borough center causedbetween $5000 and $50,000 in damages.
Earthquake activity:
Brooklawn-area historical earthquake activity is significantly above New Jersey state average. It is 66% smaller than the overall U.S. average.
On 8/23/2011 at 17:51:04, a magnitude 5.8 (5.8 MW, Depth: 3.7 mi, Class: Moderate, Intensity: VI - VII) earthquake occurred 203.8 miles away from Brooklawn center On 1/16/1994 at 01:49:16, a magnitude 4.6 (4.6 MB, 4.6 LG, Depth: 3.1 mi, Class: Light, Intensity: IV - V) earthquake occurred 57.7 miles away from Brooklawn center On 1/16/1994 at 00:42:43, a magnitude 4.2 (4.2 MB, 4.0 LG, Depth: 3.1 mi) earthquake occurred 56.2 miles away from the city center On 10/7/1983 at 10:18:46, a magnitude 5.3 (5.1 MB, 5.3 LG, 5.1 ML) earthquake occurred 284.6 miles away from the city center On 11/30/2017 at 21:47:31, a magnitude 4.1 (4.1 MW, Depth: 6.1 mi) earthquake occurred 50.0 miles away from Brooklawn center On 9/25/1998 at 19:52:52, a magnitude 5.2 (4.8 MB, 4.3 MS, 5.2 LG, 4.5 MW, Depth: 3.1 mi) earthquake occurred 298.3 miles away from Brooklawn center Magnitude types: regional Lg-wave magnitude (LG), body-wave magnitude (MB), local magnitude (ML), surface-wave magnitude (MS), moment magnitude (MW)
Natural disasters:
The number of natural disasters in Camden County (21) is greater than the US average (15). Major Disasters (Presidential) Declared: 12 Emergencies Declared: 9
Causes of natural disasters: Hurricanes: 6, Snowstorms: 4, Floods: 3, Storms: 3, Blizzards: 2, Water Shortages: 2, Winter Storms: 2, Heavy Rain: 1, Other: 3 (Note: some incidents may be assigned to more than one category).
Hospitals and medical centers near Brooklawn:
RCG WOODBURY DIALYSIS CTR (Dialysis Facility, about 3 miles away; WOODBURY, NJ)
INSPIRA MEDICAL CENTER WOODBURY Acute Care Hospitals (about 3 miles away; WOODBURY, NJ)
UNDERWOOD HOSPITAL TCU (Nursing Home, about 3 miles away; WOODBURY, NJ)
PRO CARE HEALTH SERVICES INC (Home Health Center, about 3 miles away; PHILADELPHIA, PA)
GREENBRIAR HEALTH CARE CENTER (Nursing Home, about 4 miles away; WOODBURY, NJ)
GREENBRIAR NSG AND CONV CTR (Nursing Home, about 4 miles away; WOODBURY, NJ)
DEPTFORD CENTER FOR REHABILITATION AND HEALTHCARE (Nursing Home, about 4 miles away; DEPTFORD, NJ)
Amtrak stations near Brooklawn:
7 miles: PHILADELPHIA (30TH & MARKET STS.) . Services: ticket office, fully wheelchair accessible, enclosed waiting area, public restrooms, public payphones, snack bar, ATM, paid short-term parking, paid long-term parking, car rental agency, taxi stand, public transit connection.
9 miles: NORTH PHILADELPHIA (PHILADELPHIA, 2900 N. BROAD ST.) . Services: ticket office, fully wheelchair accessible, enclosed waiting area, public restrooms, public payphones, paid short-term parking, paid long-term parking, call for taxi service, public transit connection.
13 miles: ARDMORE (STATION RD. & LANCASTER AVE.) . Services: enclosed waiting area, public restrooms, public payphones, paid short-term parking, call for car rental service, call for taxi service, public transit connection.
Colleges/universities with over 2000 students nearest to Brooklawn:
Notable locations in Brooklawn: Brooklawn Emergency Medical Services (A), Brooklawn Fire Company Substation (B), Brooklawn Fire Company (C). Display/hide their locations on the map
Camden County has a predicted average indoor radon screening level between 2 and 4 pCi/L (pico curies per liter) - Moderate Potential
Drinking water stations with addresses in Brooklawn that have no violations reported:
BROOKLAWN WATER DEPARTME (Population served: 2,300,Primary Water Source Type: Groundwater)
Average household size:
This borough:
2.6 people
New Jersey:
2.7 people
Percentage of family households:
This borough:
68.0%
Whole state:
69.3%
Percentage of households with unmarried partners:
This borough:
9.4%
Whole state:
5.9%
Likely homosexual households (counted as self-reported same-sex unmarried-partner households)
Lesbian couples: 0.5% of all households
Gay men: 0.3% of all households
Banks with branches in Brooklawn (2011 data):
Wells Fargo Bank, National Association: Brooklawn Branch at 700 Crescent Boulevard, branch established on 1965/03/22. Info updated 2011/04/05: Bank assets: $1,161,490.0 mil, Deposits: $905,653.0 mil, headquarters in Sioux Falls, SD, positive income, 6395 total offices, Holding Company: Wells Fargo & Company
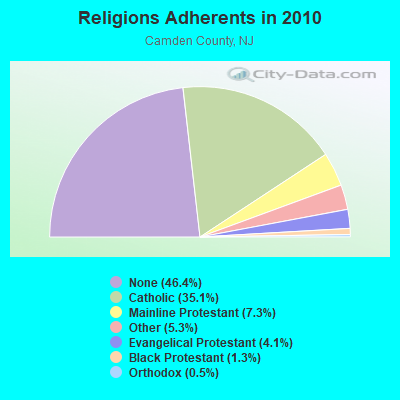
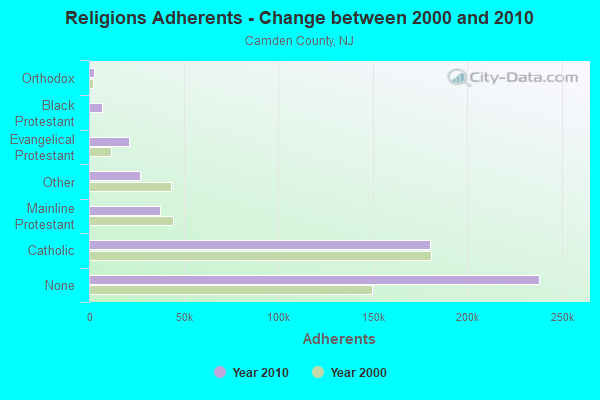
Religion statistics for Brooklawn, NJ (based on Camden County data)
Religion
Adherents
Congregations
Catholic
180,343
55
Mainline Protestant
37,518
115
Other
27,141
39
Evangelical Protestant
21,048
130
Black Protestant
6,925
32
Orthodox
2,500
1
None
238,182
-
Source: Clifford Grammich, Kirk Hadaway, Richard Houseal, Dale E.Jones, Alexei Krindatch, Richie Stanley and Richard H.Taylor. 2012. 2010 U.S.Religion Census: Religious Congregations & Membership Study. Association of Statisticians of American Religious Bodies. Jones, Dale E., et al. 2002. Congregations and Membership in the United States 2000. Nashville, TN: Glenmary Research Center. Graphs represent county-level data
Call Sign: KA2YNT, Licensee ID: L01268276, Grant Date: 03/14/2017, Expiration Date: 04/25/2027, Certifier: Todd D Cecilio, Registrant: Todd D Cecilio, 217 4th Ave, Brooklawn, NJ 08030
Call Sign: N2CX, Licensee ID: L01422015, Grant Date: 07/18/2018, Expiration Date: 08/19/2028, Cancellation Date: 05/14/2019, Registrant: Joseph H Everhart, 214 New Jersey Rd, Brooklawn, NJ 08030
Call Sign: WA2DFH, Licensee ID: L00968571, Grant Date: 05/12/2015, Expiration Date: 05/31/2025, Registrant: John D Wentzell, 213 S Hannevig Ave., Brooklawn, NJ 08030
Call Sign: WQ2RP, Previous Call Sign: KC2CYY, Licensee ID: L01359762, Grant Date: 03/27/2018, Expiration Date: 03/27/2028, Certifier: Joseph H Everhart, Registrant: New Jersey Qrp Club, 214 New Jersey Rd, Brooklawn, NJ 08030
Call Sign: KC2OXD, Licensee ID: L01088330, Grant Date: 10/28/2015, Expiration Date: 11/28/2025, Certifier: John D Mckinney Iii, Registrant: John D Mckinney Iii, 113 Lake Dr, Brooklawn, NJ 08030
Call Sign: KD2EPL, Licensee ID: L01805348, Grant Date: 08/20/2013, Expiration Date: 08/20/2023, Certifier: John R Meeser, Registrant: John R Meeser, 206 6th Street, Brooklawn, NJ 08030
Home Mortgage Disclosure Act Aggregated Statistics For Year 2009 (Based on 1 full tract)
A) FHA, FSA/RHS & VA Home Purchase Loans
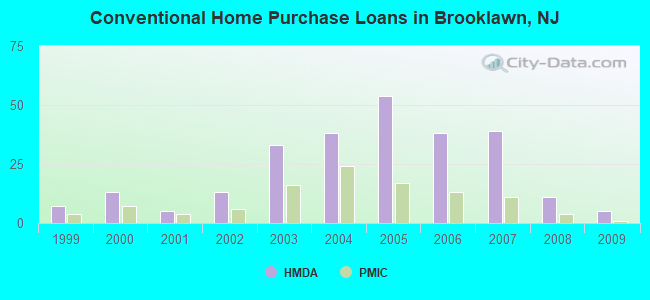
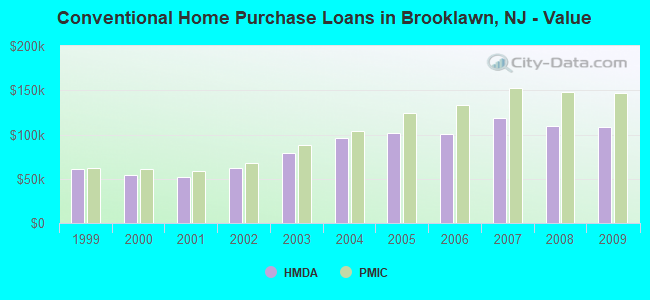
B) Conventional Home Purchase Loans
C) Refinancings
D) Home Improvement Loans
E) Loans on Dwellings For 5+ Families
F) Non-occupant Loans on < 5 Family Dwellings (A B C & D)
Number
Average Value
Number
Average Value
Number
Average Value
Number
Average Value
Number
Average Value
Number
Average Value
LOANS ORIGINATED
17
$131,118
5
$108,000
25
$135,960
4
$50,000
0
$0
2
$34,500
APPLICATIONS APPROVED, NOT ACCEPTED
0
$0
0
$0
3
$164,333
0
$0
0
$0
0
$0
APPLICATIONS DENIED
2
$134,500
1
$203,000
18
$144,333
2
$6,500
0
$0
2
$205,000
APPLICATIONS WITHDRAWN
3
$137,000
0
$0
4
$142,500
1
$9,000
1
$2,400,000
0
$0
FILES CLOSED FOR INCOMPLETENESS
0
$0
0
$0
1
$224,000
0
$0
0
$0
0
$0
Aggregated Statistics For Year 2008 (Based on 1 full tract)
A) FHA, FSA/RHS & VA Home Purchase Loans
B) Conventional Home Purchase Loans
C) Refinancings
D) Home Improvement Loans
F) Non-occupant Loans on < 5 Family Dwellings (A B C & D)
Number
Average Value
Number
Average Value
Number
Average Value
Number
Average Value
Number
Average Value
LOANS ORIGINATED
14
$135,214
11
$110,091
43
$111,047
7
$42,429
6
$116,833
APPLICATIONS APPROVED, NOT ACCEPTED
0
$0
0
$0
4
$100,750
1
$8,000
0
$0
APPLICATIONS DENIED
3
$102,333
3
$116,000
24
$128,292
16
$26,062
6
$68,833
APPLICATIONS WITHDRAWN
5
$105,600
3
$203,667
3
$162,667
0
$0
0
$0
FILES CLOSED FOR INCOMPLETENESS
0
$0
2
$148,000
4
$158,750
0
$0
0
$0
Aggregated Statistics For Year 2007 (Based on 1 full tract)
A) FHA, FSA/RHS & VA Home Purchase Loans
B) Conventional Home Purchase Loans
C) Refinancings
D) Home Improvement Loans
F) Non-occupant Loans on < 5 Family Dwellings (A B C & D)
Number
Average Value
Number
Average Value
Number
Average Value
Number
Average Value
Number
Average Value
LOANS ORIGINATED
3
$170,333
39
$119,077
46
$106,957
13
$39,231
6
$93,667
APPLICATIONS APPROVED, NOT ACCEPTED
1
$109,000
8
$143,000
7
$90,857
3
$10,000
3
$116,000
APPLICATIONS DENIED
0
$0
6
$137,000
32
$105,875
11
$29,818
4
$91,000
APPLICATIONS WITHDRAWN
0
$0
5
$121,600
17
$94,588
3
$53,333
2
$140,000
FILES CLOSED FOR INCOMPLETENESS
1
$155,000
2
$70,500
8
$142,500
0
$0
0
$0
Aggregated Statistics For Year 2006 (Based on 1 full tract)
A) FHA, FSA/RHS & VA Home Purchase Loans
B) Conventional Home Purchase Loans
C) Refinancings
D) Home Improvement Loans
F) Non-occupant Loans on < 5 Family Dwellings (A B C & D)
G) Loans On Manufactured Home Dwelling (A B C & D)
Number
Average Value
Number
Average Value
Number
Average Value
Number
Average Value
Number
Average Value
Number
Average Value
LOANS ORIGINATED
8
$132,250
38
$100,789
55
$102,109
27
$34,704
9
$88,667
0
$0
APPLICATIONS APPROVED, NOT ACCEPTED
0
$0
7
$96,571
7
$75,571
3
$11,667
2
$86,500
0
$0
APPLICATIONS DENIED
0
$0
9
$110,889
20
$104,350
11
$41,636
0
$0
1
$156,000
APPLICATIONS WITHDRAWN
1
$130,000
7
$121,000
22
$102,000
2
$61,500
0
$0
0
$0
FILES CLOSED FOR INCOMPLETENESS
0
$0
0
$0
7
$87,429
1
$10,000
1
$109,000
0
$0
Aggregated Statistics For Year 2005 (Based on 1 full tract)
A) FHA, FSA/RHS & VA Home Purchase Loans
B) Conventional Home Purchase Loans
C) Refinancings
D) Home Improvement Loans
E) Loans on Dwellings For 5+ Families
F) Non-occupant Loans on < 5 Family Dwellings (A B C & D)
G) Loans On Manufactured Home Dwelling (A B C & D)
Number
Average Value
Number
Average Value
Number
Average Value
Number
Average Value
Number
Average Value
Number
Average Value
Number
Average Value
LOANS ORIGINATED
10
$117,500
54
$101,241
61
$98,328
11
$25,636
0
$0
19
$85,421
0
$0
APPLICATIONS APPROVED, NOT ACCEPTED
0
$0
1
$104,000
15
$85,600
4
$25,000
0
$0
0
$0
0
$0
APPLICATIONS DENIED
0
$0
4
$103,500
30
$96,533
5
$43,800
0
$0
2
$86,000
1
$13,000
APPLICATIONS WITHDRAWN
0
$0
5
$97,800
28
$100,321
5
$132,200
0
$0
2
$120,500
0
$0
FILES CLOSED FOR INCOMPLETENESS
0
$0
1
$130,000
6
$114,500
0
$0
1
$102,000
2
$172,500
0
$0
Aggregated Statistics For Year 2004 (Based on 1 full tract)
A) FHA, FSA/RHS & VA Home Purchase Loans
B) Conventional Home Purchase Loans
C) Refinancings
D) Home Improvement Loans
E) Loans on Dwellings For 5+ Families
F) Non-occupant Loans on < 5 Family Dwellings (A B C & D)
Number
Average Value
Number
Average Value
Number
Average Value
Number
Average Value
Number
Average Value
Number
Average Value
LOANS ORIGINATED
6
$95,333
38
$95,868
63
$79,873
12
$35,750
0
$0
9
$99,444
APPLICATIONS APPROVED, NOT ACCEPTED
1
$52,000
4
$106,750
14
$87,643
5
$21,000
0
$0
0
$0
APPLICATIONS DENIED
1
$80,000
5
$99,600
34
$75,618
9
$23,444
0
$0
5
$85,400
APPLICATIONS WITHDRAWN
0
$0
3
$78,000
20
$91,000
1
$130,000
1
$16,000
0
$0
FILES CLOSED FOR INCOMPLETENESS
0
$0
1
$100,000
5
$84,000
1
$22,000
0
$0
1
$100,000
Aggregated Statistics For Year 2003 (Based on 1 full tract)
A) FHA, FSA/RHS & VA Home Purchase Loans
B) Conventional Home Purchase Loans
C) Refinancings
D) Home Improvement Loans
F) Non-occupant Loans on < 5 Family Dwellings (A B C & D)
Number
Average Value
Number
Average Value
Number
Average Value
Number
Average Value
Number
Average Value
LOANS ORIGINATED
10
$82,300
33
$79,394
84
$71,060
9
$19,222
7
$64,857
APPLICATIONS APPROVED, NOT ACCEPTED
1
$74,000
6
$99,667
16
$74,312
0
$0
4
$70,750
APPLICATIONS DENIED
2
$86,500
5
$74,200
43
$75,233
19
$24,737
8
$30,875
APPLICATIONS WITHDRAWN
4
$94,250
1
$100,000
19
$80,316
0
$0
1
$85,000
FILES CLOSED FOR INCOMPLETENESS
0
$0
1
$65,000
1
$56,000
1
$33,000
1
$56,000
Aggregated Statistics For Year 2002 (Based on 1 full tract)
A) FHA, FSA/RHS & VA Home Purchase Loans
B) Conventional Home Purchase Loans
C) Refinancings
D) Home Improvement Loans
E) Loans on Dwellings For 5+ Families
F) Non-occupant Loans on < 5 Family Dwellings (A B C & D)
Number
Average Value
Number
Average Value
Number
Average Value
Number
Average Value
Number
Average Value
Number
Average Value
LOANS ORIGINATED
12
$78,083
13
$61,692
46
$63,087
11
$21,273
1
$180,000
8
$47,500
APPLICATIONS APPROVED, NOT ACCEPTED
0
$0
1
$60,000
12
$55,417
3
$16,667
0
$0
1
$30,000
APPLICATIONS DENIED
2
$70,500
3
$53,333
31
$62,774
12
$15,083
0
$0
1
$30,000
APPLICATIONS WITHDRAWN
0
$0
1
$55,000
29
$71,931
2
$13,500
0
$0
1
$90,000
FILES CLOSED FOR INCOMPLETENESS
0
$0
0
$0
6
$62,667
0
$0
0
$0
0
$0
Aggregated Statistics For Year 2001 (Based on 1 full tract)
A) FHA, FSA/RHS & VA Home Purchase Loans
B) Conventional Home Purchase Loans
C) Refinancings
D) Home Improvement Loans
F) Non-occupant Loans on < 5 Family Dwellings (A B C & D)
Number
Average Value
Number
Average Value
Number
Average Value
Number
Average Value
Number
Average Value
LOANS ORIGINATED
14
$70,214
5
$51,800
32
$53,812
10
$33,500
3
$50,333
APPLICATIONS APPROVED, NOT ACCEPTED
1
$92,000
1
$38,000
8
$58,875
4
$19,500
0
$0
APPLICATIONS DENIED
1
$84,000
2
$52,000
10
$54,100
6
$14,167
2
$17,500
APPLICATIONS WITHDRAWN
1
$52,000
2
$85,500
16
$81,312
3
$10,333
0
$0
FILES CLOSED FOR INCOMPLETENESS
0
$0
0
$0
1
$25,000
0
$0
0
$0
Aggregated Statistics For Year 2000 (Based on 1 full tract)
A) FHA, FSA/RHS & VA Home Purchase Loans
B) Conventional Home Purchase Loans
C) Refinancings
D) Home Improvement Loans
F) Non-occupant Loans on < 5 Family Dwellings (A B C & D)
Number
Average Value
Number
Average Value
Number
Average Value
Number
Average Value
Number
Average Value
LOANS ORIGINATED
21
$62,619
13
$54,769
13
$53,846
9
$16,889
4
$46,750
APPLICATIONS APPROVED, NOT ACCEPTED
1
$82,000
2
$58,500
6
$55,000
3
$17,000
1
$52,000
APPLICATIONS DENIED
2
$67,500
2
$61,500
16
$53,375
13
$21,538
0
$0
APPLICATIONS WITHDRAWN
1
$102,000
0
$0
12
$56,167
2
$24,000
2
$89,000
FILES CLOSED FOR INCOMPLETENESS
1
$22,000
1
$56,000
2
$26,000
0
$0
0
$0
Aggregated Statistics For Year 1999 (Based on 1 partial tract)
A) FHA, FSA/RHS & VA Home Purchase Loans
B) Conventional Home Purchase Loans
C) Refinancings
D) Home Improvement Loans
F) Non-occupant Loans on < 5 Family Dwellings (A B C & D)
Detailed PMIC statistics for the following Tracts:6053.00
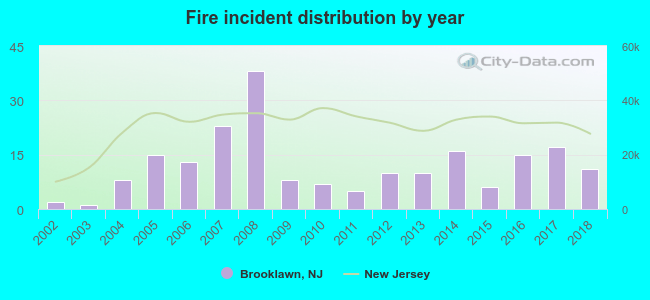
2002 - 2018 National Fire Incident Reporting System (NFIRS) incidents
Based on the data from the years 2002 - 2018 the average number of fire incidents per year is 12. The highest number of reported fires - 38 took place in 2008, and the least - 1 in 2003. The data has an increasing trend.
When looking into fire subcategories, the most incidents belonged to: Structure Fires (49.8%), and Outside Fires (32.2%).
Fire incident types reported to NFIRS in Brooklawn, NJ


 Recent articles from our blog. Our writers, many of them Ph.D. graduates or candidates, create easy-to-read articles on a wide variety of topics.

 (4.1 miles
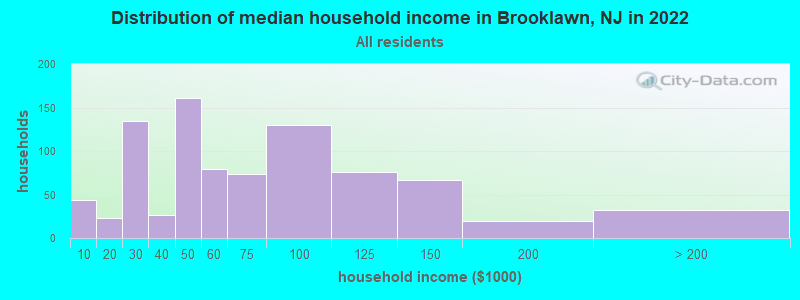


 Based on the data from the years 2002 - 2018 the average number of fire incidents per year is 12. The highest number of reported fires - 38 took place in 2008, and the least - 1 in 2003. The data has an increasing trend.
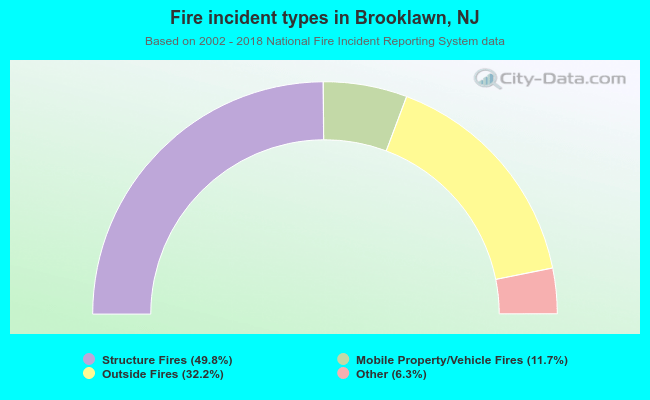 When looking into fire subcategories, the most incidents belonged to: Structure Fires (49.8%), and Outside Fires (32.2%).